|
Your search criteria found 2270 images Target is Earth (and available satellites) |
| My List |
Addition Date | Target | Mission |
Instrument
|
Size |

|
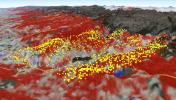
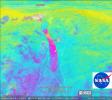
2014-09-02 | Earth |
Aqua |
MODIS |
6843x3890x3 |
|
|||||
|
|
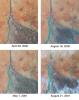
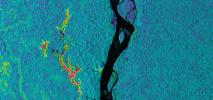
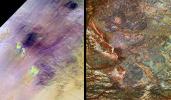
2001-08-29 | Earth |
Terra |
MISR |
983x1250x3 |
|
|||||
|
|
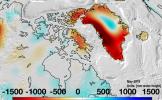
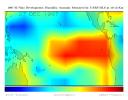
2018-06-11 | Earth |
GRACE-FO |
Microwave Ranging Instrument |
1032x409x3 |

|
|||||
|
|
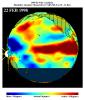
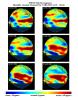
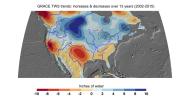
2019-08-20 | Earth |
GRACE-FO |
Microwave Ranging Instrument |
2457x1513x3 |

|
|||||
|
|
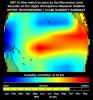
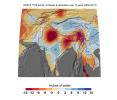
2019-08-20 | Earth |
GRACE-FO |
Microwave Ranging Instrument |
2454x1516x3 |
|
|||||
|
|
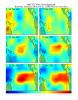
1998-03-16 | Earth |
Terra |
MLS |
2550x3009x3 |
|
|||||
|
|
1998-03-26 | Earth |
Terra |
MLS |
2550x3300x3 |
|
|||||
|
|
1997-10-30 | Earth |
Terra |
MLS |
1517x1645x3 |
|
|||||
|
|
1998-03-14 | Earth |
Terra |
MLS |
1152x900x3 |
|
|||||
|
|
1998-03-14 | Earth |
Terra |
MLS |
695x900x3 |
|
|||||
|
|
1998-07-03 | Earth |
Advanced Earth Observing Satellite (ADEOS) |
MLS |
1152x849x3 |
|
|||||
|
|
2005-06-02 | Earth |
Aura |
MLS |
1013x939x3 |
|
|||||
|
|
2005-06-02 | Earth |
Aura |
MLS |
642x335x3 |
|
|||||
|
|
2005-06-02 | Earth |
Aura |
MLS |
720x540x3 |
|
|||||
|
|
2010-03-16 | Earth |
Aura |
MLS |
760x760x3 |
|
|||||
|
|
2011-10-02 | Earth |
Aura |
MLS |
708x312x3 |
|
|||||
|
|
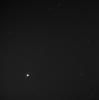
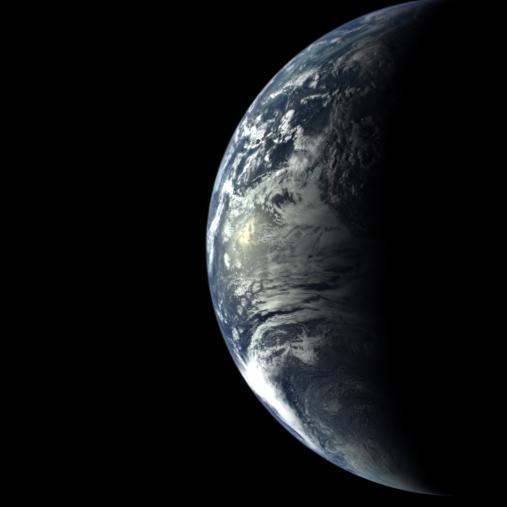
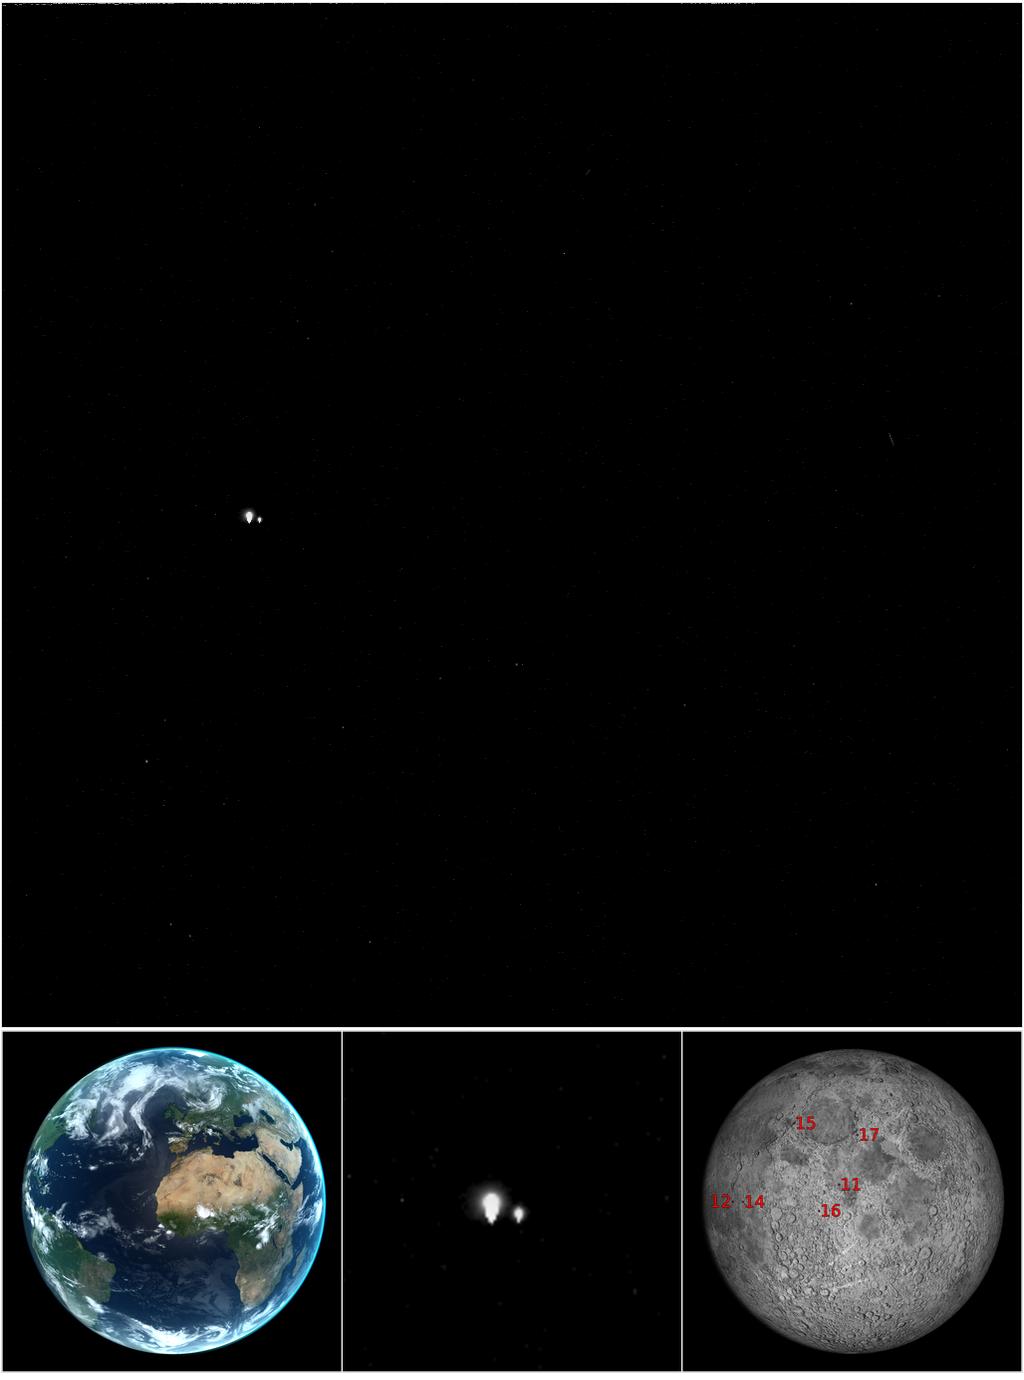
2005-08-02 | Earth |
MESSENGER |
MDIS - Wide Angle |
507x507x3 |

|
|||||
|
|
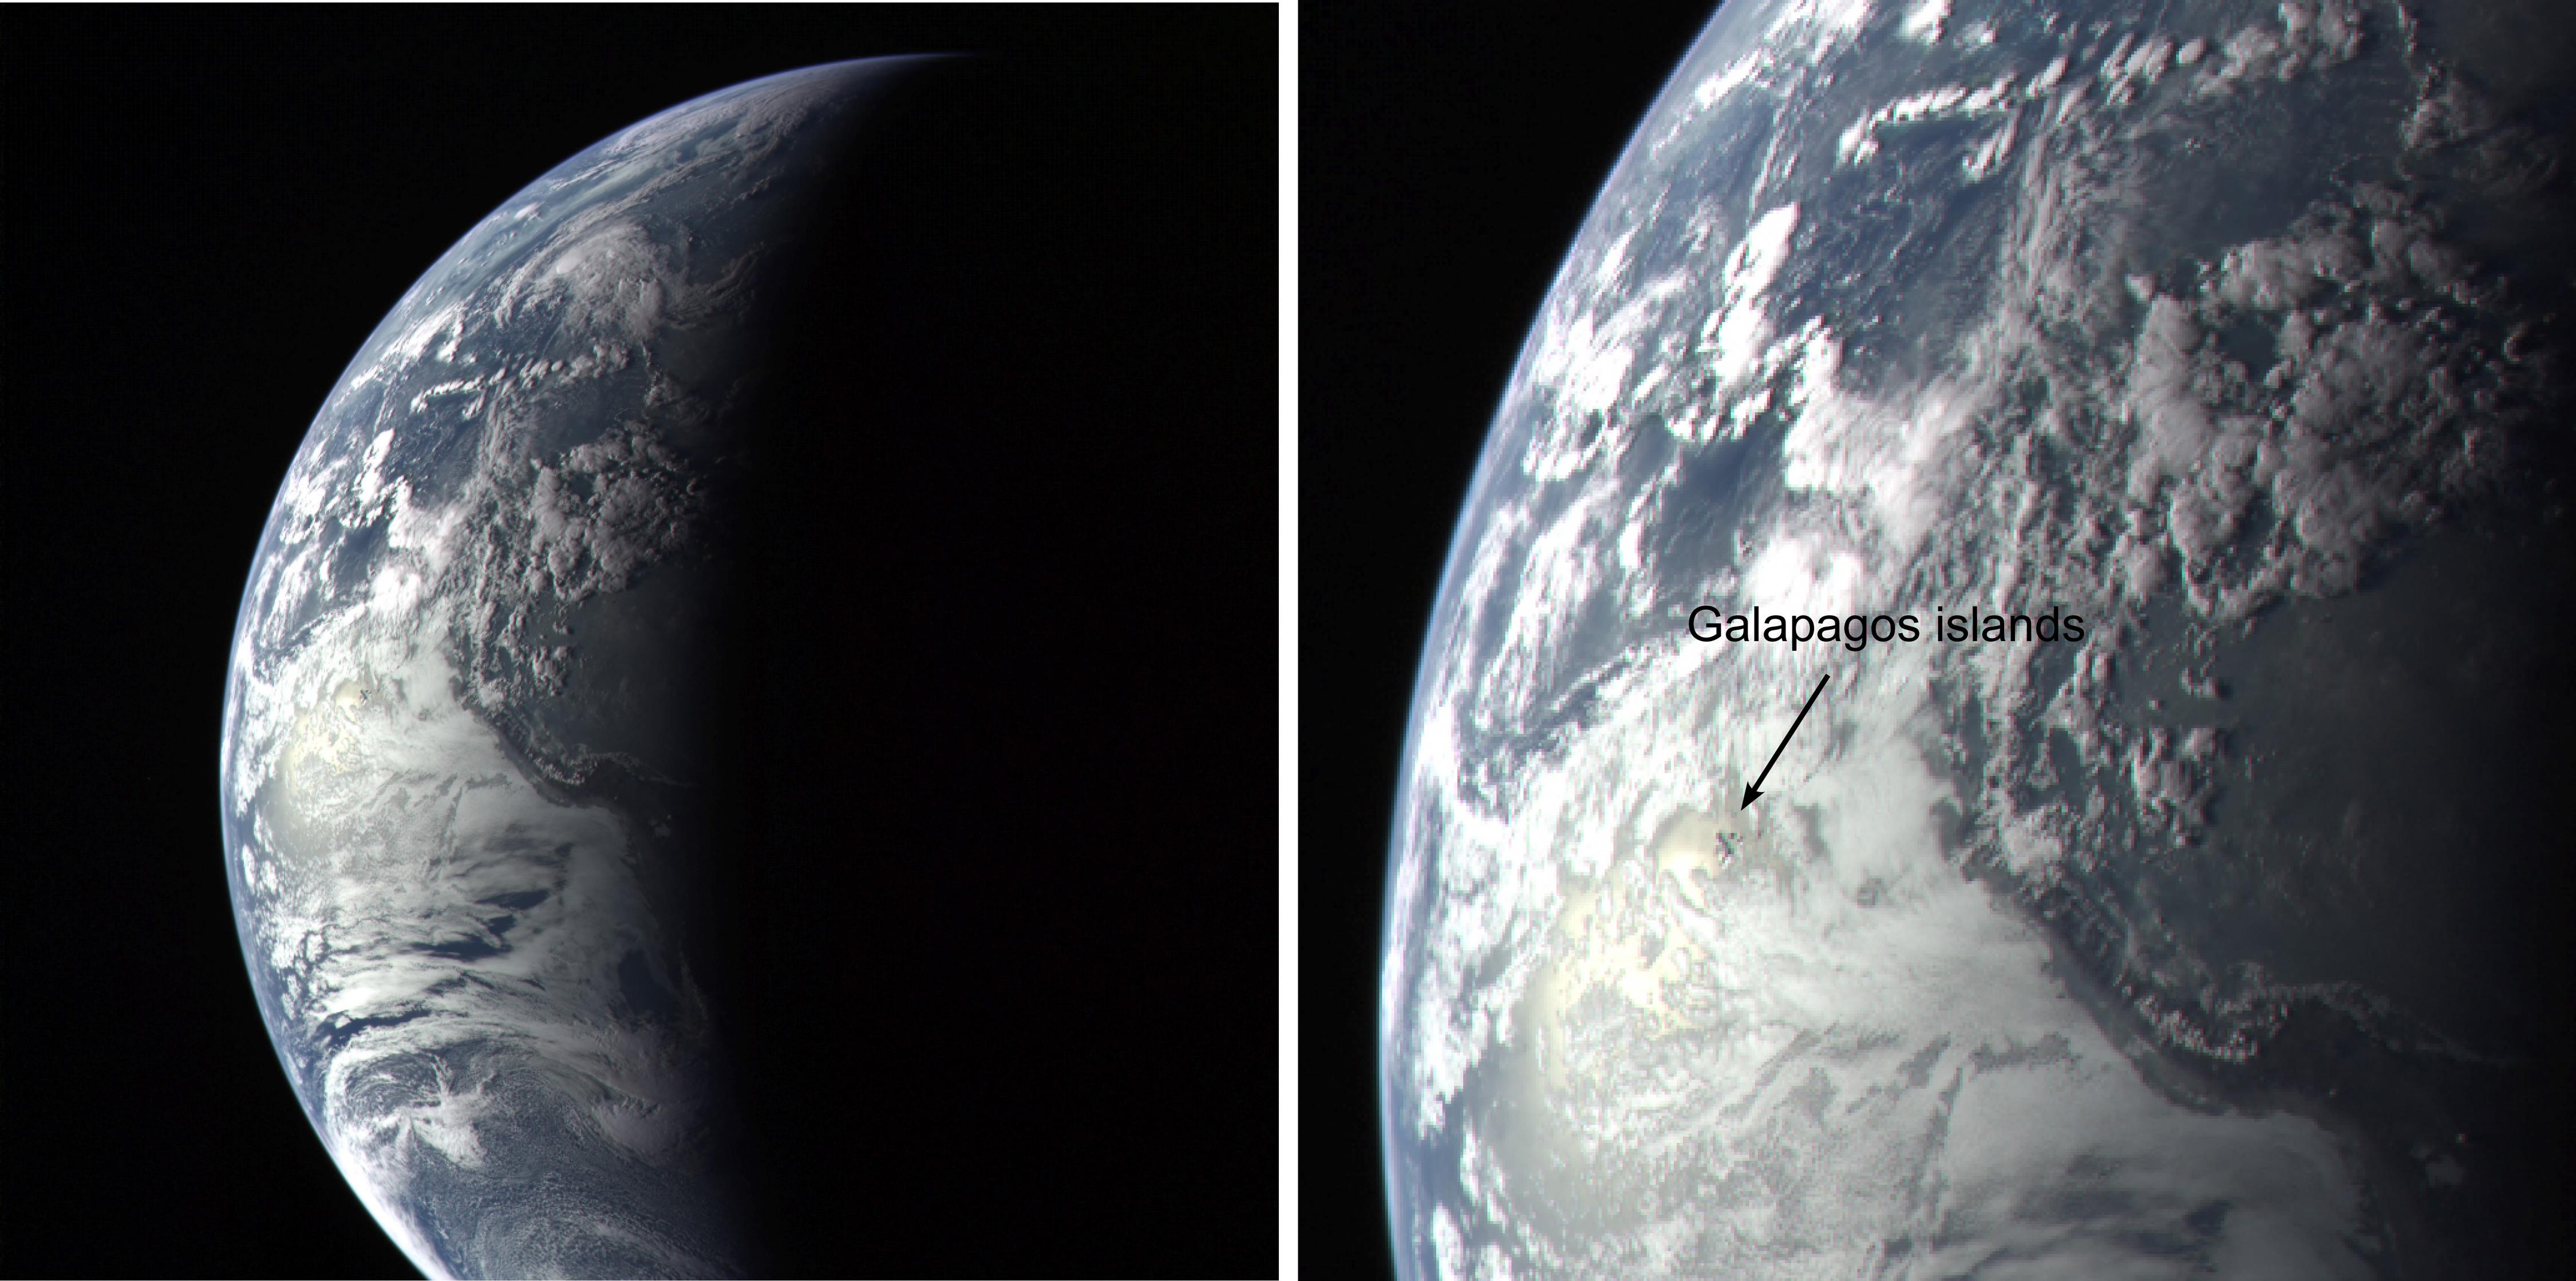
2005-08-02 | Earth |
MESSENGER |
MDIS - Wide Angle |
4500x2238x3 |
|
|||||
|
|
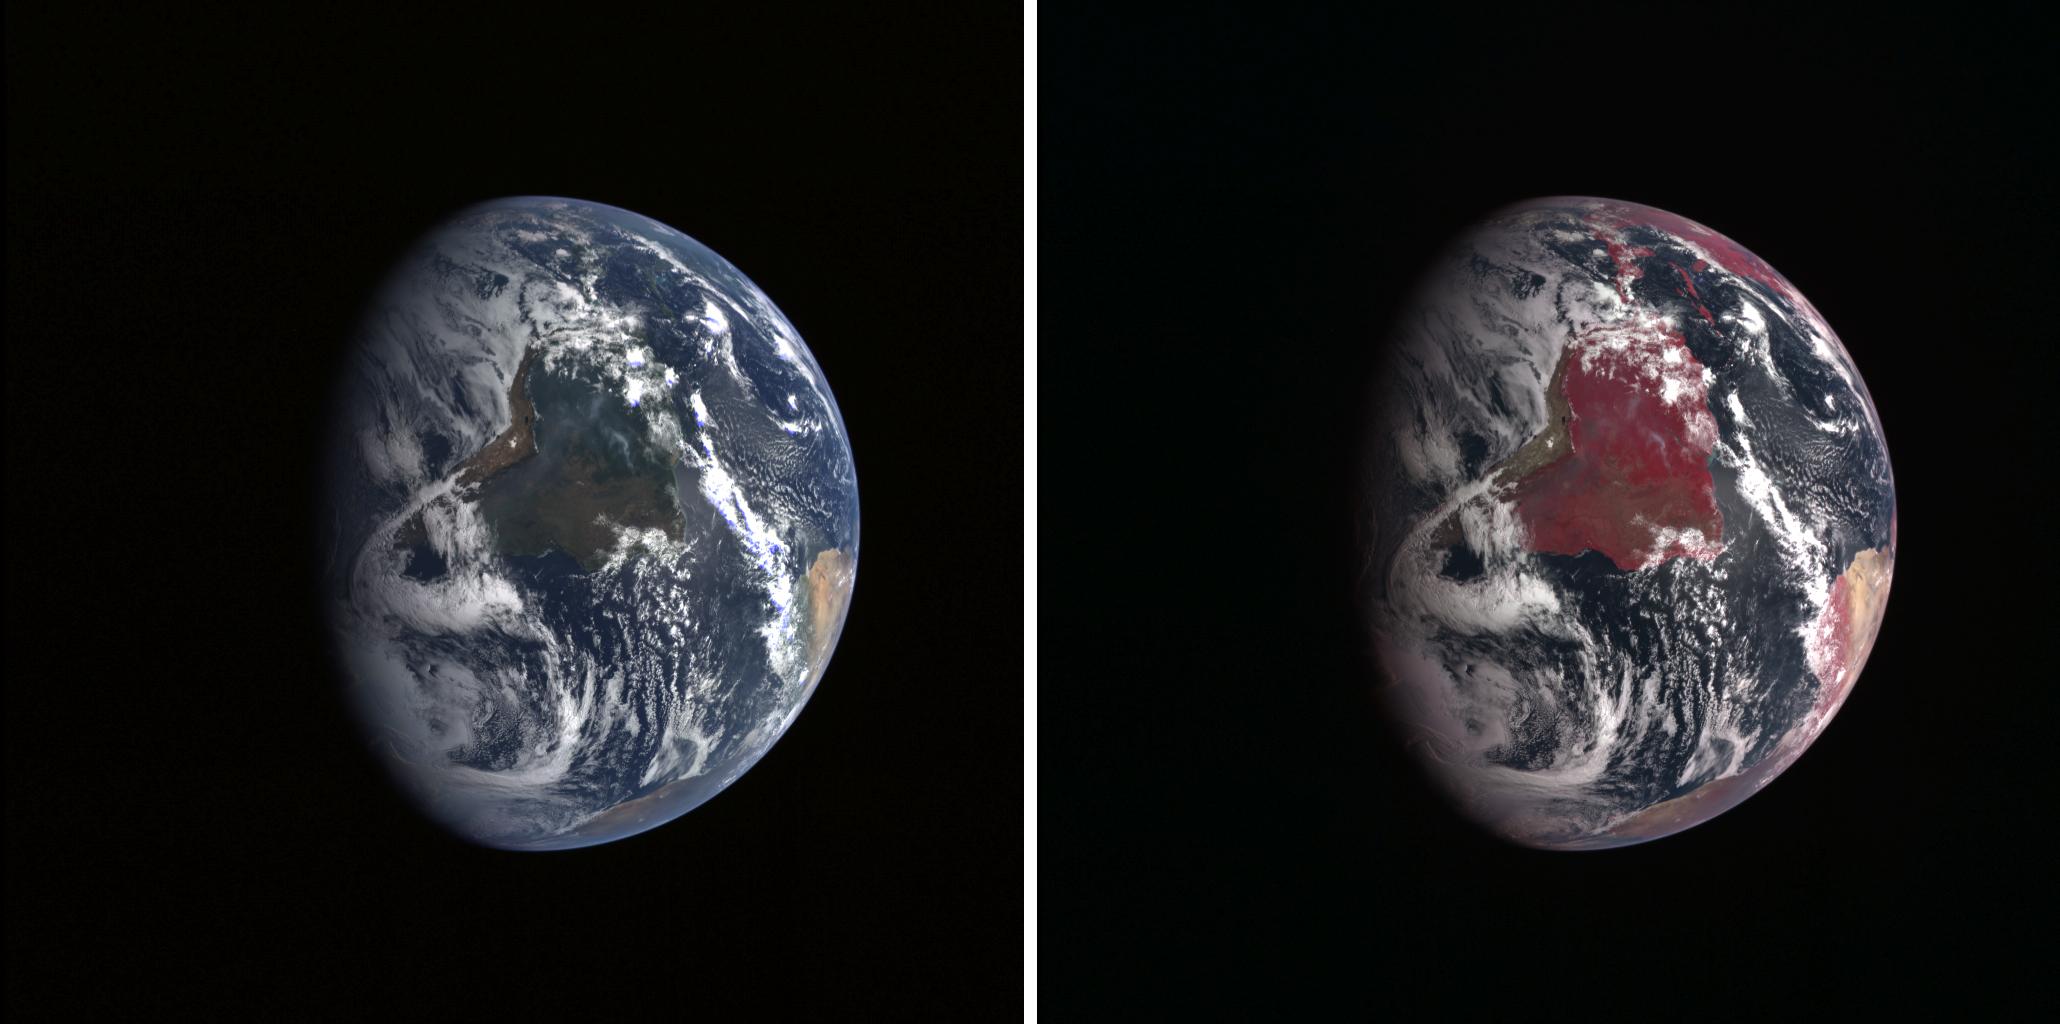
2005-08-02 | Earth |
MESSENGER |
MDIS - Wide Angle |
2060x1024x3 |
|
|||||
|
|
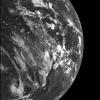
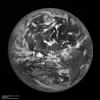
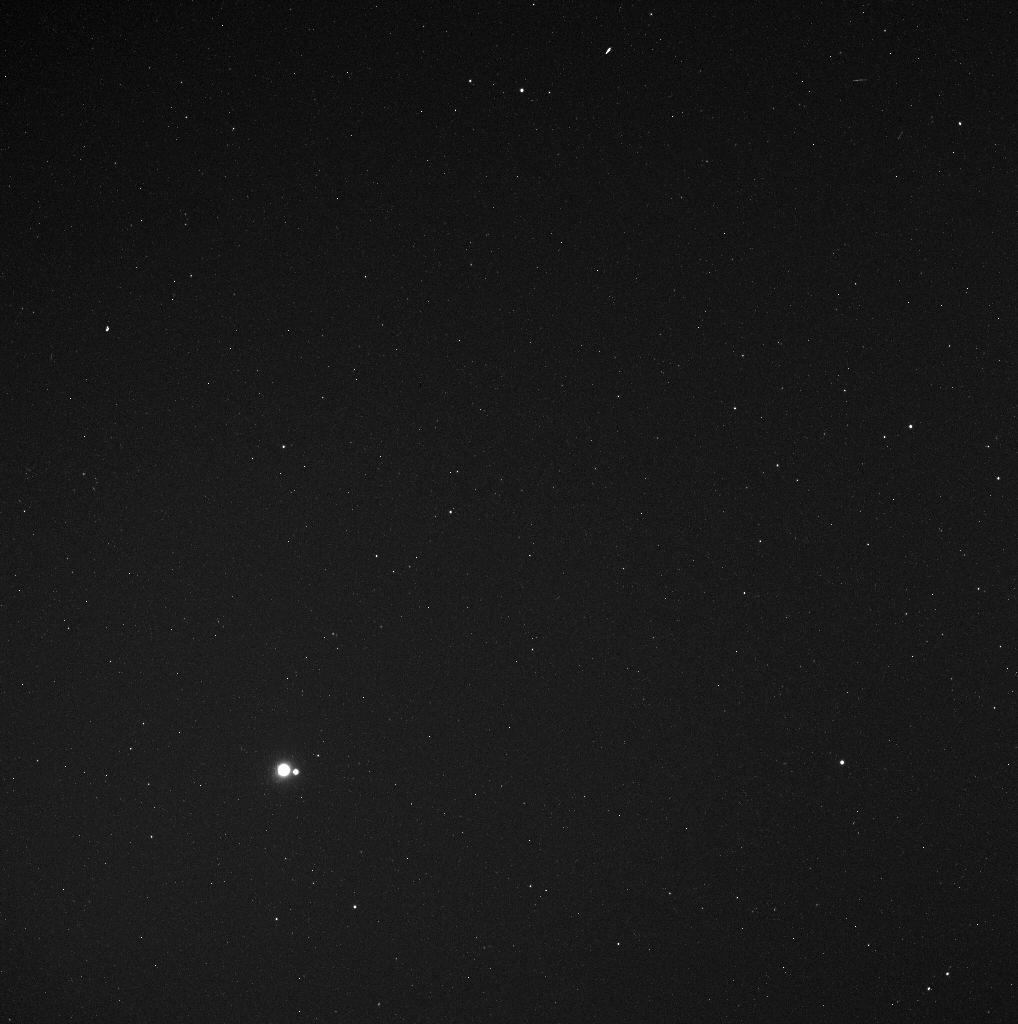
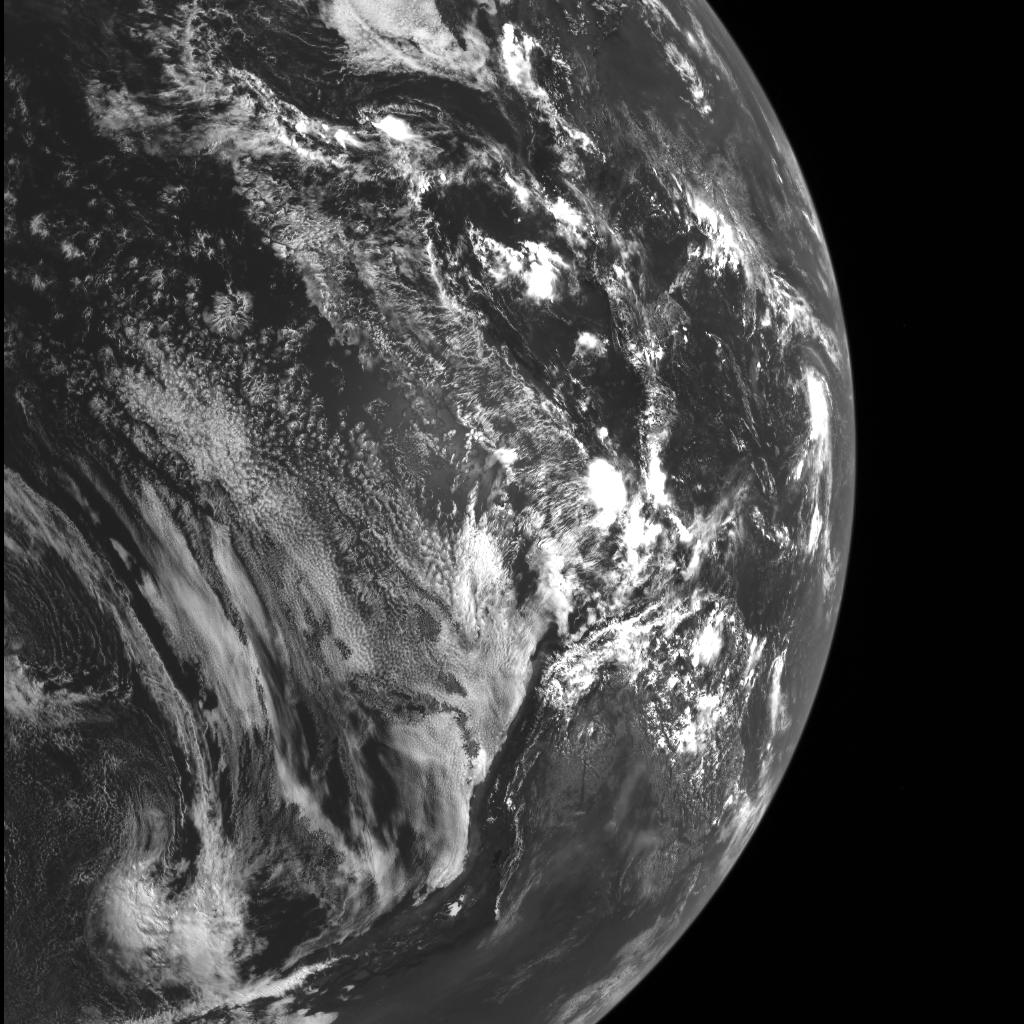
2010-08-17 | Earth |
MESSENGER |
MDIS - Wide Angle |
1018x1024x1 |
|
|||||
|
|
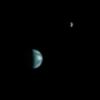
2013-07-22 | Earth |
MESSENGER |
MDIS - Wide Angle |
1024x1380x3 |
|
|||||
|
|
2013-10-18 | Earth |
MESSENGER |
MDIS - Wide Angle |
1024x1024x1 |
|
|||||
|
|
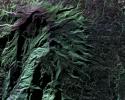
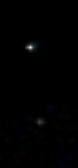
2014-02-06 | Earth |
Mars Science Laboratory (MSL) |
Mastcam |
78x168x3 |
|
|
|||||
|
|
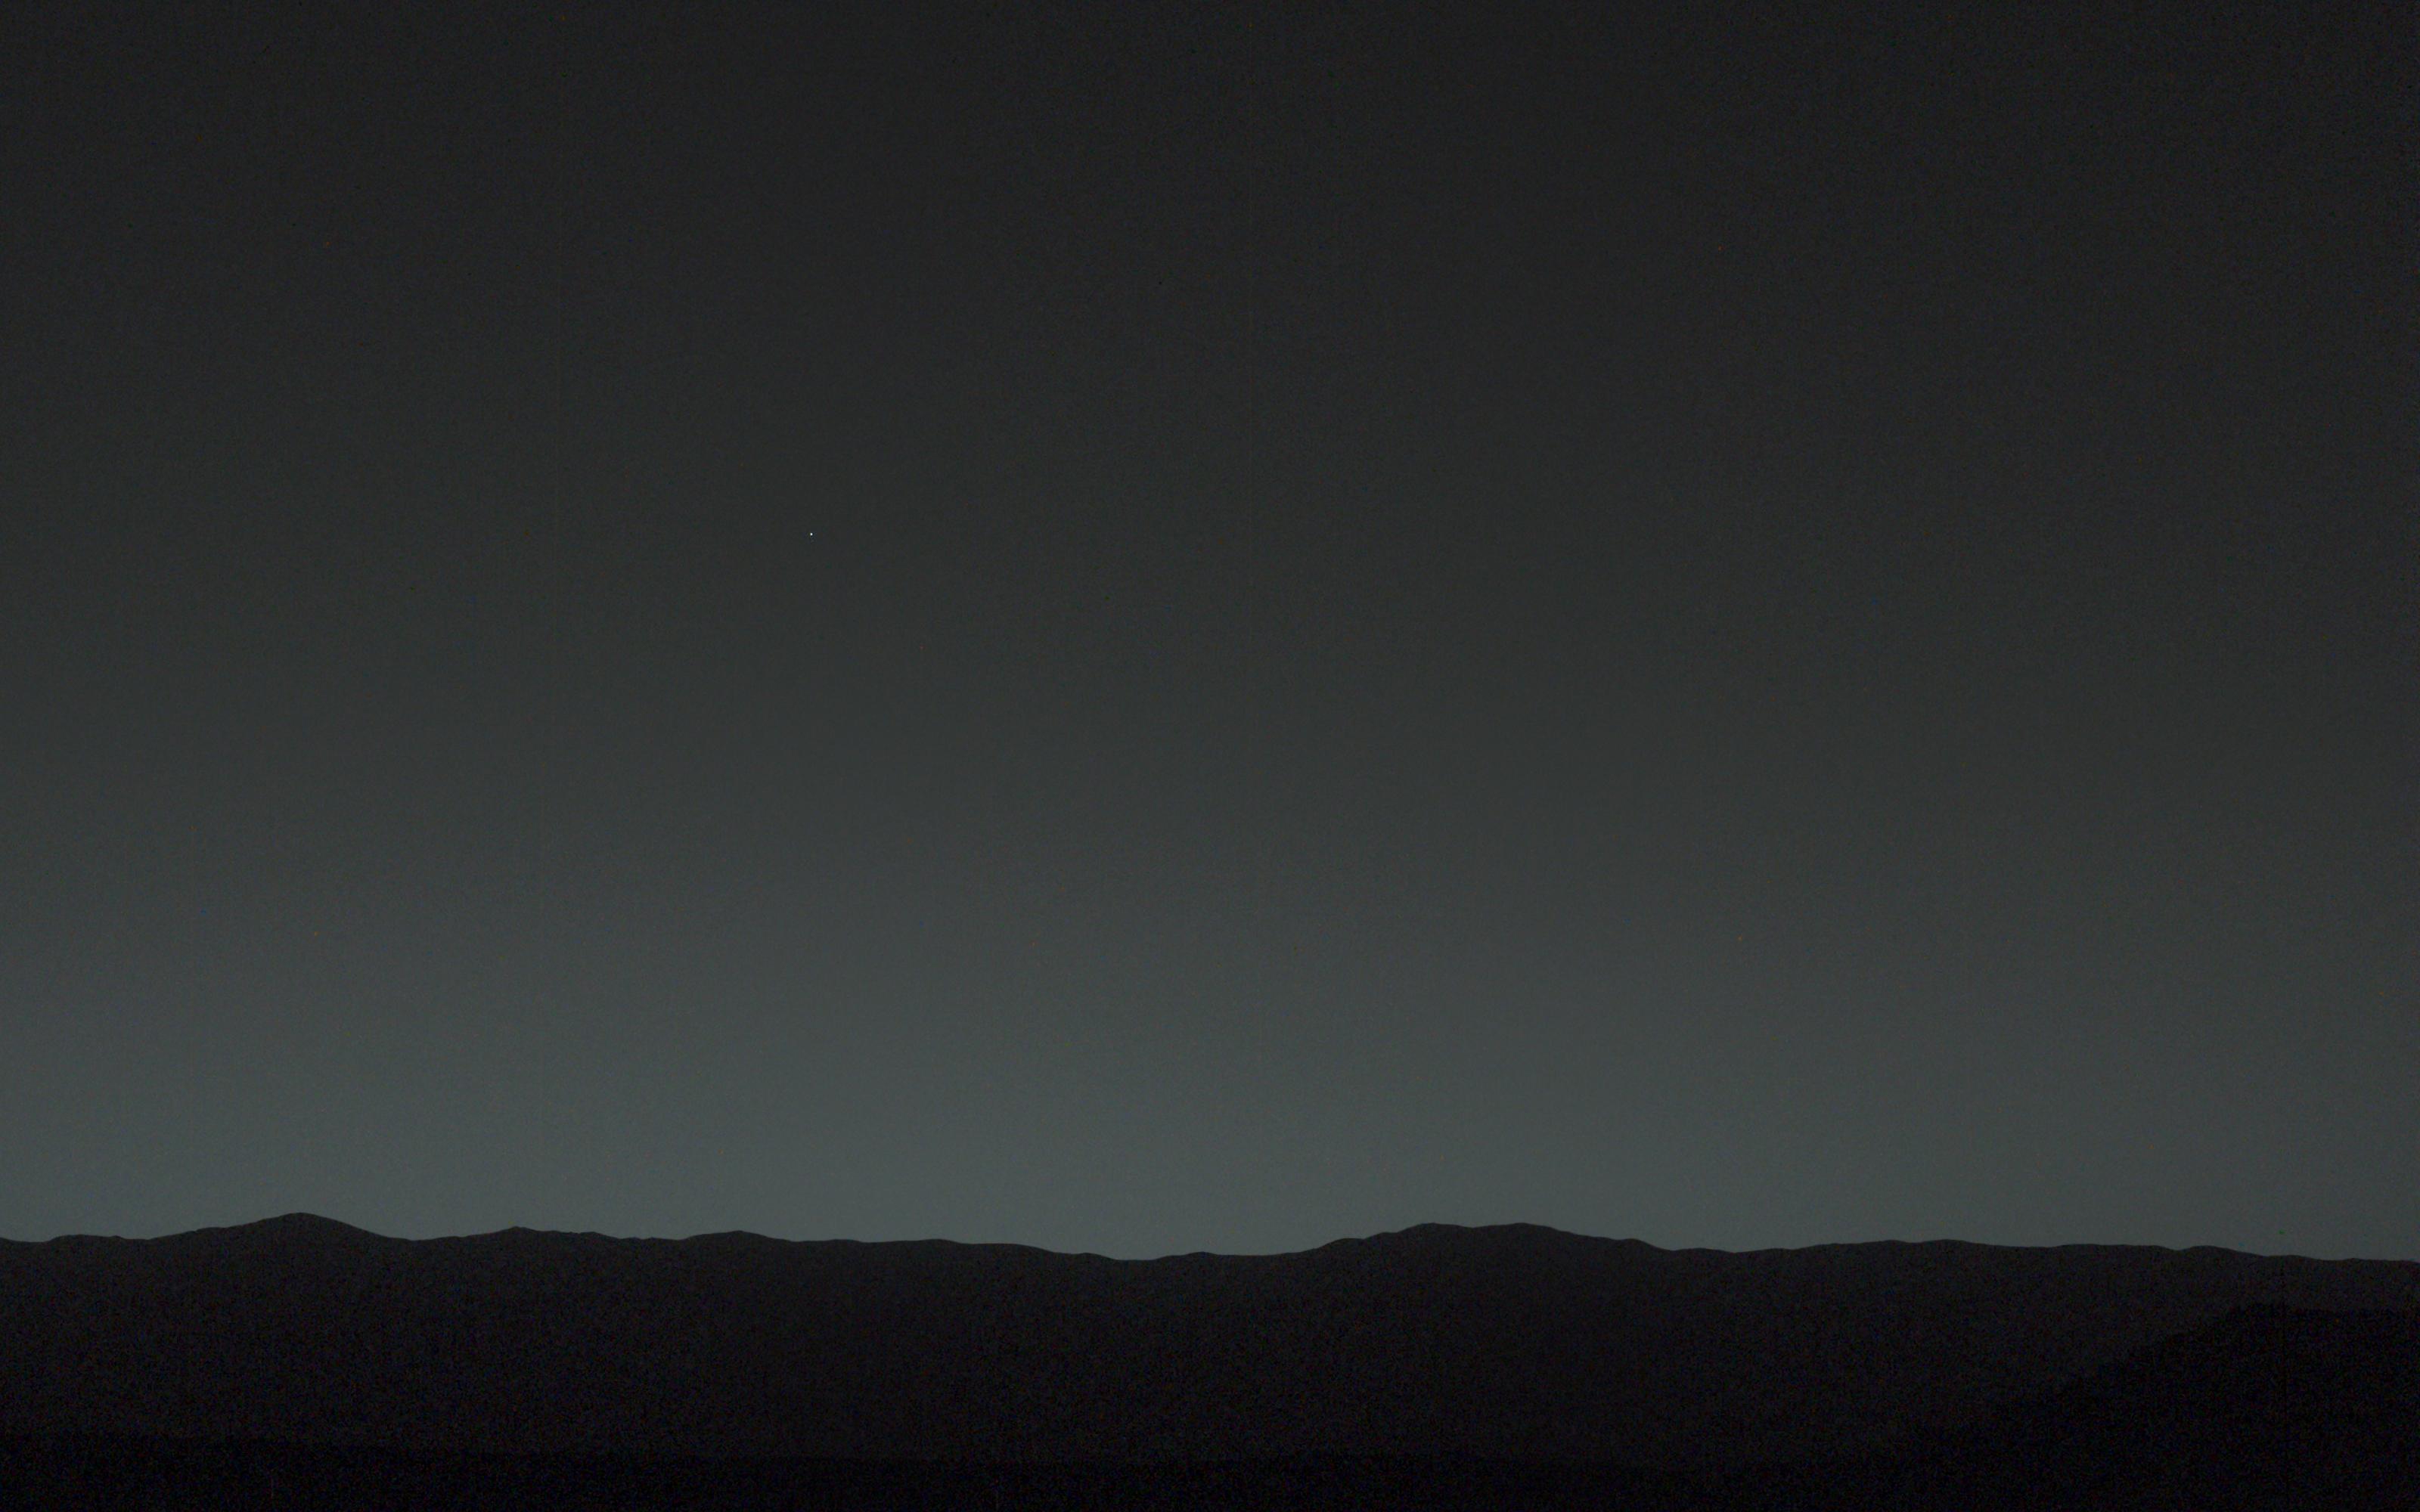
2014-02-06 | Earth |
Mars Science Laboratory (MSL) |
Mastcam |
3200x2000x3 |

|
|||||
|
|
2003-05-22 | Earth |
Mars Global Surveyor (MGS) |
Mars Orbiter Camera (MOC) |
1068x3151x3 |
|
|
|||||
|
|
2003-05-22 | Earth |
Mars Global Surveyor (MGS) |
Mars Orbiter Camera (MOC) |
961x961x3 |
|
|||||
|
|
2010-11-16 | Earth |
Mars Science Laboratory (MSL) |
MAHLI |
1600x1200x3 |
|
|||||
|
|
2010-11-16 | Earth |
Mars Science Laboratory (MSL) |
MAHLI |
1188x1566x3 |
|
|||||
|
|
2010-11-16 | Earth |
Mars Science Laboratory (MSL) |
MAHLI |
1190x1580x3 |
|
|||||
|
|
2010-11-16 | Earth |
Mars Science Laboratory (MSL) |
MAHLI |
1007x1305x3 |
|
|||||
|
|
2005-08-22 | Earth |
Mars Reconnaissance Orbiter (MRO) |
MARCI |
85x75x3 |
|
|||||
|
|
2005-08-22 | Earth |
Mars Reconnaissance Orbiter (MRO) |
MARCI |
700x80x1 |

|
|||||
|
|
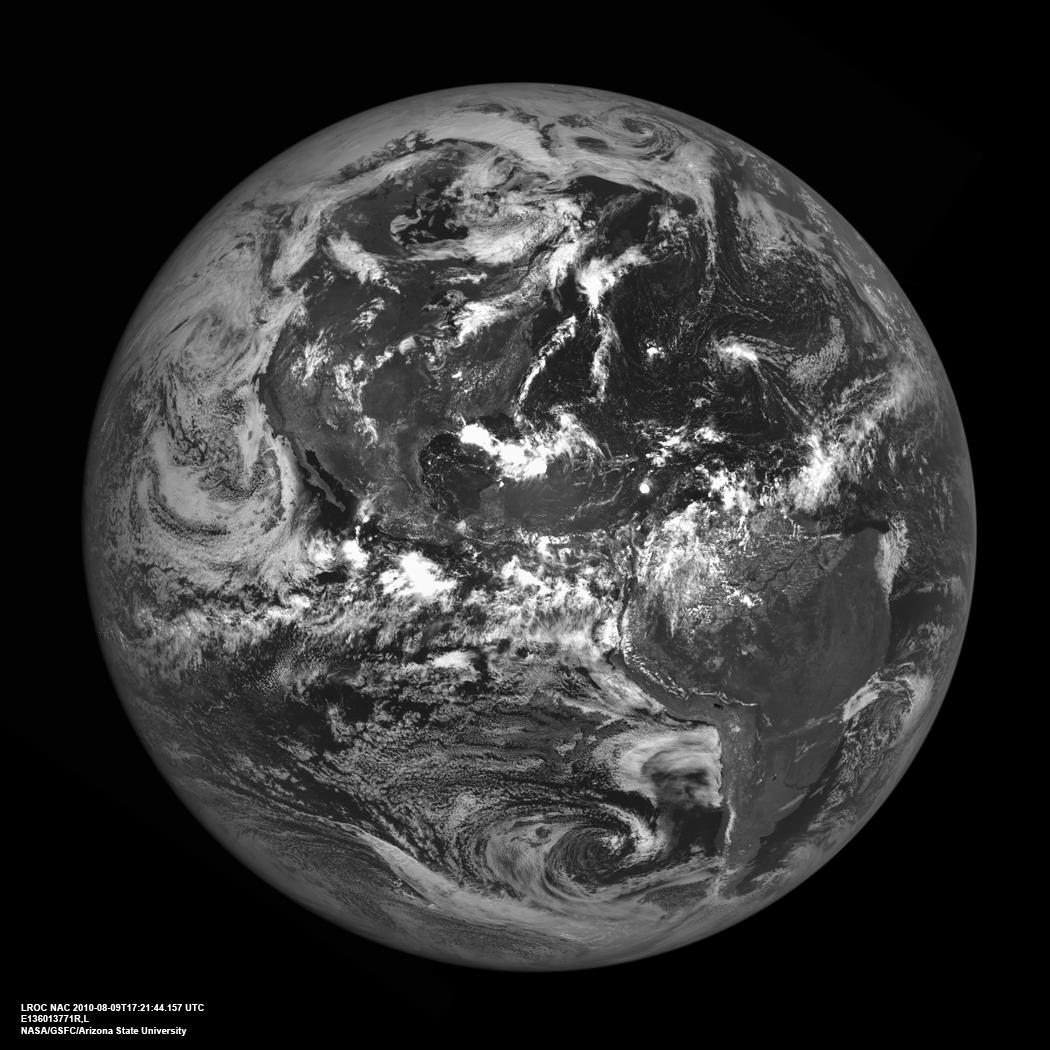
2010-09-15 | Earth |
Lunar Reconnaissance Orbiter (LRO) |
Lunar Reconnaissance Orbiter Camera (NAC) |
1050x1050x1 |
|
|||||
|
|
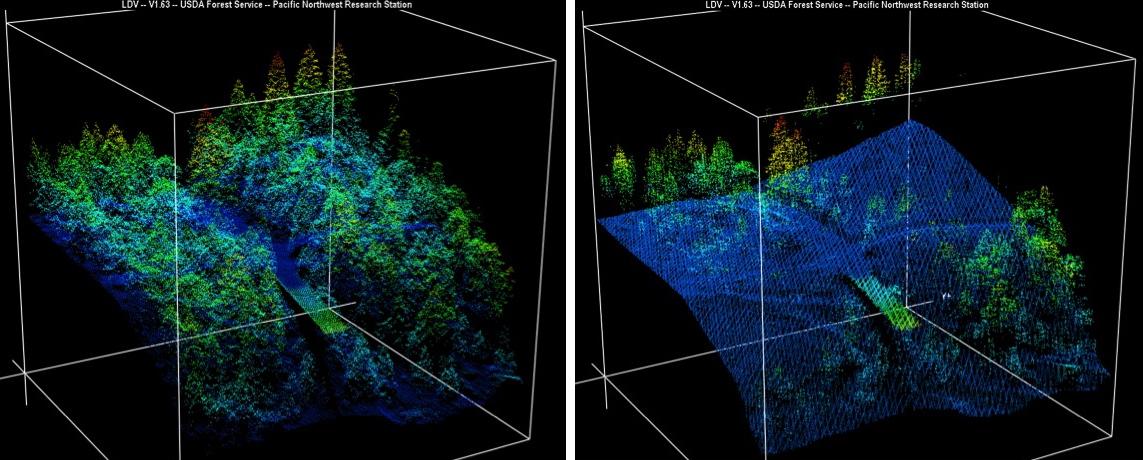
2015-04-09 | Earth |
LIDAR |
1143x460x3 | |
|
|||||
|
|
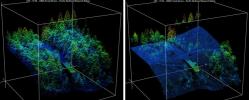
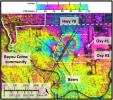
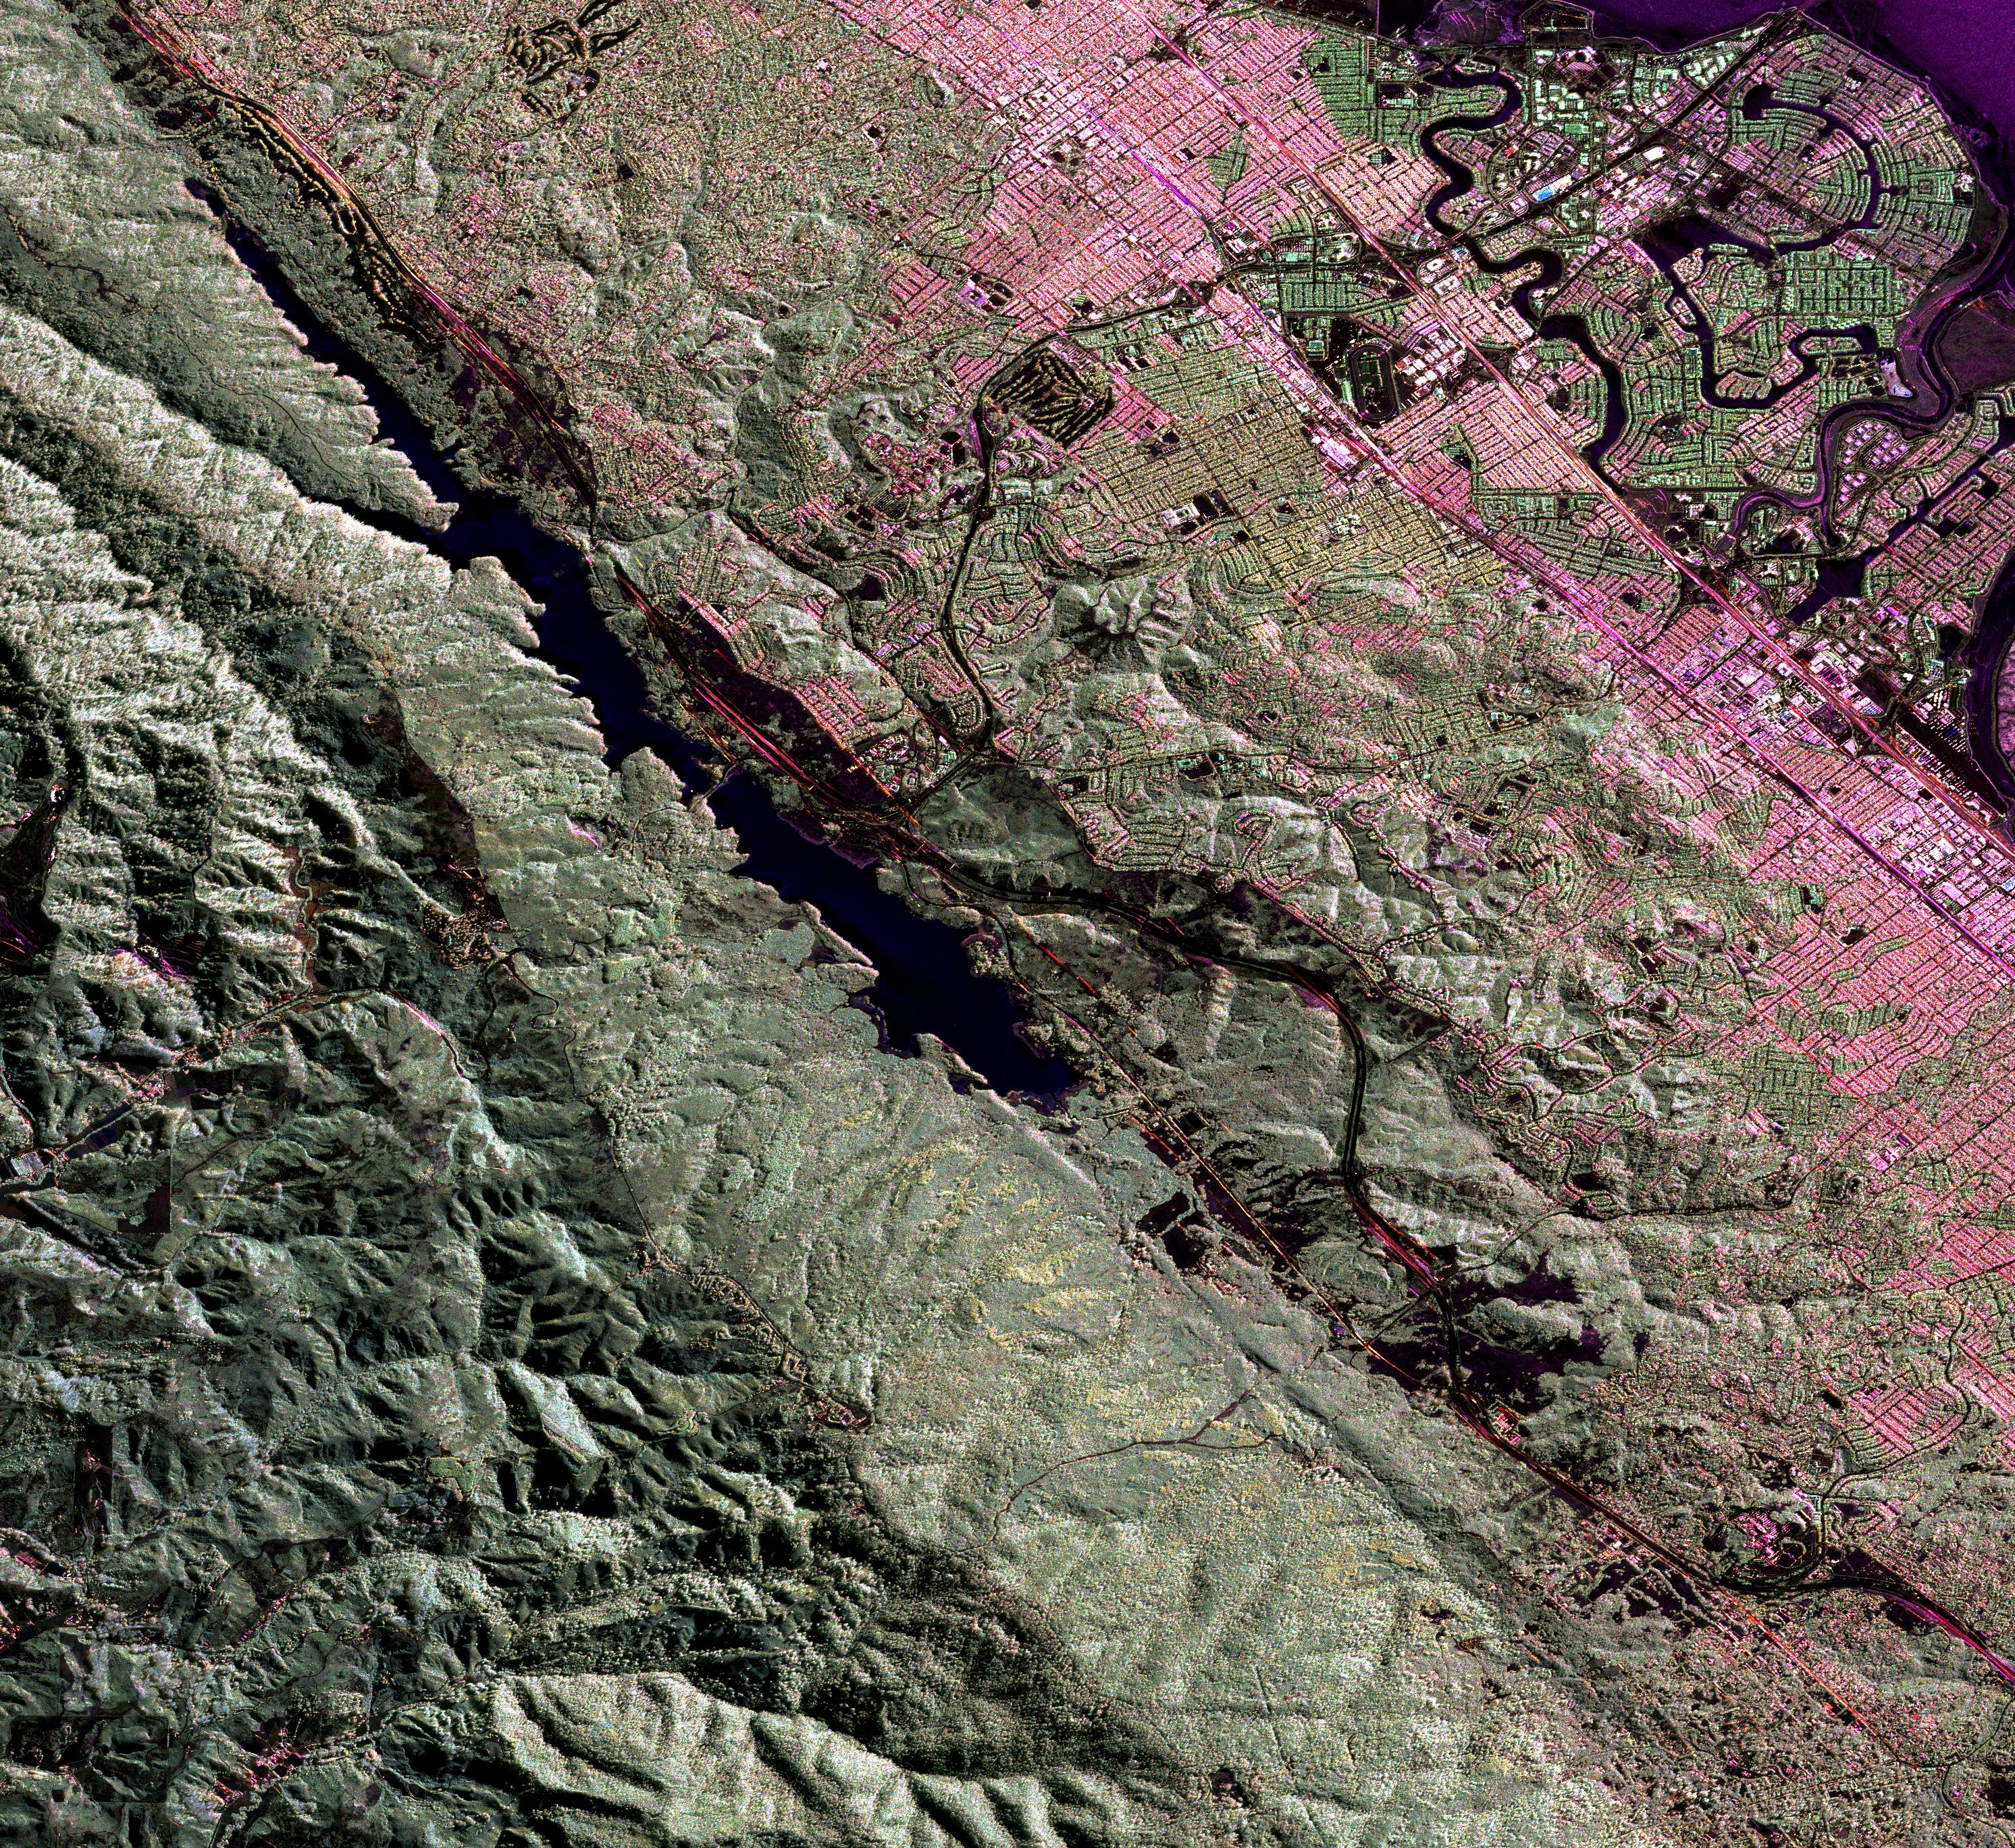
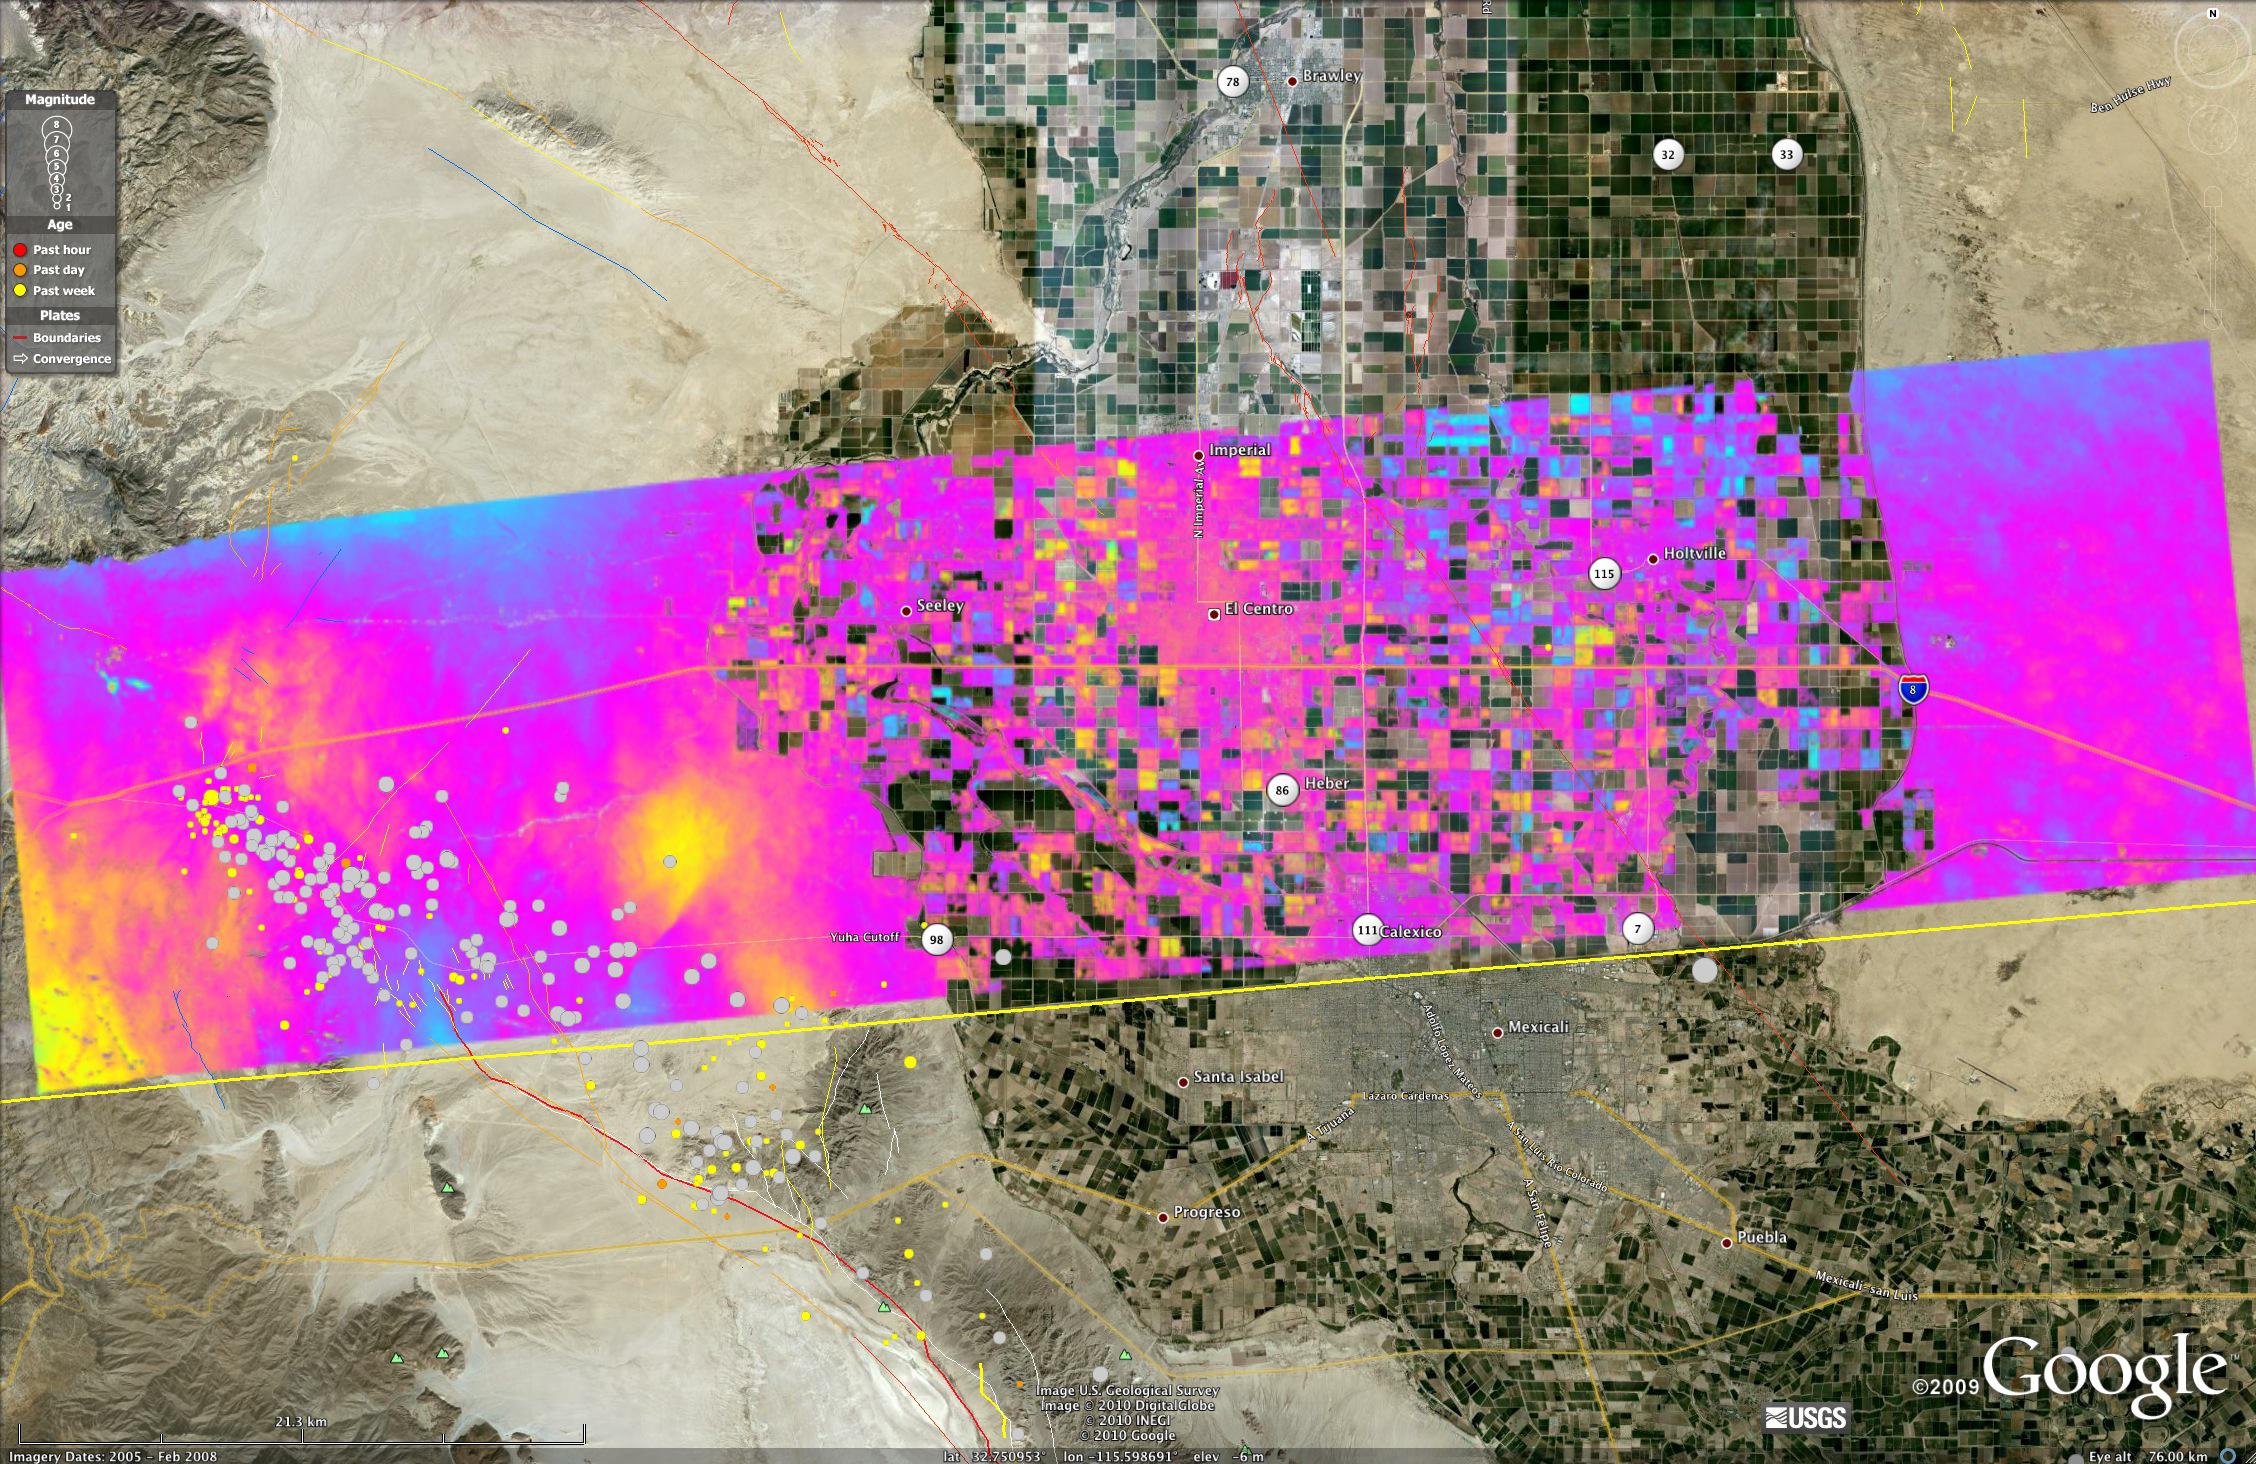
2009-06-18 | Earth |
UAVSAR |
L-Band UAVSAR |
2984x2737x3 |

|
|||||
|
|
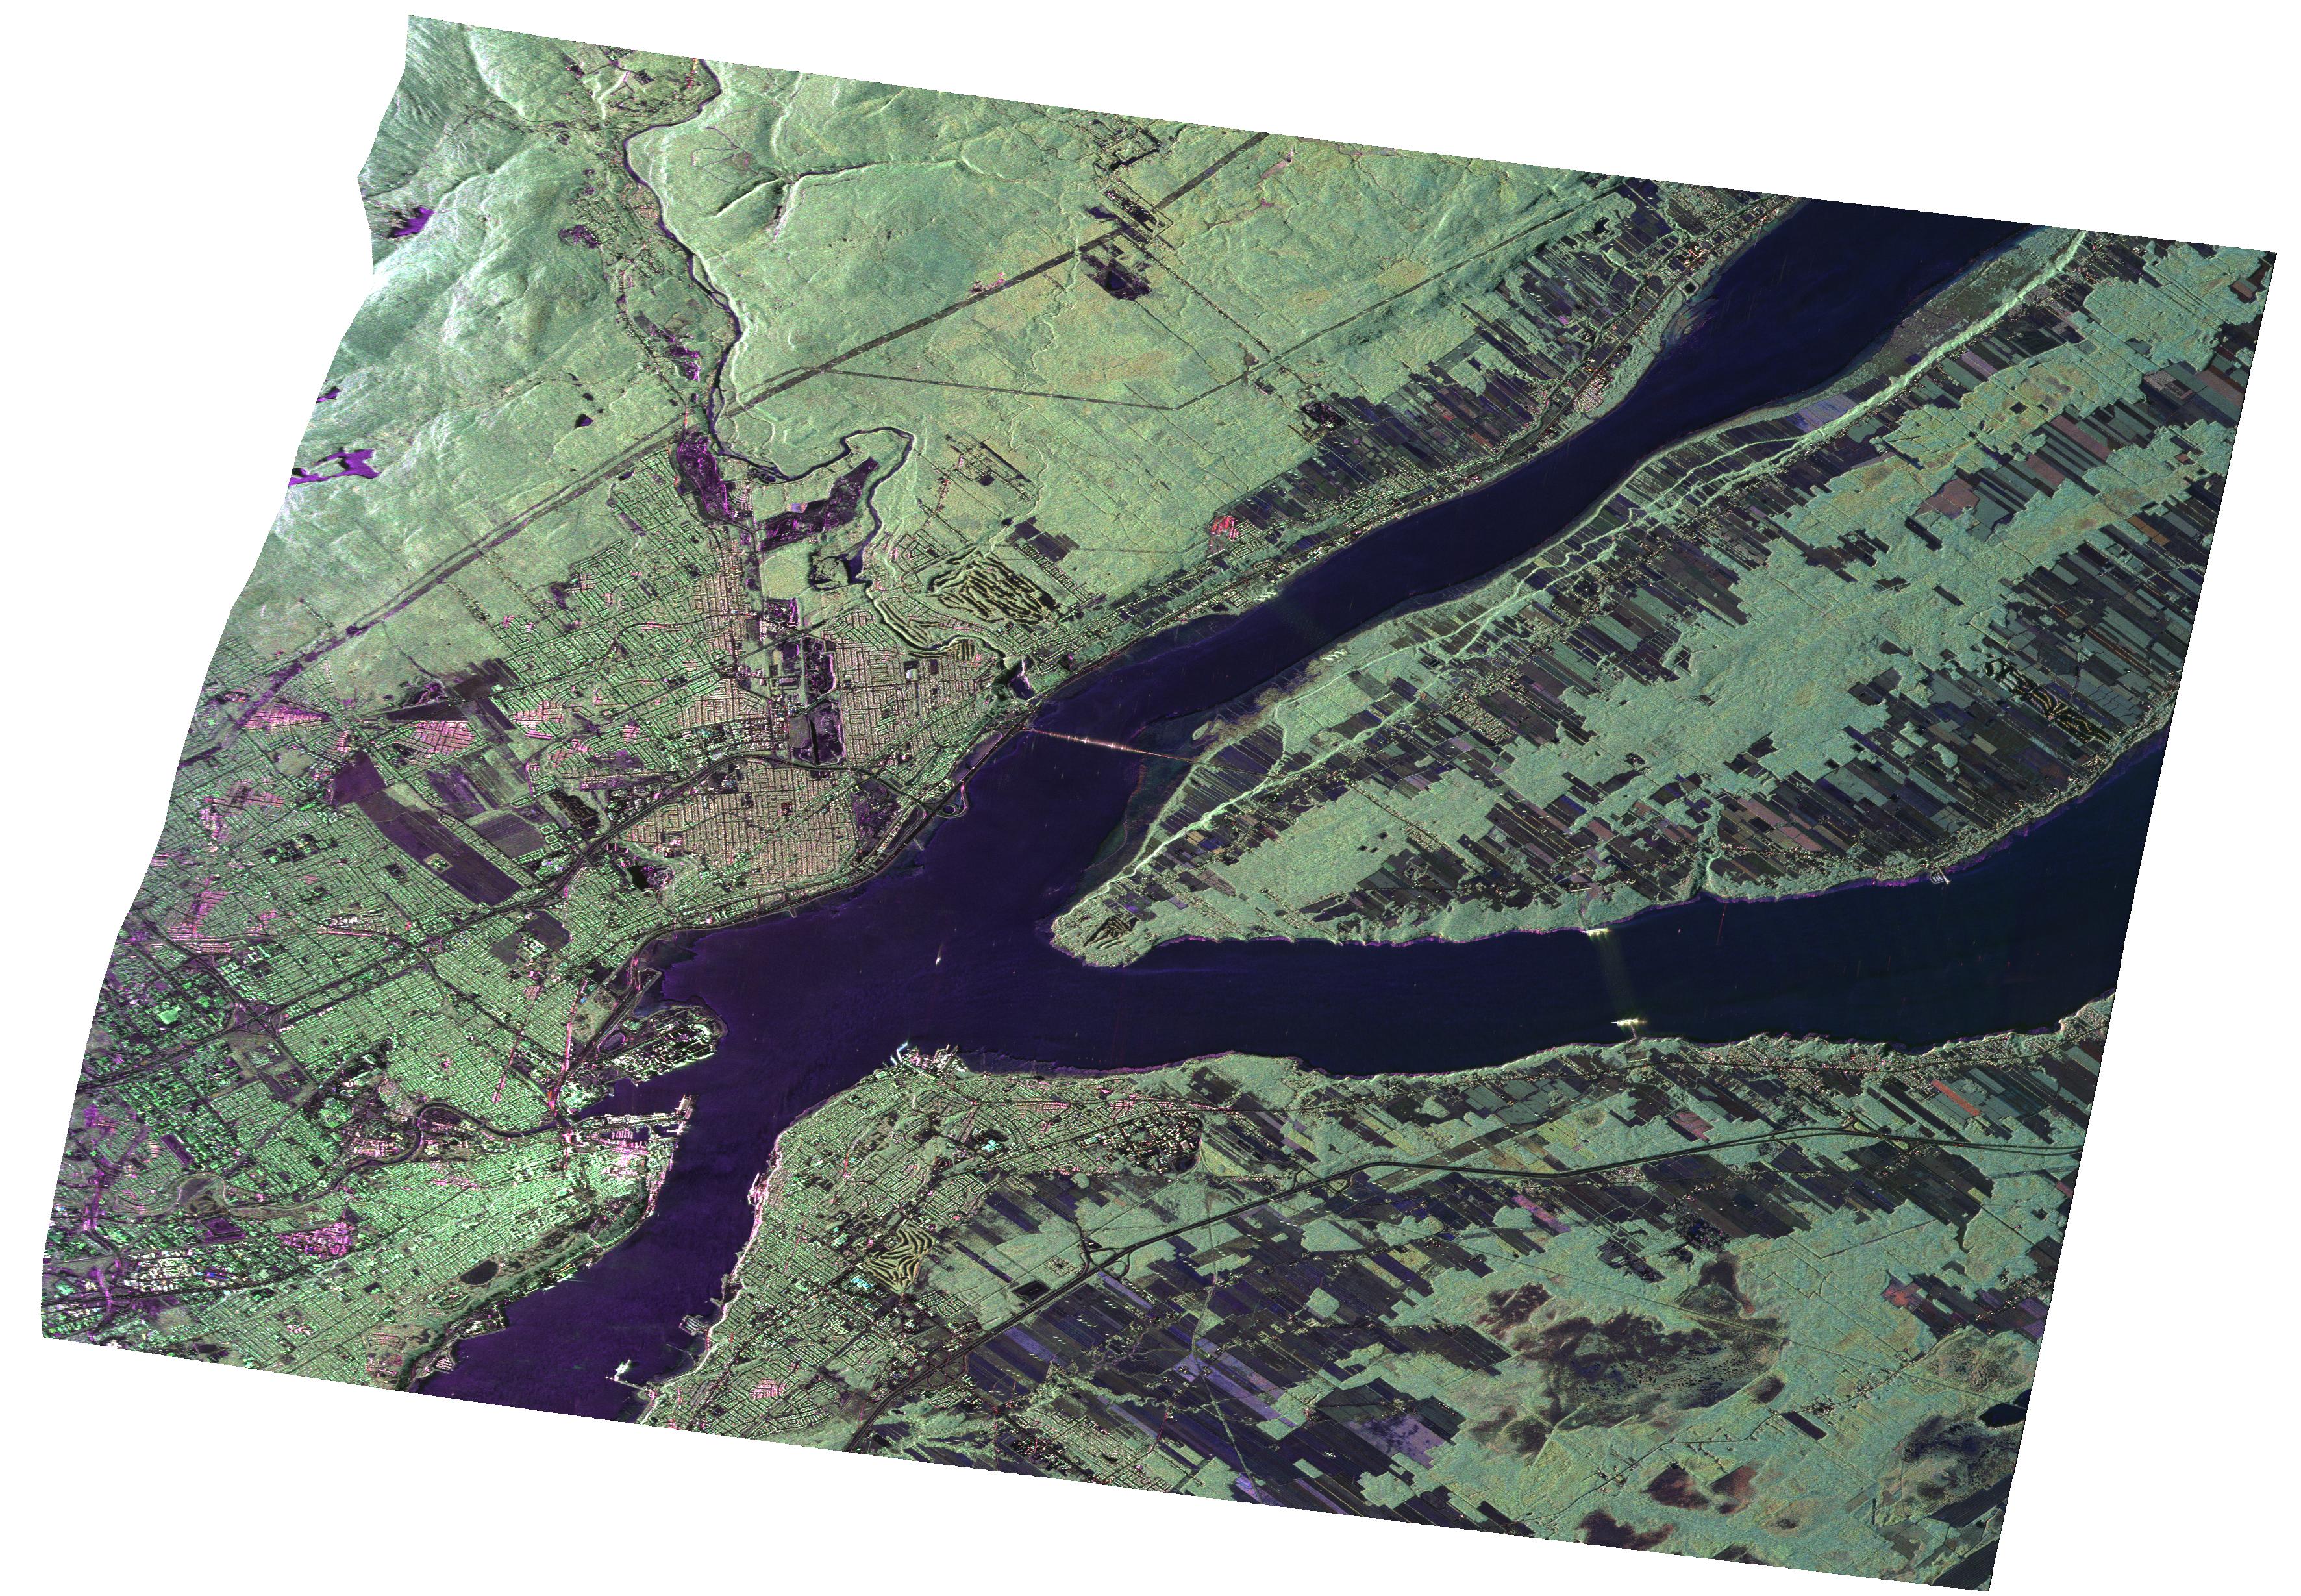
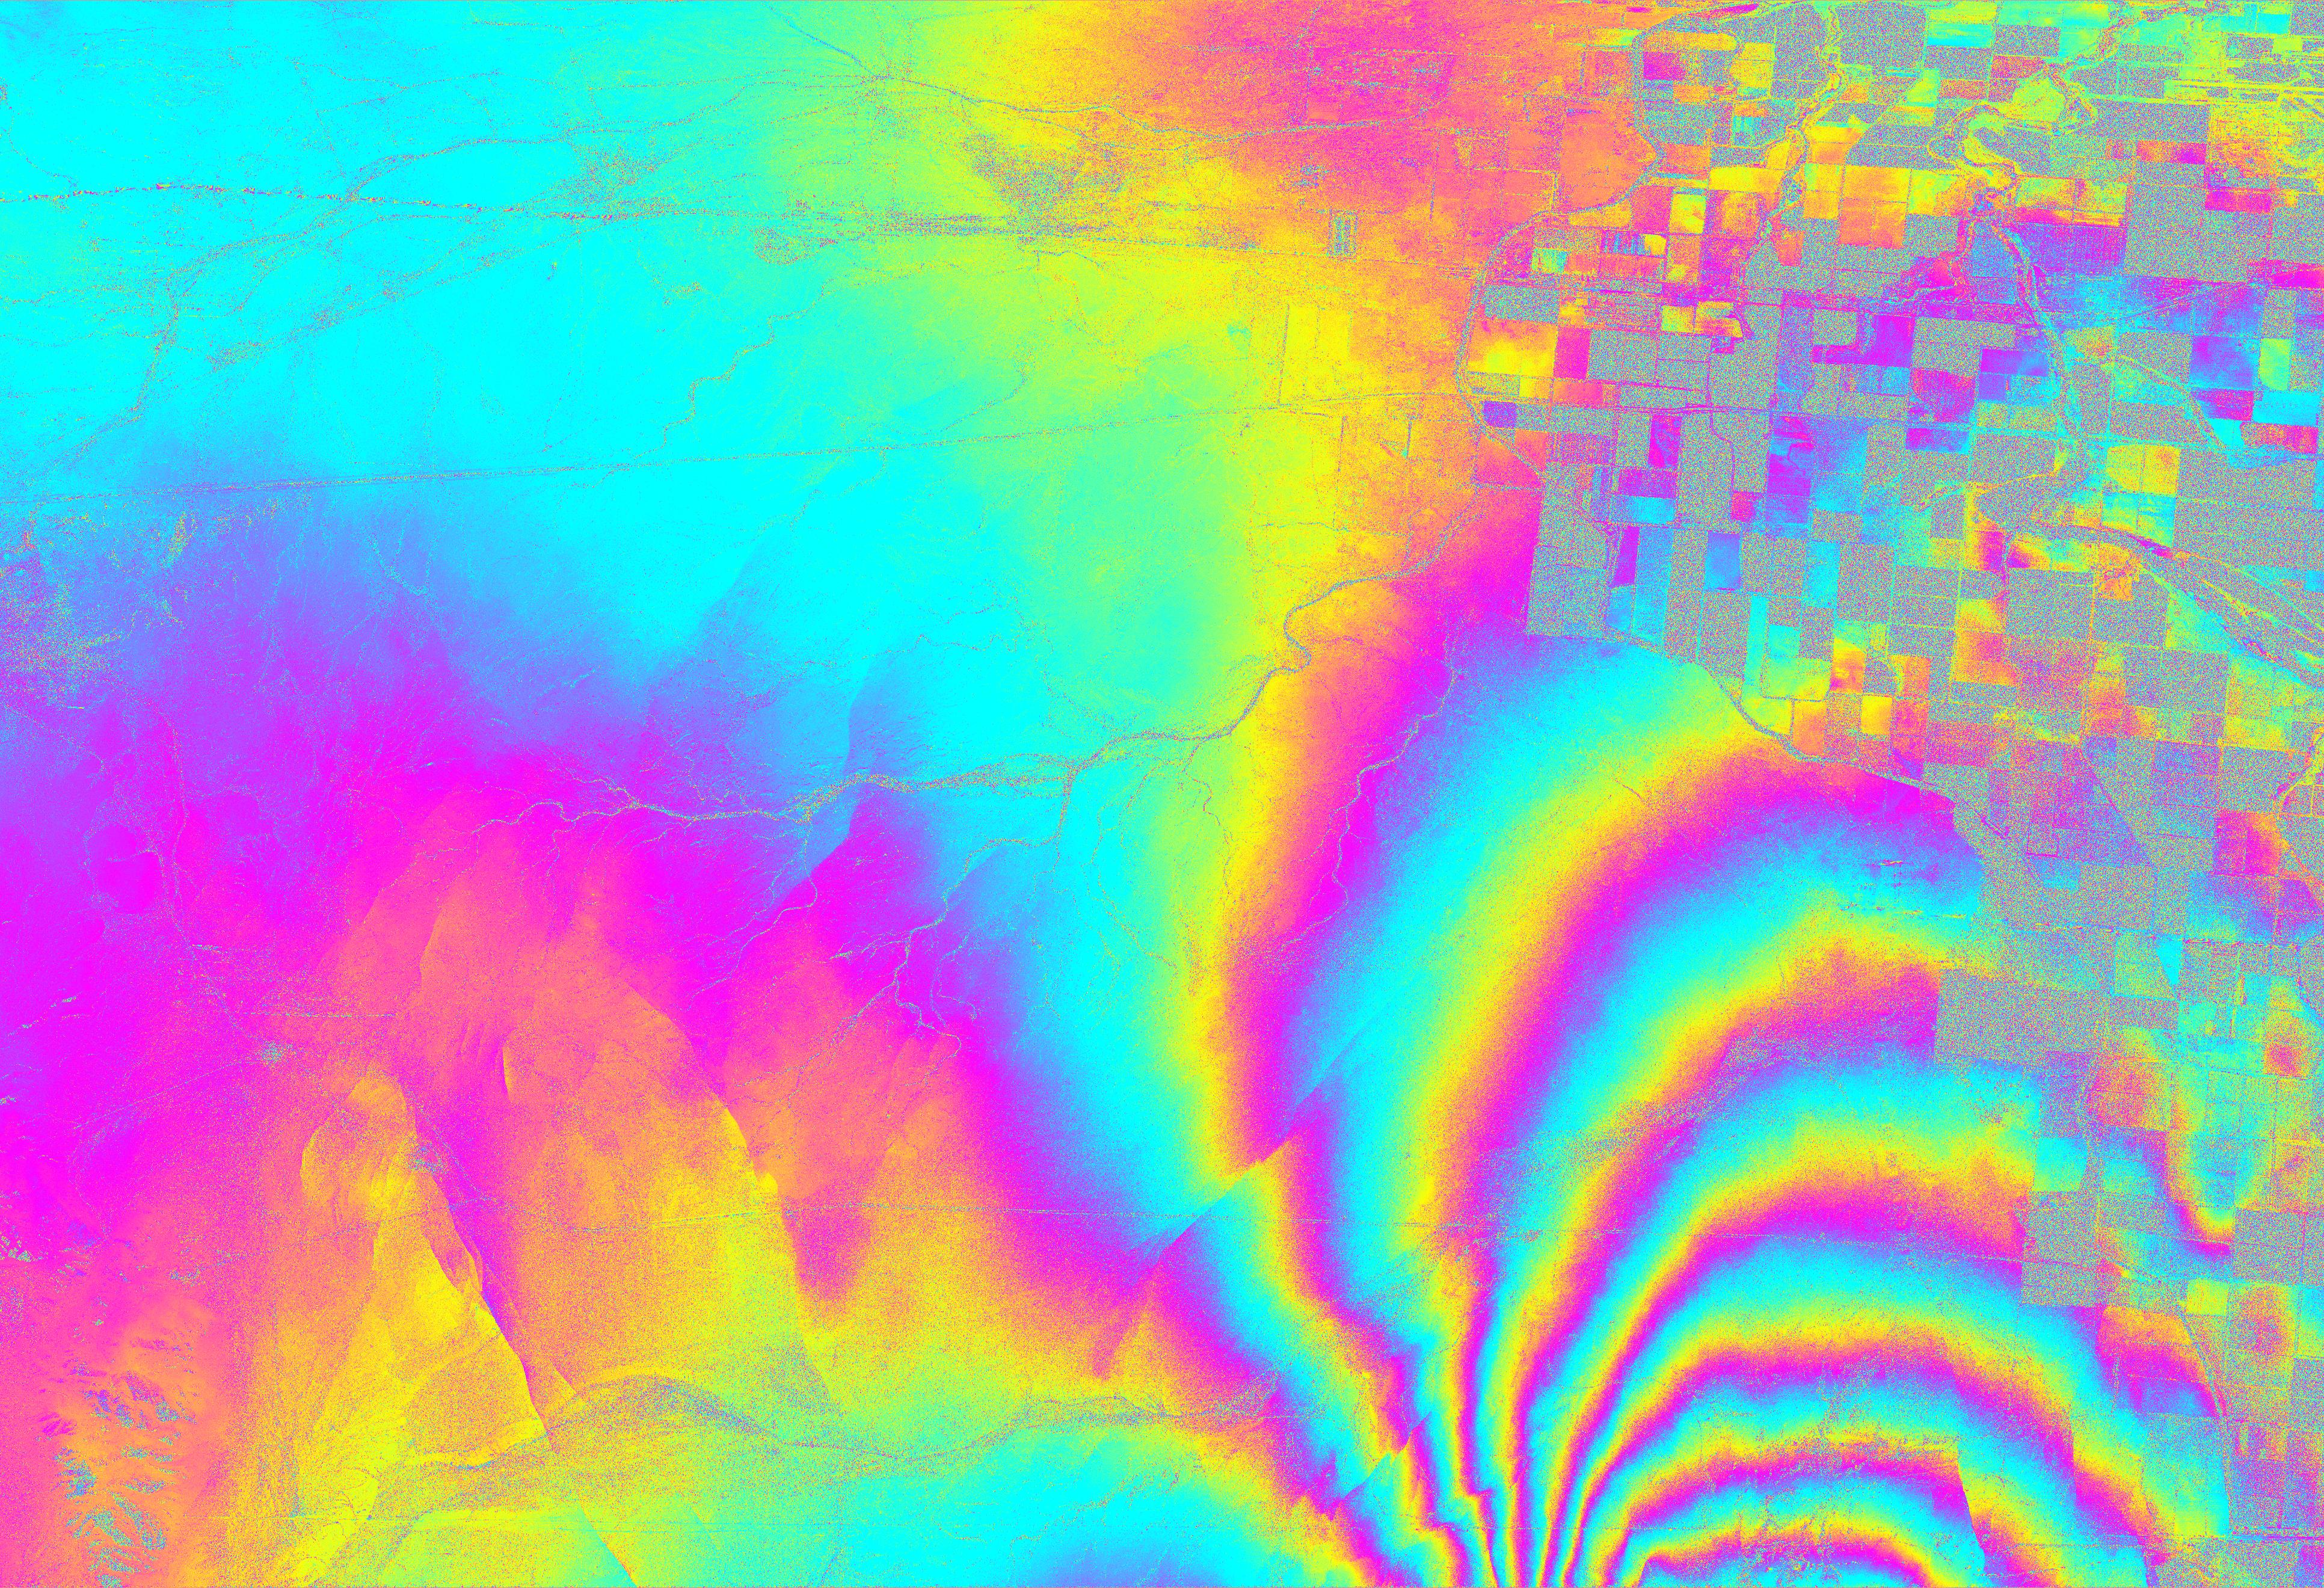
2010-02-02 | Earth |
UAVSAR |
L-Band UAVSAR |
6662x5139x3 |
|
|||||
|
|
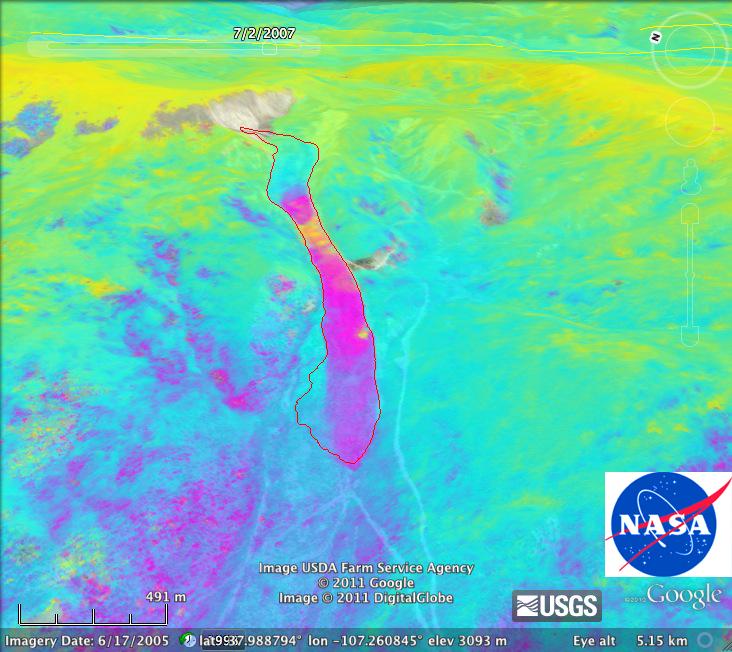
2009-09-01 | Earth |
UAVSAR |
L-Band UAVSAR |
3544x2458x3 |
|
|||||
|
|
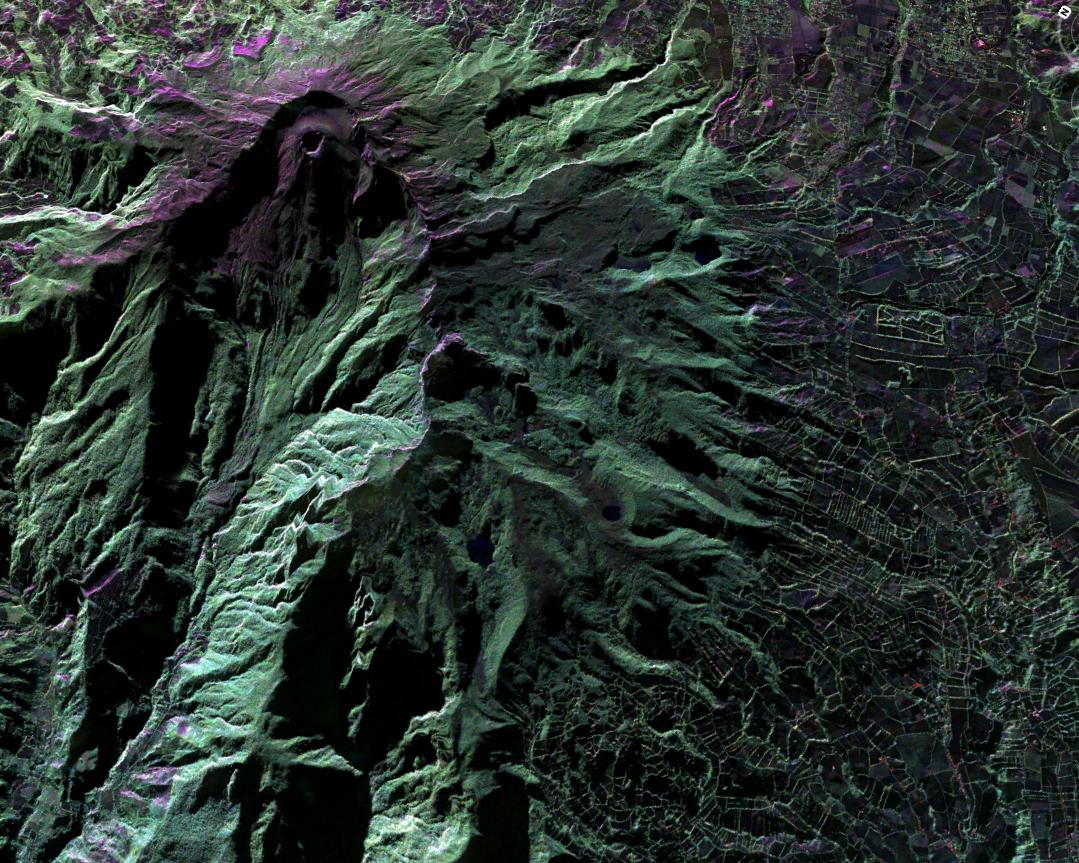
2010-07-01 | Earth |
UAVSAR |
L-Band UAVSAR |
1280x720x3 |
|
|||||
|
|
2010-08-04 | Earth |
UAVSAR |
L-Band UAVSAR |
2256x1464x3 |

|
|||||
|
|
2010-06-23 | Earth |
UAVSAR |
L-Band UAVSAR |
3864x2640x3 |
|
|||||
|
|
2011-03-04 | Earth |
UAVSAR |
L-Band UAVSAR |
20528x6304x3 |
|
|||||
|
|
2012-08-15 | Earth |
UAVSAR |
L-Band UAVSAR |
732x652x3 |
|
|||||
|
|
2013-04-03 | Earth |
UAVSAR |
L-Band UAVSAR |
2806x1314x3 |
|
|||||
|
|
2013-04-03 | Earth |
UAVSAR |
L-Band UAVSAR |
1079x863x3 |
|
|||||
|
|
2014-03-06 | Earth |
UAVSAR |
L-Band UAVSAR |
1107x981x3 |
|
|||||
|
|
2014-03-31 | Earth |
UAVSAR |
L-Band UAVSAR |
1400x950x3 |
|
|||||
|
|
2014-05-27 | Earth |
UAVSAR |
L-Band UAVSAR |
3238x3244x3 |

|
|||||
|
|
2014-09-04 | Earth |
UAVSAR |
L-Band UAVSAR |
1573x1181x3 |
|
|||||
|
|
2016-01-27 | Earth |
UAVSAR |
L-Band UAVSAR |
1800x2721x1 |
|
|||||
|
|
2016-02-05 | Earth |
UAVSAR |
L-Band UAVSAR |
1041x1043x1 |
|
|||||
|
|
2016-02-05 | Earth |
UAVSAR |
L-Band UAVSAR |
1800x882x1 |
|
|||||
|
|
2016-02-05 | Earth |
UAVSAR |
L-Band UAVSAR |
1800x2344x1 |
|
|||||
|
|
2018-02-12 | Earth |
UAVSAR |
L-Band UAVSAR |
1738x1853x3 |
|
|||||
|
|
1996-10-23 | Earth |
Spaceborne Imaging Radar-C/X-Band Synthetic Aperture Radar |
L-Band Imaging Radar |
1427x976x1 |
|
|||||
|
|
1998-04-06 | Earth |
Spaceborne Imaging Radar-C/X-Band Synthetic Aperture Radar |
L-Band Imaging Radar |
2100x1232x3 |
|
|||||
|
|
1998-03-16 | Earth |
Spaceborne Imaging Radar-C/X-Band Synthetic Aperture Radar |
L-Band Imaging Radar |
2282x2375x3 |
|
|||||
|
|
1998-03-16 | Earth |
Spaceborne Imaging Radar-C/X-Band Synthetic Aperture Radar |
L-Band Imaging Radar |
1571x1135x3 |
|
|||||
|
|
1998-04-06 | Earth |
Spaceborne Imaging Radar-C/X-Band Synthetic Aperture Radar |
L-Band Imaging Radar |
4001x3032x3 |
|
|||||
|
|
1999-09-27 | Earth |
Spaceborne Imaging Radar-C/X-Band Synthetic Aperture Radar |
L-Band Imaging Radar |
1200x2501x3 |
|
|
|||||
|
|
2023-03-24 | Earth |
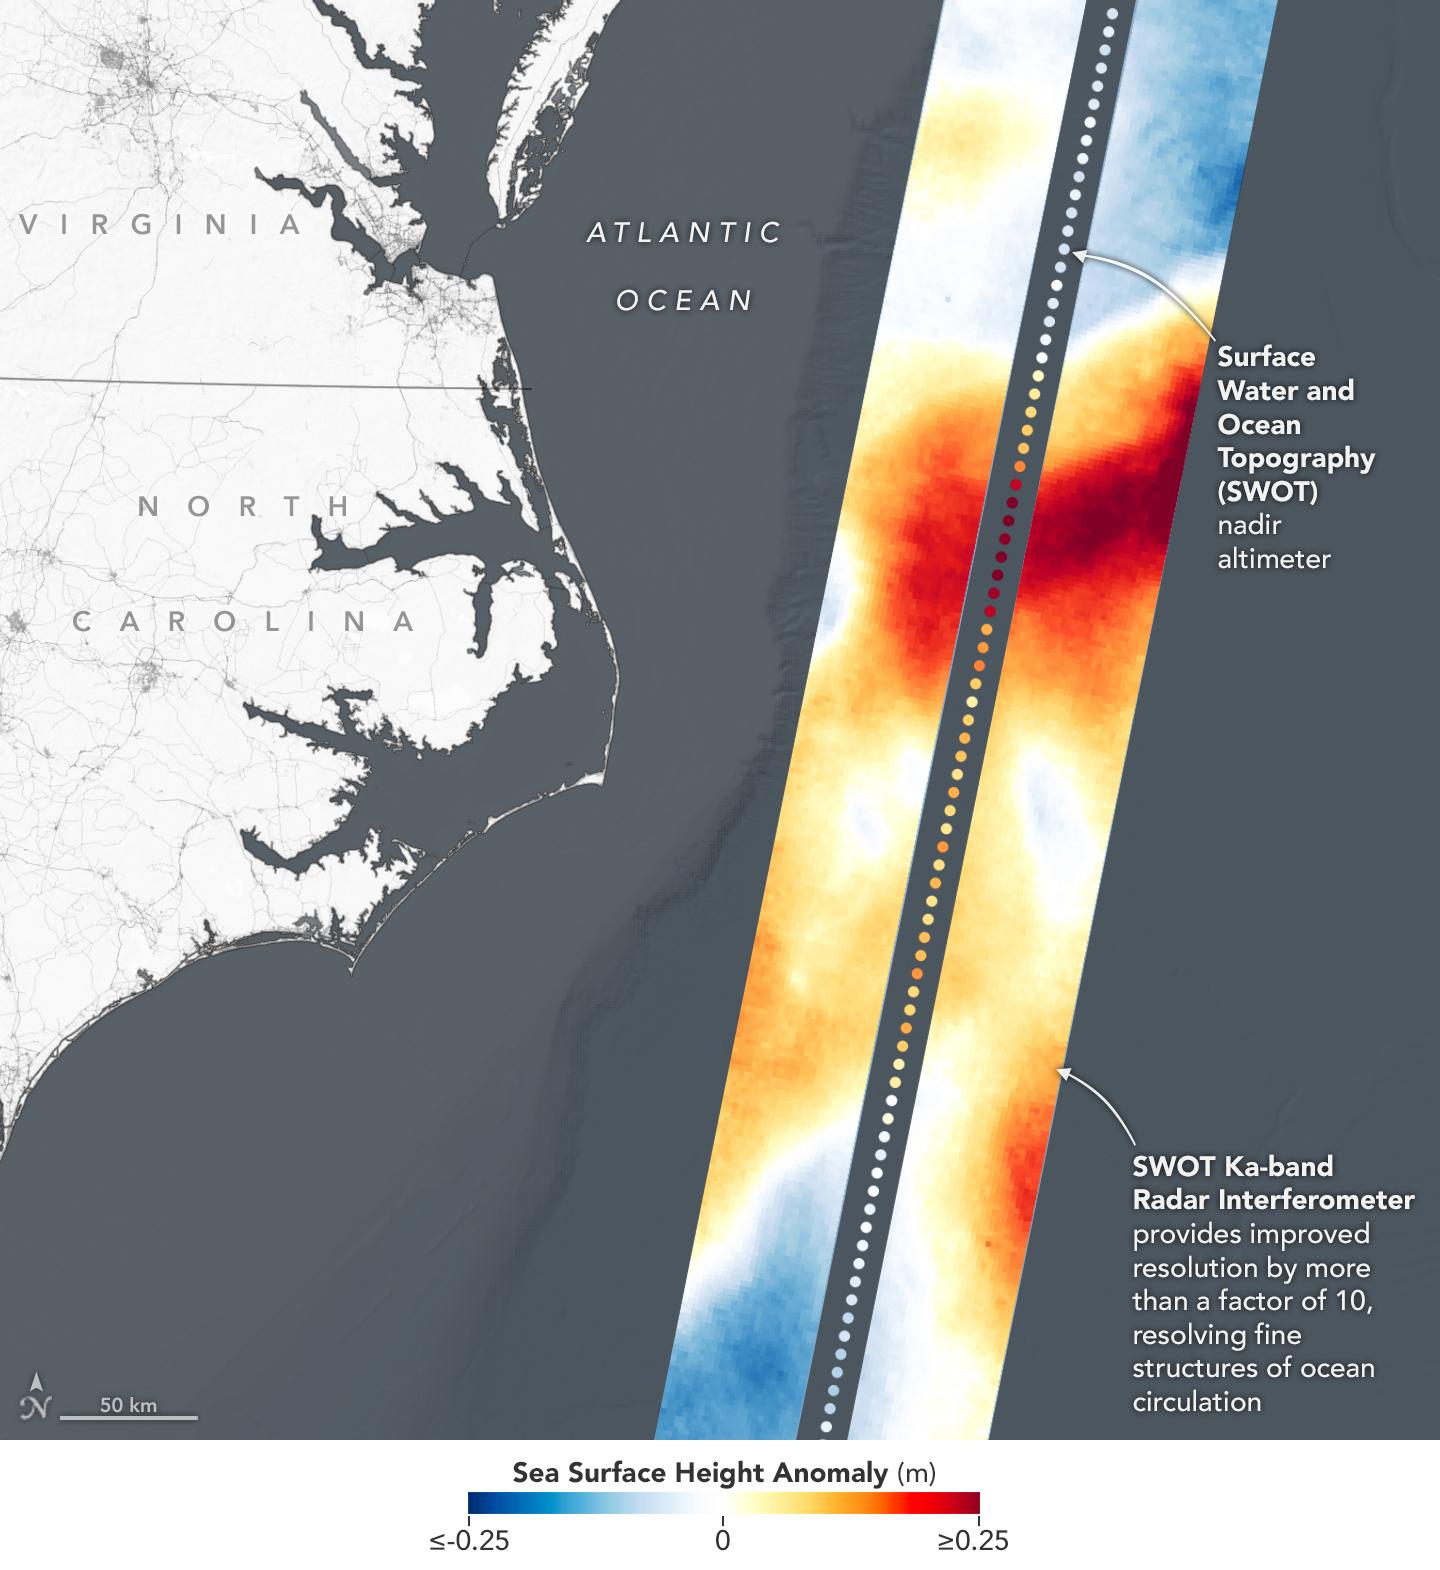
Surface Water and Ocean Topography (SWOT) |
KaRIn |
1440x1570x3 |
|
|||||
|
|
2023-03-24 | Earth |
Surface Water and Ocean Topography (SWOT) |
KaRIn |
787x879x3 |
|
|||||
|
|
2023-08-30 | Earth |
Surface Water and Ocean Topography (SWOT) |
KaRIn |
2794x1934x3 |
|
|||||
|
|
2023-09-19 | Earth |
SWOT |
KaRIn |
1570x1870x3 |
|
|||||
|
|
2023-10-30 | Earth |
SWOT |
KaRIn |
1920x1080x3 |

|
|||||
|
|
2023-11-08 | Earth |
SWOT |
KaRIn |
1264x1029x3 |
|
|||||
|
|
2024-03-05 | Earth |
SWOT |
KaRIn |
1440x1090x3 |
|
|||||
|
|
2024-04-15 | Earth |
SWOT |
KaRIn |
1440x1090x3 |
|
|||||
|
|
2024-05-07 | Earth |
SWOT |
KaRIn |
4000x2250x3 |
|
|||||
|
|
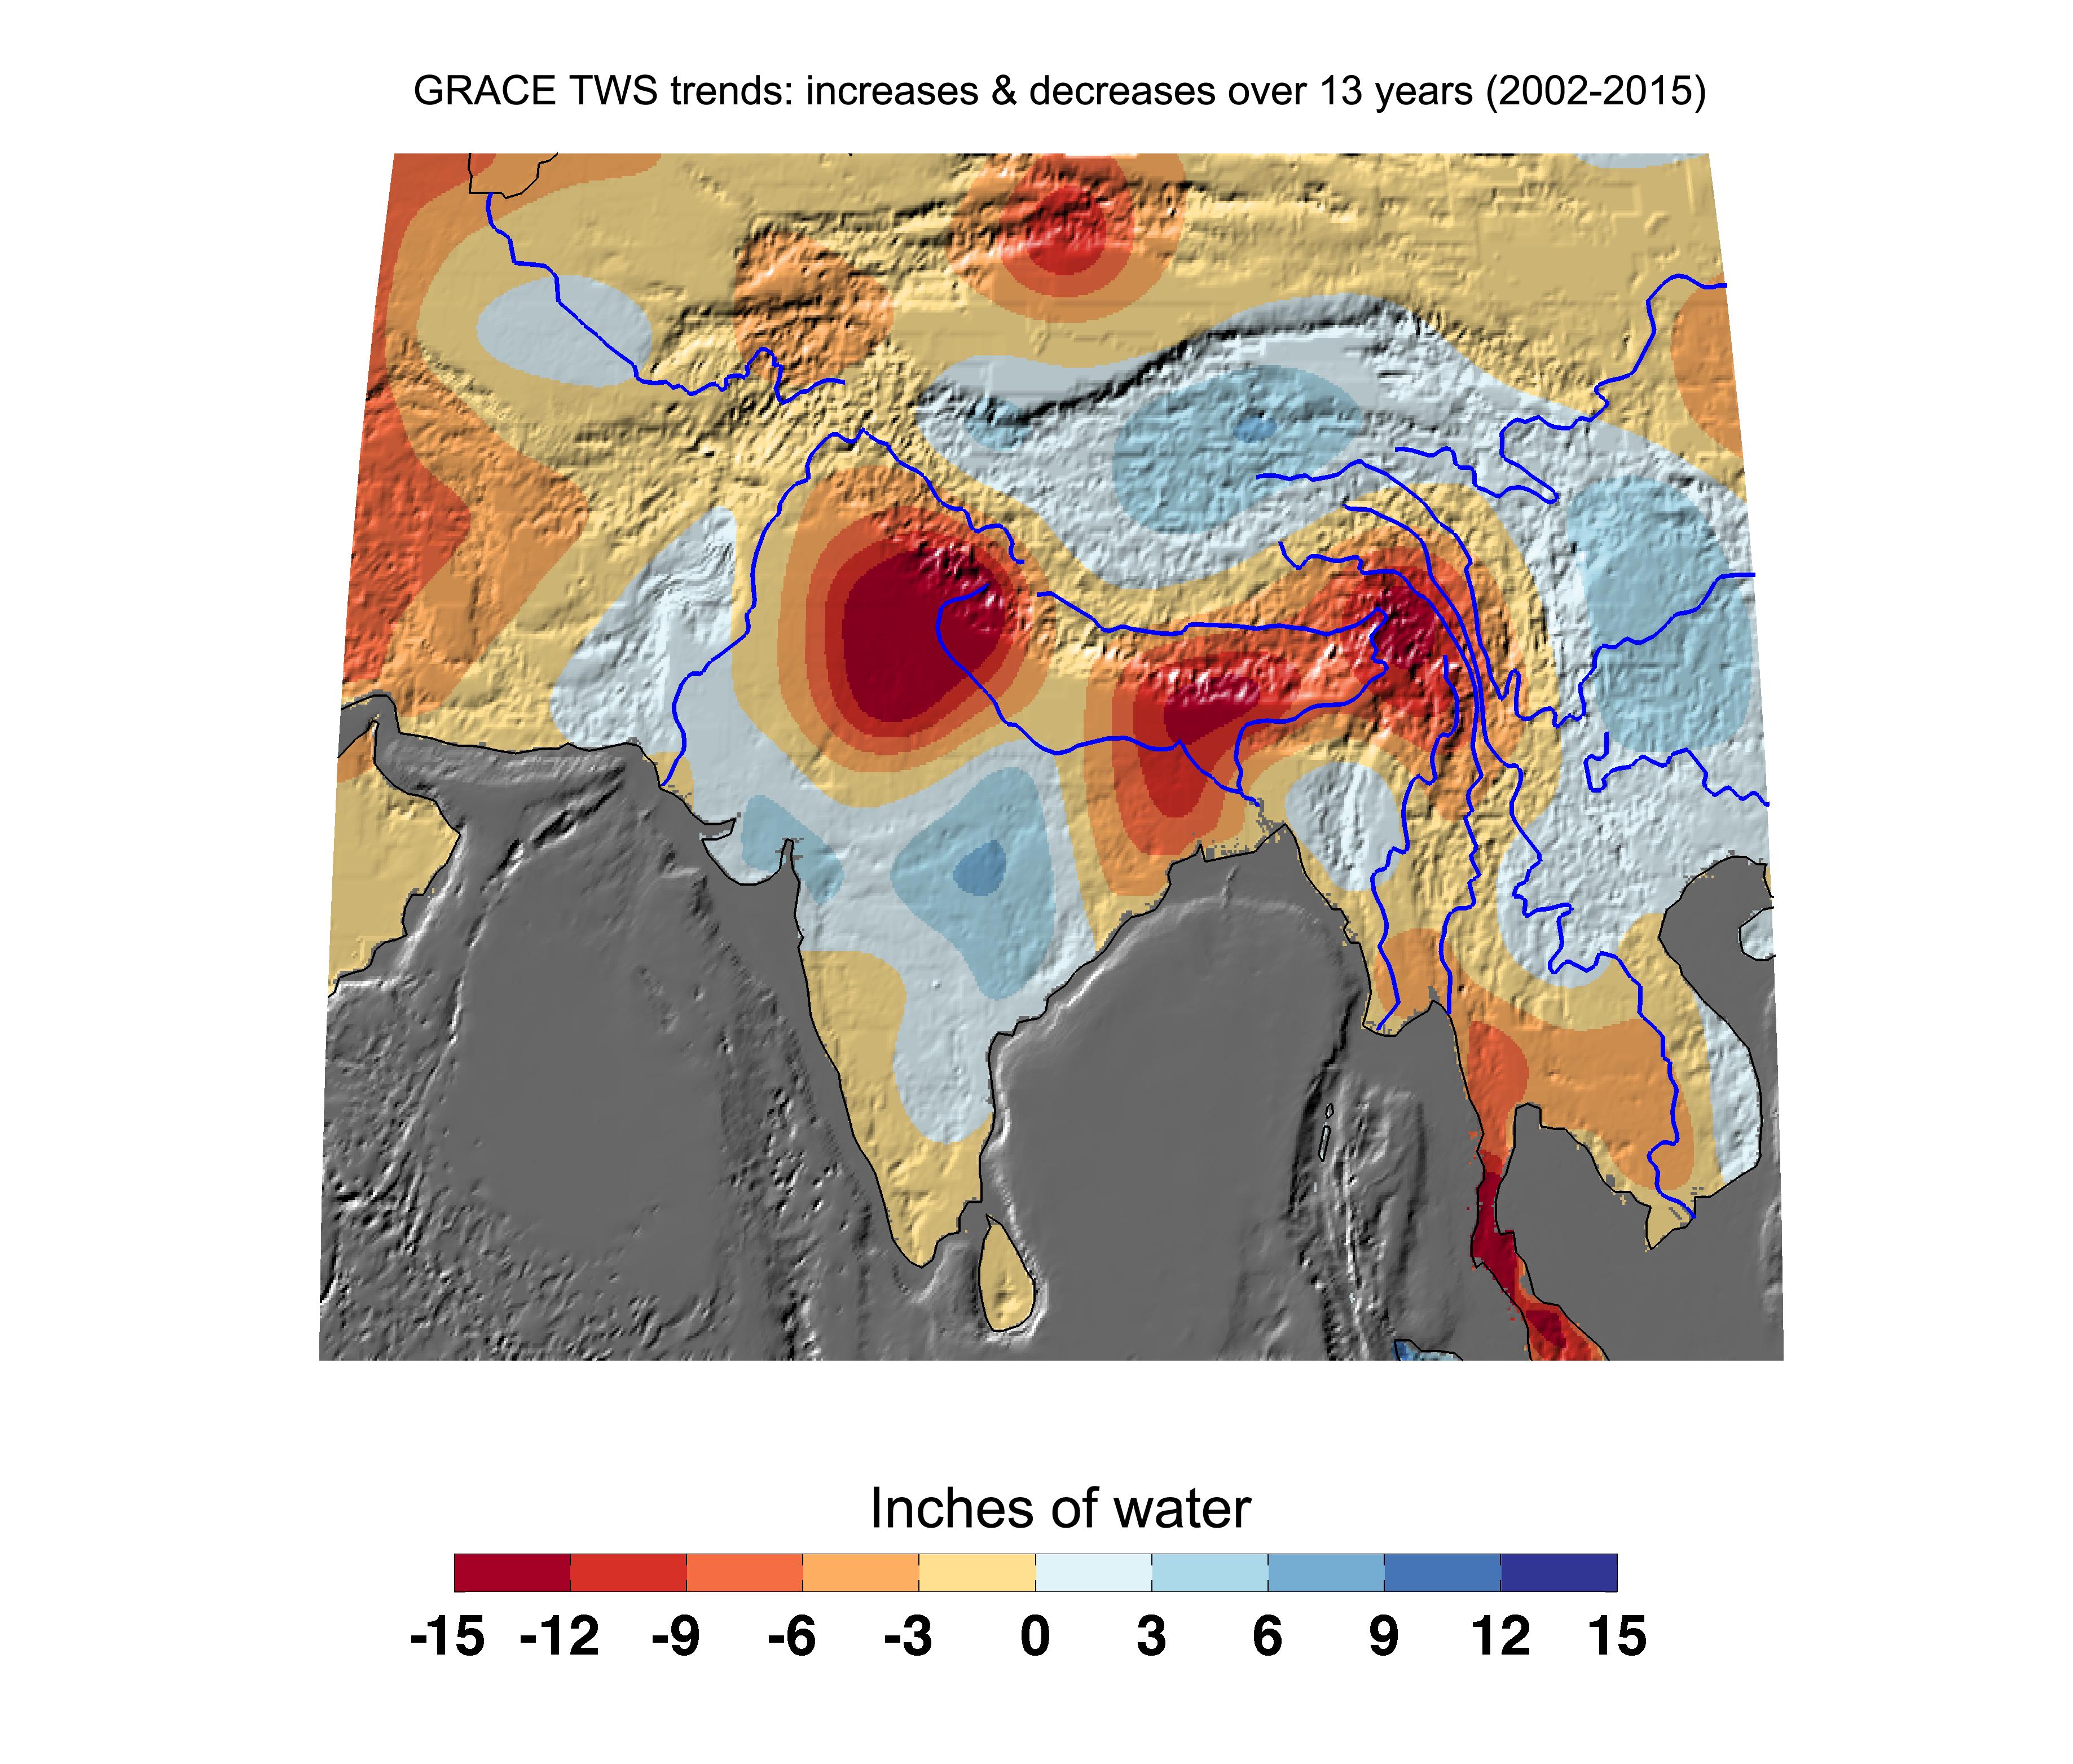
2003-07-21 | Earth |
GRACE |
K-Band Ranging System |
2037x1645x3 |
|
|||||
|
|
2010-02-19 | Earth |
GRACE |
K-Band Ranging System |
1279x720x3 |
|
|||||
|
|
2005-12-06 | Earth |
GRACE |
K-Band Ranging System |
1302x1326x3 |
|
|||||
|
|
2007-12-11 | Earth |
GRACE |
K-Band Ranging System |
1200x1200x3 |
|
|||||
|
|
2009-07-15 | Earth |
GRACE |
K-Band Ranging System |
1200x1200x3 |
|
|||||
|
|
2009-07-15 | Earth |
GRACE |
K-Band Ranging System |
1200x1200x3 |
|
|||||
|
|
2009-07-17 | Earth |
GRACE |
K-Band Ranging System |
455x455x3 |
|
|||||
|
|
2009-08-27 | Earth |
GRACE |
K-Band Ranging System |
778x778x3 |

|
|||||
|
|
2010-07-07 | Earth |
GRACE |
K-Band Ranging System |
777x745x3 |

|
|||||
|
|
2012-02-02 | Earth |
GRACE |
K-Band Ranging System |
1058x720x3 |
|
|||||
|
|
2013-06-13 | Earth |
GRACE |
K-Band Ranging System |
2168x2430x3 |
|
|||||
|
|
2013-10-26 | Earth |
GRACE |
K-Band Ranging System |
1297x708x3 |
|
|||||
|
|
2014-10-01 | Earth |
GRACE |
K-Band Ranging System |
1280x755x3 |

|
|||||
|
|
2015-12-08 | Earth |
GRACE |
K-Band Ranging System |
3335x3332x3 |
|
|||||
|
|
2015-12-08 | Earth |
GRACE |
K-Band Ranging System |
4900x2500x3 |
|
|||||
|
|
2015-12-08 | Earth |
GRACE |
K-Band Ranging System |
5198x2724x3 |
|
|||||
|
|
2015-12-08 | Earth |
GRACE |
K-Band Ranging System |
3675x3127x3 |
|
|||||
|
|
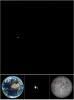
2013-10-21 | Earth |
Juno |
JunoCam |
1406x1420x1 |
|
|||||
|
|
2011-08-06 | Earth |
Juno |
JunoCam |
640x480x1 |
|
|||||
|
|
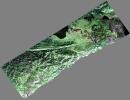
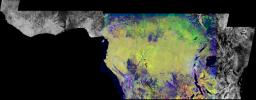
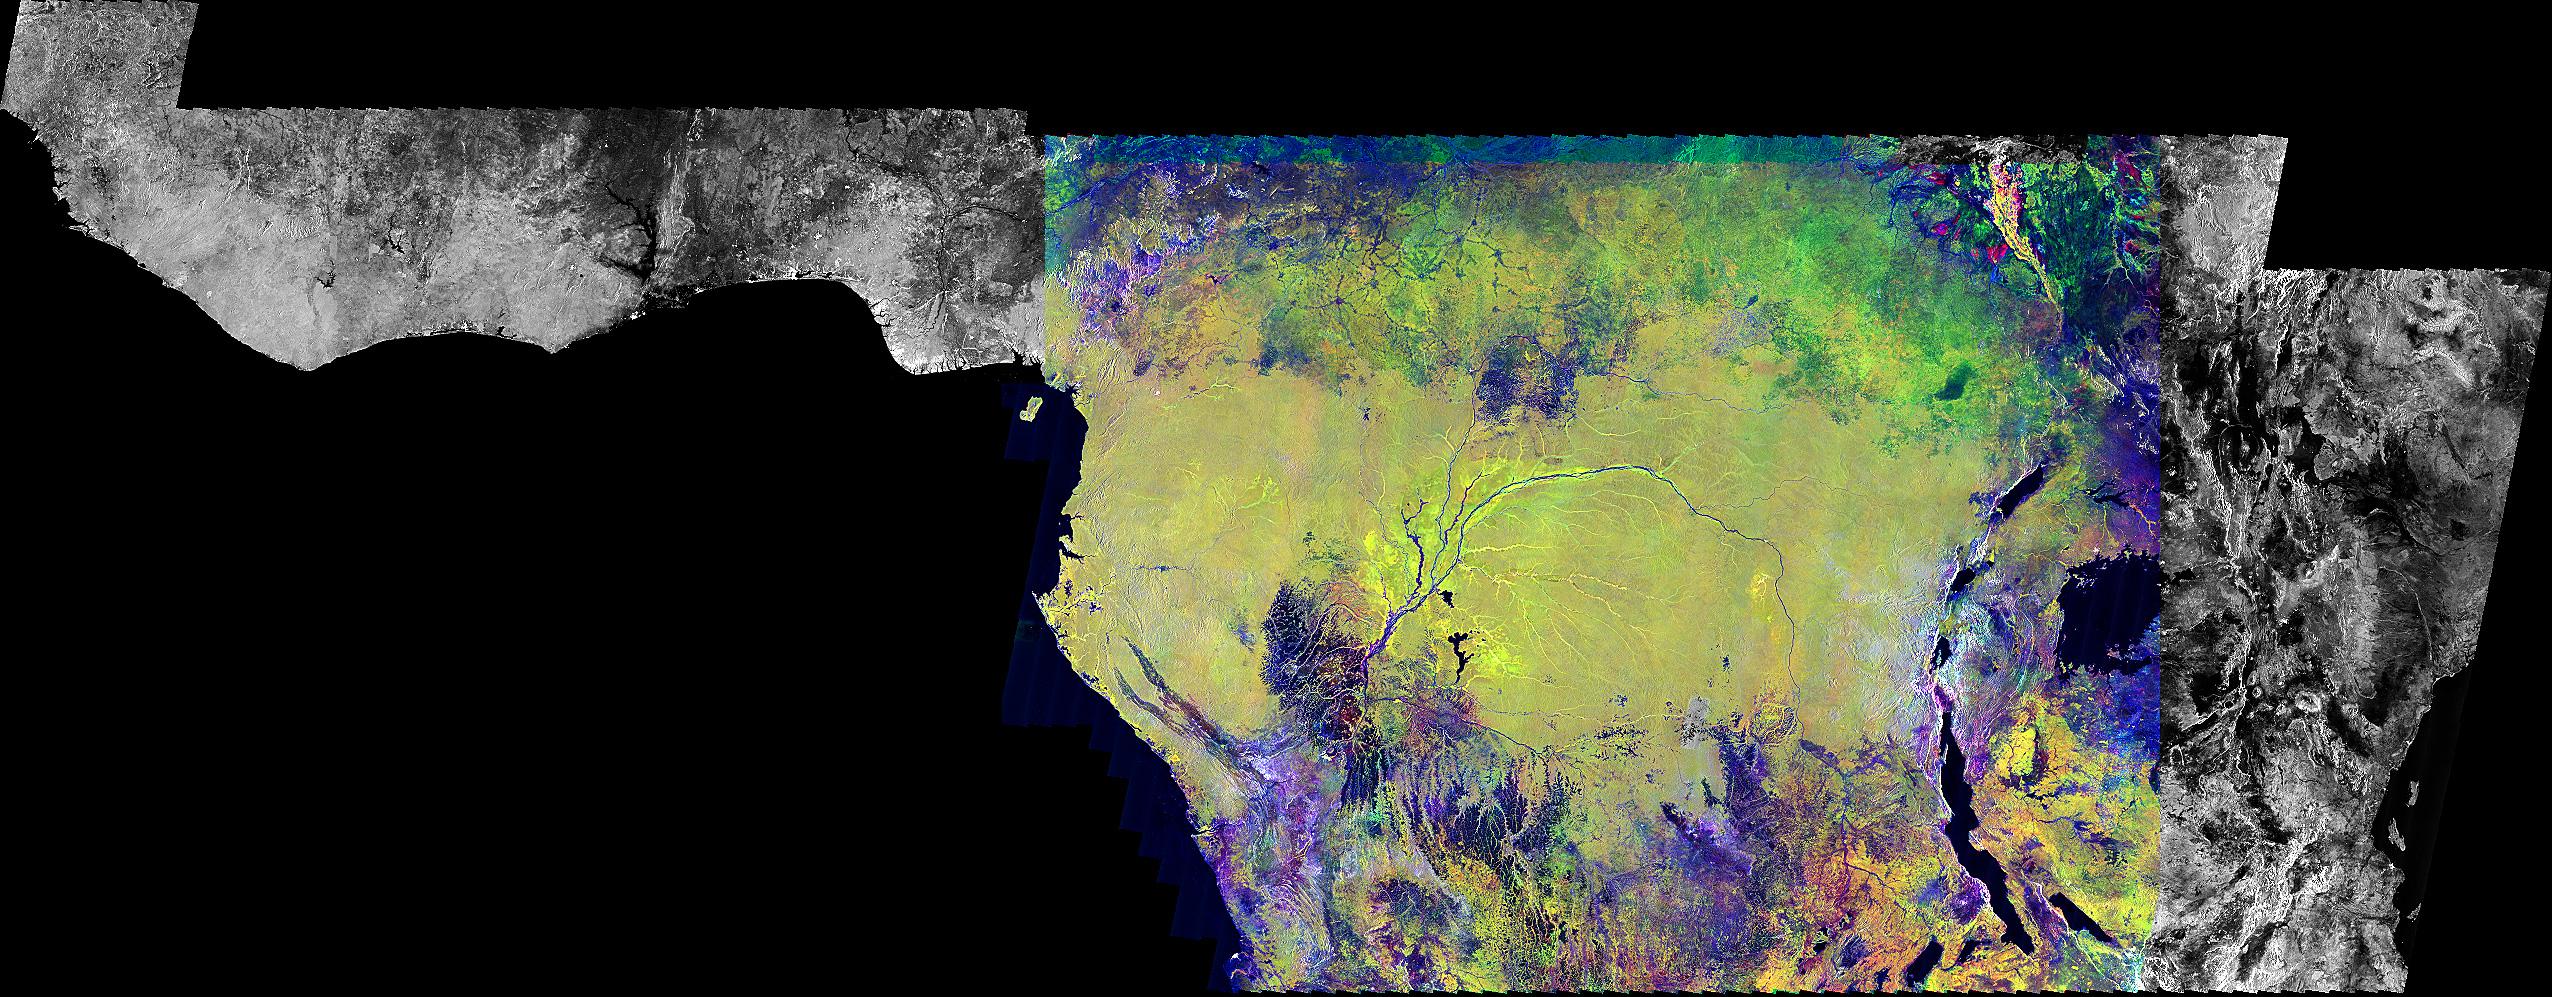
1999-09-23 | Earth |
Global Rain Forest Mapping Project (GRFM) |
JERS-1 SAR |
2552x997x3 |
|
|||||
|
|
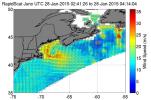
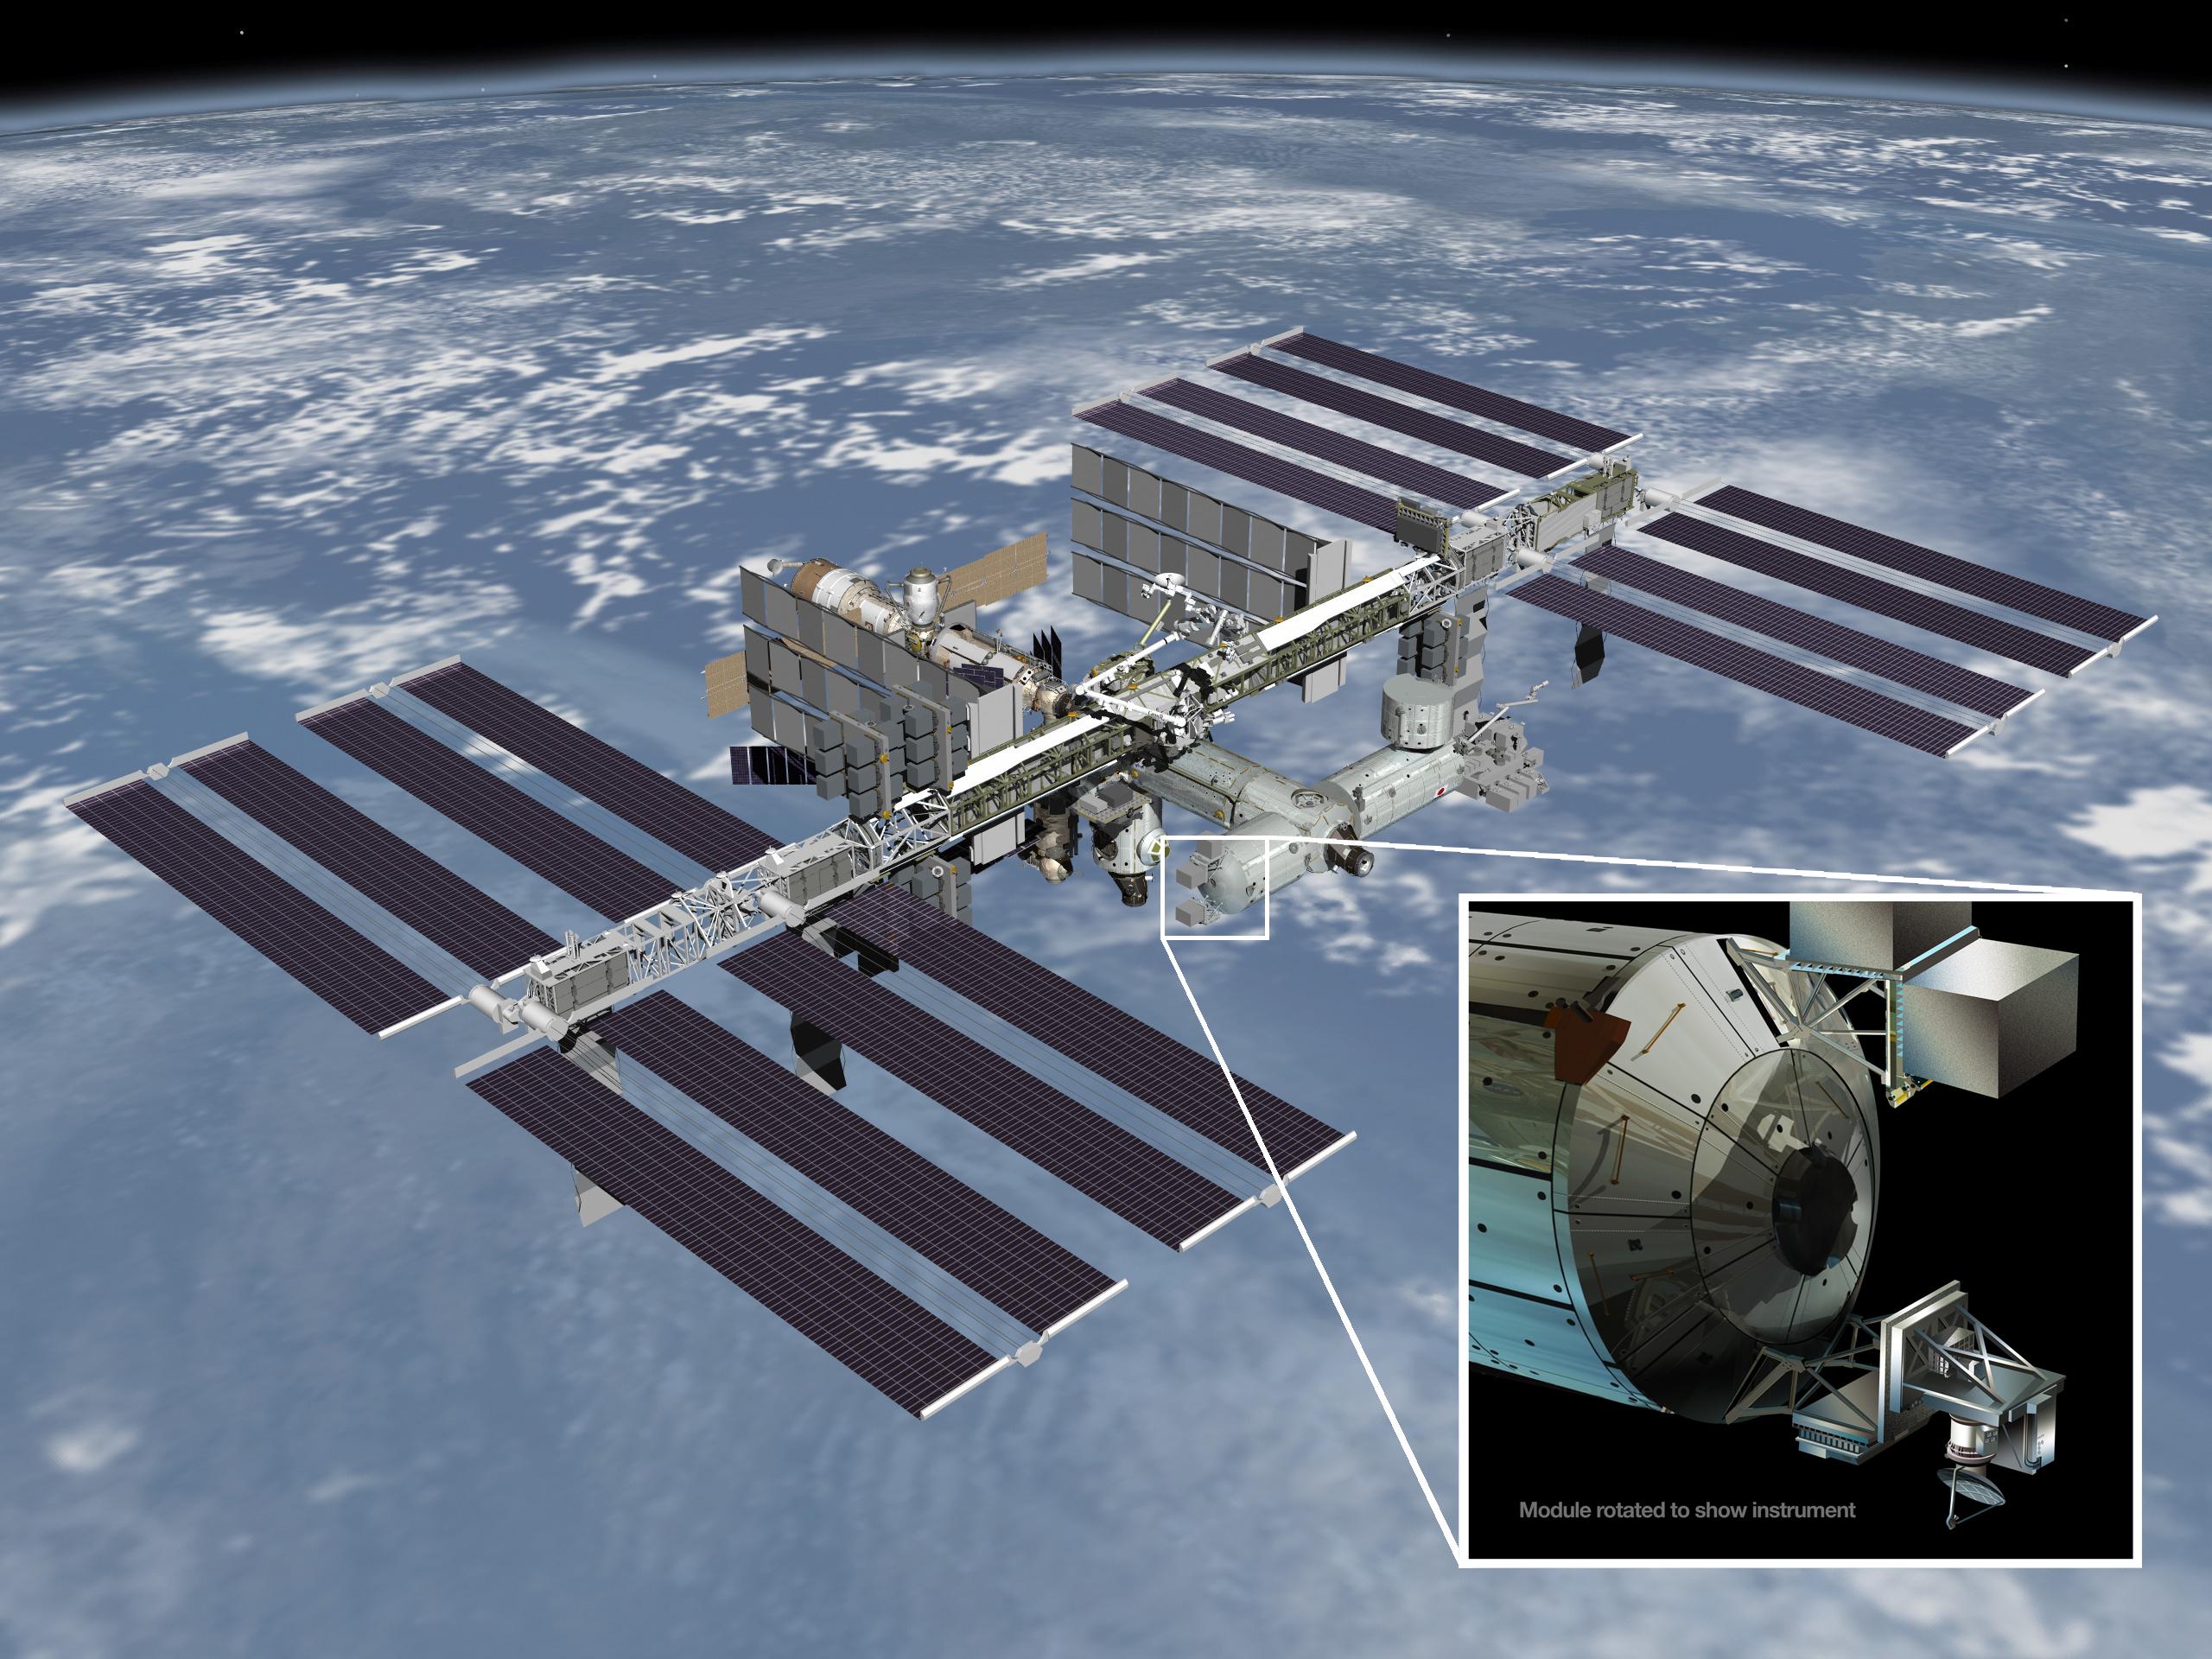
2014-01-22 | Earth |
RapidScat |
ISS-RapidScat |
2560x1920x3 |

|
|||||
|
|
2014-10-06 | Earth |
RapidScat |
ISS-RapidScat |
1200x609x3 |
|
|||||
|
|
2014-10-21 | Earth |
RapidScat |
ISS-RapidScat |
895x718x3 |
|
|||||
|
|
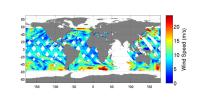
2015-04-21 | Earth |
RapidScat |
ISS-RapidScat |
1064x706x3 |
|
|||||
|
|
2015-10-23 | Earth |
RapidScat |
ISS-RapidScat |
584x593x3 |
|
|||||
|
|
2015-11-06 | Earth |
RapidScat |
ISS-RapidScat |
2816x2134x3 |
|
|||||
|
|
2016-01-21 | Earth |
RapidScat |
ISS-RapidScat |
1532x696x3 |
|
|||||
|
|
2016-01-25 | Earth |
RapidScat |
ISS-RapidScat |
751x479x3 |
|
|||||
|
|
2016-01-28 | Earth |
RapidScat |
ISS-RapidScat |
682x593x3 |
|
|||||
|
|
2005-10-13 | Earth |
Landsat |
Interferometric Synthetic Aperture Radar |
1793x1706x3 |

|
|||||
|
|
2023-09-27 | Earth |
InSAR |
2036x1446x3 | |
|
|||||
|
|
2023-09-27 | Earth |
InSAR |
1584x934x3 | |
|
|||||

|
 |
|
|
|
|
 |
 |
|
|
|

|
| 1-100 | 101-200 | 201-300 | 301-400 | 401-500 | 501-600 | 601-700 | 701-800 | 801-900 | 901-1000 |
| Currently displaying images: 501 - 600 of 2270 |