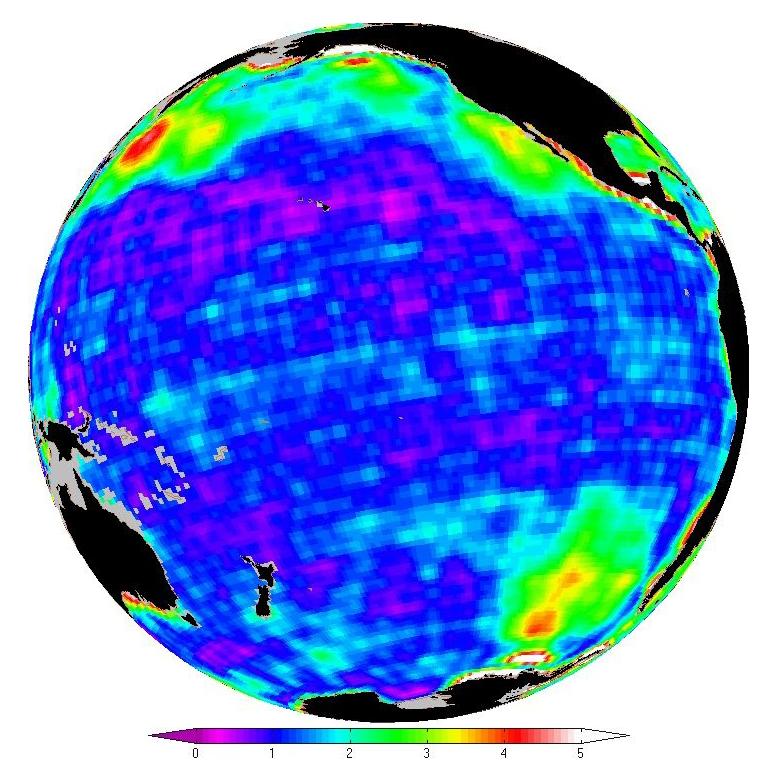
This map shows changes in ocean bottom pressure measured by NASA's Gravity Recovery and Climate Experiment (GRACE).
Just as knowing atmospheric pressure allows meteorologists to predict winds and weather patterns, measurements of ocean bottom pressure provide oceanographers with fundamental information about currents and global circulation. They also hold clues to questions about sea level and climate.
Red shows where pressure varies by large amounts, blue where it changes very little. The quantity is called the standard deviation, and the color bar depicts it in units of centimeters of equivalent water height. The standard deviation is a mathematical concept such that approximately two thirds of the values at each pixel have a smaller magnitude. These values were computed over the time period January 2003 to December 2008.
The pressure at the bottom of the ocean is determined by the amount of mass above it. Launched in 2002, the twin Grace satellites map Earth's gravity field from orbit 500 kilometers (310 miles) above the surface. They respond to how mass is distributed in the Earth and on Earth's surface -- the greater the mass in a given area, the stronger the pull of gravity from that area.
To create this map, scientists at NASA's Jet Propulsion Laboratory (JPL) processed GRACE data using a new "mascon" (for mass concentration) solution developed at the laboratory to reveal the small horizontal scale changes in gravity needed to determine ocean bottom pressure.
GRACE is a collaborative endeavor involving the Center for Space Research at the University of Texas, Austin; NASA's Jet Propulsion Laboratory, Pasadena, Calif.; the German Space Agency and the German Research Center for Geosciences, Potsdam.
More information on the GRACE mission is online at http://www.csr.utexas.edu/grace/ and http://grace.jpl.nasa.gov/.
