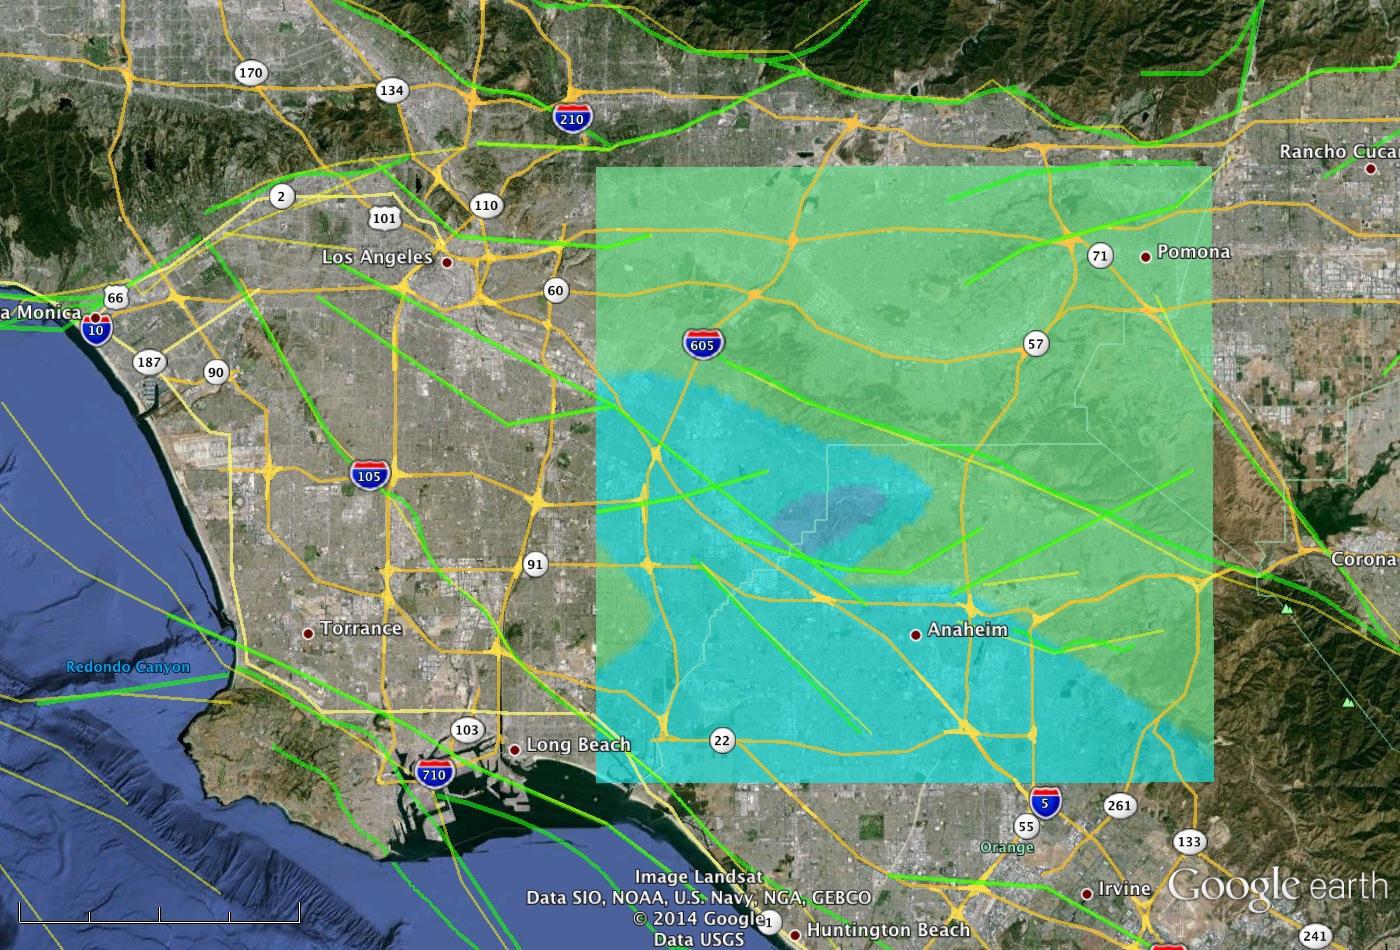
Scientists at NASA's Jet Propulsion Laboratory, Pasadena, Calif., developed a model of the March 28, 2014, magnitude 5.1 La Habra, Calif. earthquake, based on the distribution of aftershocks and other seismic information from the U.S. Geological Survey. This image shows what the earthquake may look like to an interferometric synthetic aperture radar, such as NASA's Uninhabited Aerial Vehicle Synthetic Aperture Radar (UAVSAR).
The earthquake is believed to be associated with the Puente Hills Thrust fault, which zig-zags from Orange County northwest through downtown Los Angeles. The NASA model is based on a fault estimated to be 9 kilometers long, 5 kilometers deep and 3 kilometers wide. The modeled fault dips upward through the ground at a 60-degree angle, with one side of the fault moving at a slanted angle horizontally and vertically 10 centimeters relative to the other side. The model estimated the maximum displacement of Earth's surface from the quake at approximately 1 centimeter, which is at the threshold of what is detectable with UAVSAR. The region of ground displacement is indicated by the darker blue area located in the right center of the image.
In Nov. 2008, NASA JPL scientists began conducting a series of UAVSAR flights over regions of Northern and Southern California that are actively deforming and are marked by frequent earthquakes. About every six months, the scientists precisely repeat the same flight paths to produce images of ground deformation called interferograms. From these data, 3-D maps are being created for regions of interest, including the San Andreas and other California faults, extending from the Gulf of California in Mexico to Santa Rosa in the northern San Francisco Bay.
UAVSAR, which flies on a NASA C20-A III aircraft from NASA's Armstrong Flight Research Center, measures ground deformation over large areas to a precision of 0.1 to 0.5 centimeters (0.04 to 0.2 inches).
By comparing the repeat-pass radar observations, scientists hope to measure any crustal deformations that may occur between observations, allowing them to 'see' the amount of strain building up on fault lines, and giving them a clearer picture of which faults are active and at what rates they're moving, both before earthquakes and after them. The UAVSAR fault mapping project is designed to substantially improve knowledge of regional earthquake hazards in California. The 3-D UAVSAR data will allow scientists to bring entire faults into focus, allowing them to understand faults not just at their surfaces, but also at depth. When integrated into computer models, the data should give scientists a much clearer picture of California's complex fault systems.
The scientists are estimating the total displacement occurring in each region. As additional observations are collected, they expect to be able to determine how strain is partitioned between individual faults.
The UAVSAR flights serve as a baseline for pre-earthquake activity. As earthquakes occur during the course of this project, the team is measuring the deformation at the time of the earthquakes to determine the distribution of slip on the faults, and then monitoring longer-term motions after the earthquakes to learn more about fault zone properties.
Airborne UAVSAR mapping can allow a rapid response after an earthquake to determine what fault was the source and which parts of the fault slipped during the earthquake. Information about the earthquake source can be used to estimate what areas were most affected by the earthquake shaking to guide rescue and damage assessment response.
The scientists now plan to acquire UAVSAR data from the region, possibly as soon as this week, and process the data to validate and improve the results of their model.
The model was developed as part of NASA's QuakeSim project. The JPL-developed QuakeSim is a comprehensive, state-of-the-art software tool for simulating and understanding earthquake fault processes and improving earthquake forecasting. Initiated in 2002, QuakeSim uses NASA remote sensing and other earthquake-related data to simulate and model the behavior of faults in 3-D both individually and as part of complex, interacting systems. This provides long-term histories of fault behavior that can be used for statistical evaluation. QuakeSim also is used to identify regions of increased earthquake probabilities called hotspots. For more on QuakeSim, visit: http://www.quakesim.org. For more information about UAVSAR, visit: http://uavsar.jpl.nasa.gov/.
 Planetary Data System


