PDS logoPlanetary Data System
PDS Information
Find a Node - Use these links to navigate to any of the 8 publicly accessible PDS Nodes.

This bar indicates that you are within the PDS enterprise which includes 6 science discipline nodes and 2 support nodes which are overseen by the Project Management Office at NASA's Goddard Space Flight Center (GSFC). Each node is led by an expert in the subject discipline, supported by an advisory group of other practitioners of that discipline, and subject to selection and approval under a regular NASA Research Announcement.
Click here to return to the Photojournal Home Page Click here to view a list of Photojournal Image Galleries Photojournal_inner_header
Latest Images  |  Spacecraft & Technology  |  Animations  |  Space Images App  |  Feedback  |  Photojournal Search  
Your search criteria found 10 images
Spacecraft
Go to PIAxxxxx:
Refine this list of images by:
Instrument:
Click on an image for detailed information
Click on a column heading to sort in ascending or descending order
My
List
Addition DateSort Ascending Target Mission Instrument Size
Add Image to Favorite List 2012-02-06 Earth Aura
TES
1021x575x3
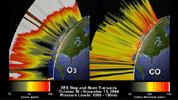
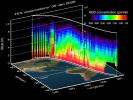
This frame from an animation depicts the distribution of O3 and CO in the atmosphere over North America. This visualization is based on data acquired by NASA's Tropospheric Emission Spectrometer (TES).
PIA15006:
O3 and CO Transects over North America Animation Icon
Full Resolution:     TIFF (1.764 MB)     JPEG (110.1 kB)
Add Image to Favorite List 2012-02-06 Earth Aura
TES
1115x560x3
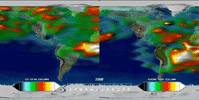
This frame from a time series, from one year of Tropospheric Emission Spectrometer (TES) measurements, shows how powerful the TES data are for understanding emissions, chemistry, and transport in the troposphere.
PIA15005:
Annual Variation in Global CO and O3 Animation Icon
Full Resolution:     TIFF (1.876 MB)     JPEG (70.63 kB)
Add Image to Favorite List 2011-10-02 Earth Aura
MLS
708x312x3
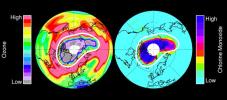
In mid-March 2011, NASA's Aura spacecraft observed ozone in Earth's stratosphere -- low ozone amounts are shown in purple and grey colors, large amounts of chlorine monoxide are shown in dark blue colors.
PIA14824:
Unprecedented Arctic Ozone Loss in 2011
Full Resolution:     TIFF (663.8 kB)     JPEG (44.02 kB)
Add Image to Favorite List 2010-03-16 Earth Aura
MLS
760x760x3
NASA's Aura spacecraft sees El Niño's effects on the atmosphere. An El Niño is characterized by an abnormal warming of sea surface temperatures in the equatorial central and eastern Pacific Ocean.
PIA12961:
NASA's Aura Sees El Niño's Effects on the Atmosphere
Full Resolution:     TIFF (1.735 MB)     JPEG (91.76 kB)
Add Image to Favorite List 2009-08-13 Earth Aura
TES
800x600x3
This vertical profile view from the Tropospheric Emission Spectrometer (TES) instrument on NASA's Aura satellite depicts the distribution of water vapor molecules over Earth's tropics across one transect of the satellite's orbit on January 6, 2006.
PIA12170:
A NASA Space Sleuth Hunts the Trail of Earth's Water
Full Resolution:     TIFF (1.442 MB)     JPEG (75.35 kB)
Add Image to Favorite List 2005-06-02 Earth Aura
MLS
720x540x3
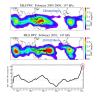
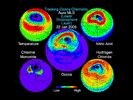
This still from an animation created from data from the Microwave Limb Sounder instrument on NASA's Aura spacecraft depicts the complex interaction of chemicals involved in the destruction of ozone during the 2005 Arctic winter.
PIA07255:
Aura Microwave Limb Sounder Animation Illustrating the Interaction Between Temperatures and Chemicals Involved in Ozone Destruction, 2004-2005 Arctic Winter Animation Icon
Full Resolution:     TIFF (1.168 MB)     JPEG (60.91 kB)
Add Image to Favorite List 2005-06-02 Earth Aura
Ozone Monitoring Instrument
2215x6554x3
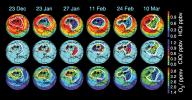
Images from the Ozone Monitoring Instrument onboard NASA's Aura spacecraft shows the average total column ozone during the months of January and March, and the total column ozone on the single day of 11 March, 2005.
PIA07254:
Selected Measurements of Total Arctic Column Ozone Amounts from Aura's Ozone Monitoring Instrument, 2004-2005 Arctic Winter
Full Resolution:     TIFF (43.6 MB)     JPEG (1.489 MB)
Add Image to Favorite List 2005-06-02 Earth Aura
MLS
642x335x3
These data maps from the Microwave Limb Sounder on NASA's Aura spacecraft depict levels of hydrogen chloride, chlorine monoxide, and ozone at an altitude of approximately 19 km (490,000 ft) on selected days during the 2004-05 Arctic winter.
PIA07252:
Aura's Microwave Limb Sounder Estimates of Ozone Loss, 2004/2005 Arctic Winter
Full Resolution:     TIFF (646.1 kB)     JPEG (65.28 kB)
Add Image to Favorite List 2005-06-02 Earth Aura
MLS
1013x939x3
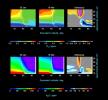
This image from the Microwave Limb Sounder instrument on NASA's Aura spacecraft depicts the relationship between nitrous oxide levels and ozone loss, 2004-2005 Arctic winter.
PIA07994:
Microwave Limb Sounder Measurements Depicting the Relationship Between Nitrous Oxide Levels and Ozone Loss, 2004-2005 Arctic Winter
Full Resolution:     TIFF (2.858 MB)     JPEG (93.72 kB)
Add Image to Favorite List 2004-04-01 Earth Aura
TES
1041x761x3
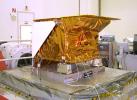
Technicians install NASA's Tropospheric Emission Spectrometer (TES) instrument on NASA's Aura spacecraft prior to launch in July 2004.
PIA15608:
NASA's Tropospheric Emission Spectrometer (TES) Instrument Onboard Aura
Full Resolution:     TIFF (2.378 MB)     JPEG (128.1 kB)
Currently displaying images: 1 - 10 of 10