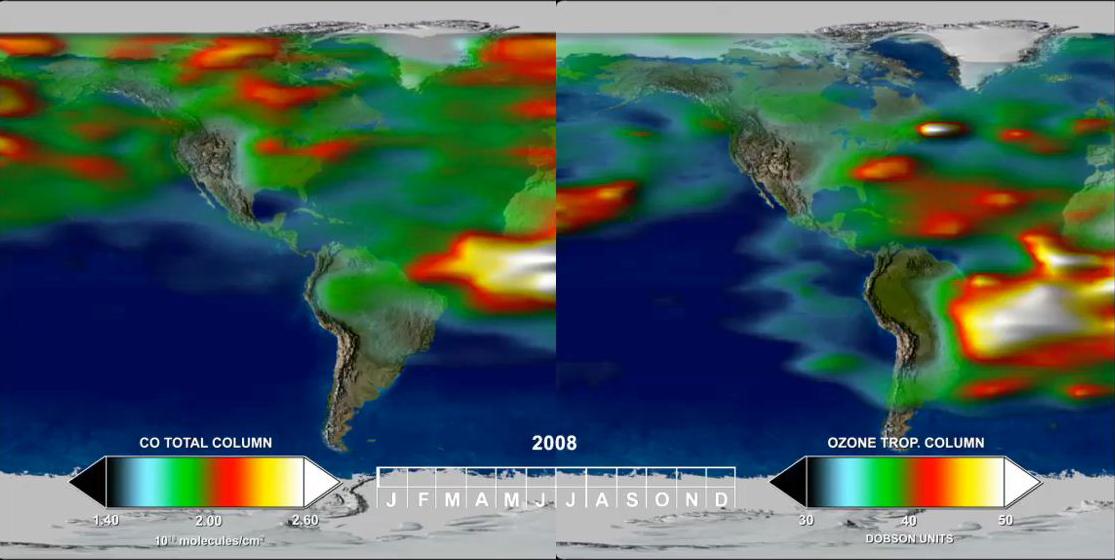
Click on the image for the videoThis time series, from one year of Tropospheric Emission Spectrometer (TES) measurements, shows how powerful the TES data are for understanding emissions, chemistry, and transport in the troposphere.In the Southern Hemisphere (SH), CO and O3 are highly correlated throughout the year. High values indicate active biomass burning, which reaches a maximum during SH spring (Sept., Oct., and Nov.).
In the Northern Hemisphere (NH), CO is produced primarily by fossil fuel consumption and thus its emissions reach a maximum during NH winter (Dec., Jan., Feb.). NH O3, in contrast, is at a minimum in winter, when weak sunlight limits photochemical production. The NH CO-O3 relationship is reversed during the summer, when CO sources are reduced and photochemistry is more active. The summer sunlight produces abundant hydrogen oxides (HOx), critical players in atmospheric chemistry, which act as a sink for CO but are a source of O3 in polluted regions where nitrogen oxides (NOx) are present. The stratosphere also contributes to the spring/summer buildup of O3 in the NH, with the stratosphere-to-troposphere flux of O3 reaching a maximum in NH mid-latitudes in late NH spring (March, Apr. May).
In the tropics, CO sources are small but O3 is produced along the Inter-Tropical Convergence Zone (ITCZ) as a result of NOx production by lightning. These regional differences in emissions and chemistry are clear, but so is the rapid communication between different regions through long-range transport. Since CO and O3 have relatively long lifetimes compared to the timescales for atmospheric mixing, they act as excellent tracers of atmospheric motion. Much of the rapid transport between regions takes place along the storm tracks in mid-latitudes.
For more information regarding this animation, please contact John Worden or Vincent Realmuto, Jet Propulsion Laboratory.
