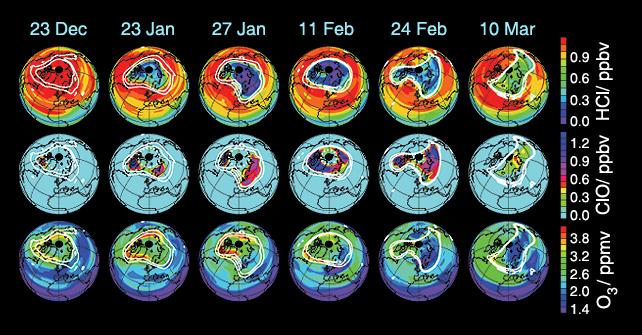
These data maps from Aura's Microwave Limb Sounder depict levels of hydrogen chloride (top), chlorine monoxide (center), and ozone (bottom) at an altitude of approximately 19 kilometers (490,000 feet) on selected days during the 2004-05 Arctic winter. White contours demark the boundary of the winter polar vortex.
The maps from December 23, 2004, illustrate vortex conditions shortly before significant chemical ozone destruction began. By January 23, 2005, chlorine is substantially converted from the "safe" form of hydrogen chloride, which is depleted throughout the vortex, to the "unsafe" form of chlorine monoxide, which is enhanced in the portions of the region that receive sunlight at that time of year. Ozone increased over the month as a result of dynamical effects, and chemical ozone destruction is just beginning at this time. A brief period of intense cold a few days later promotes further chlorine activation and consequent changes in hydrogen chloride and chlorine monoxide levels on January 27, 2005. Peak chlorine monoxide enhancement occurs in early February.
By February 24, 2005, chlorine deactivation is well underway, with chlorine monoxide abundances dropping and hydrogen chloride abundances rising. Almost all chlorine monoxide has been quenched by March 10, 2005. The fact that hydrogen chloride has not fully rebounded to December abundances suggests that some of that chemical was recovered into another chlorine reservoir species.
Ozone maps for January 27, 2005, through March 10, 2005, show indications of mixing of air from outside the polar vortex into it. Such occurrences throughout this winter, especially in late February and early March, complicate analyses, and detailed calculations are required to rigorously disentangle chemical and dynamical effects and accurately diagnose chemical ozone destruction.
Based on various analyses of Microwave Limb Sounder data, we estimate that maximum local ozone loss of approximately 2 parts per million by volume (approximately 60 percent) has taken place at this level during the period from January 23, 2005, to March 10, 2005, with vortex-averaged loss of approximately 1.5 parts per million by volume.
