My
List |
Addition Date
|
Target
|
Mission
|
Instrument
|
Size
|

|
2009-05-08 |
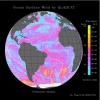
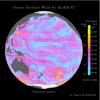
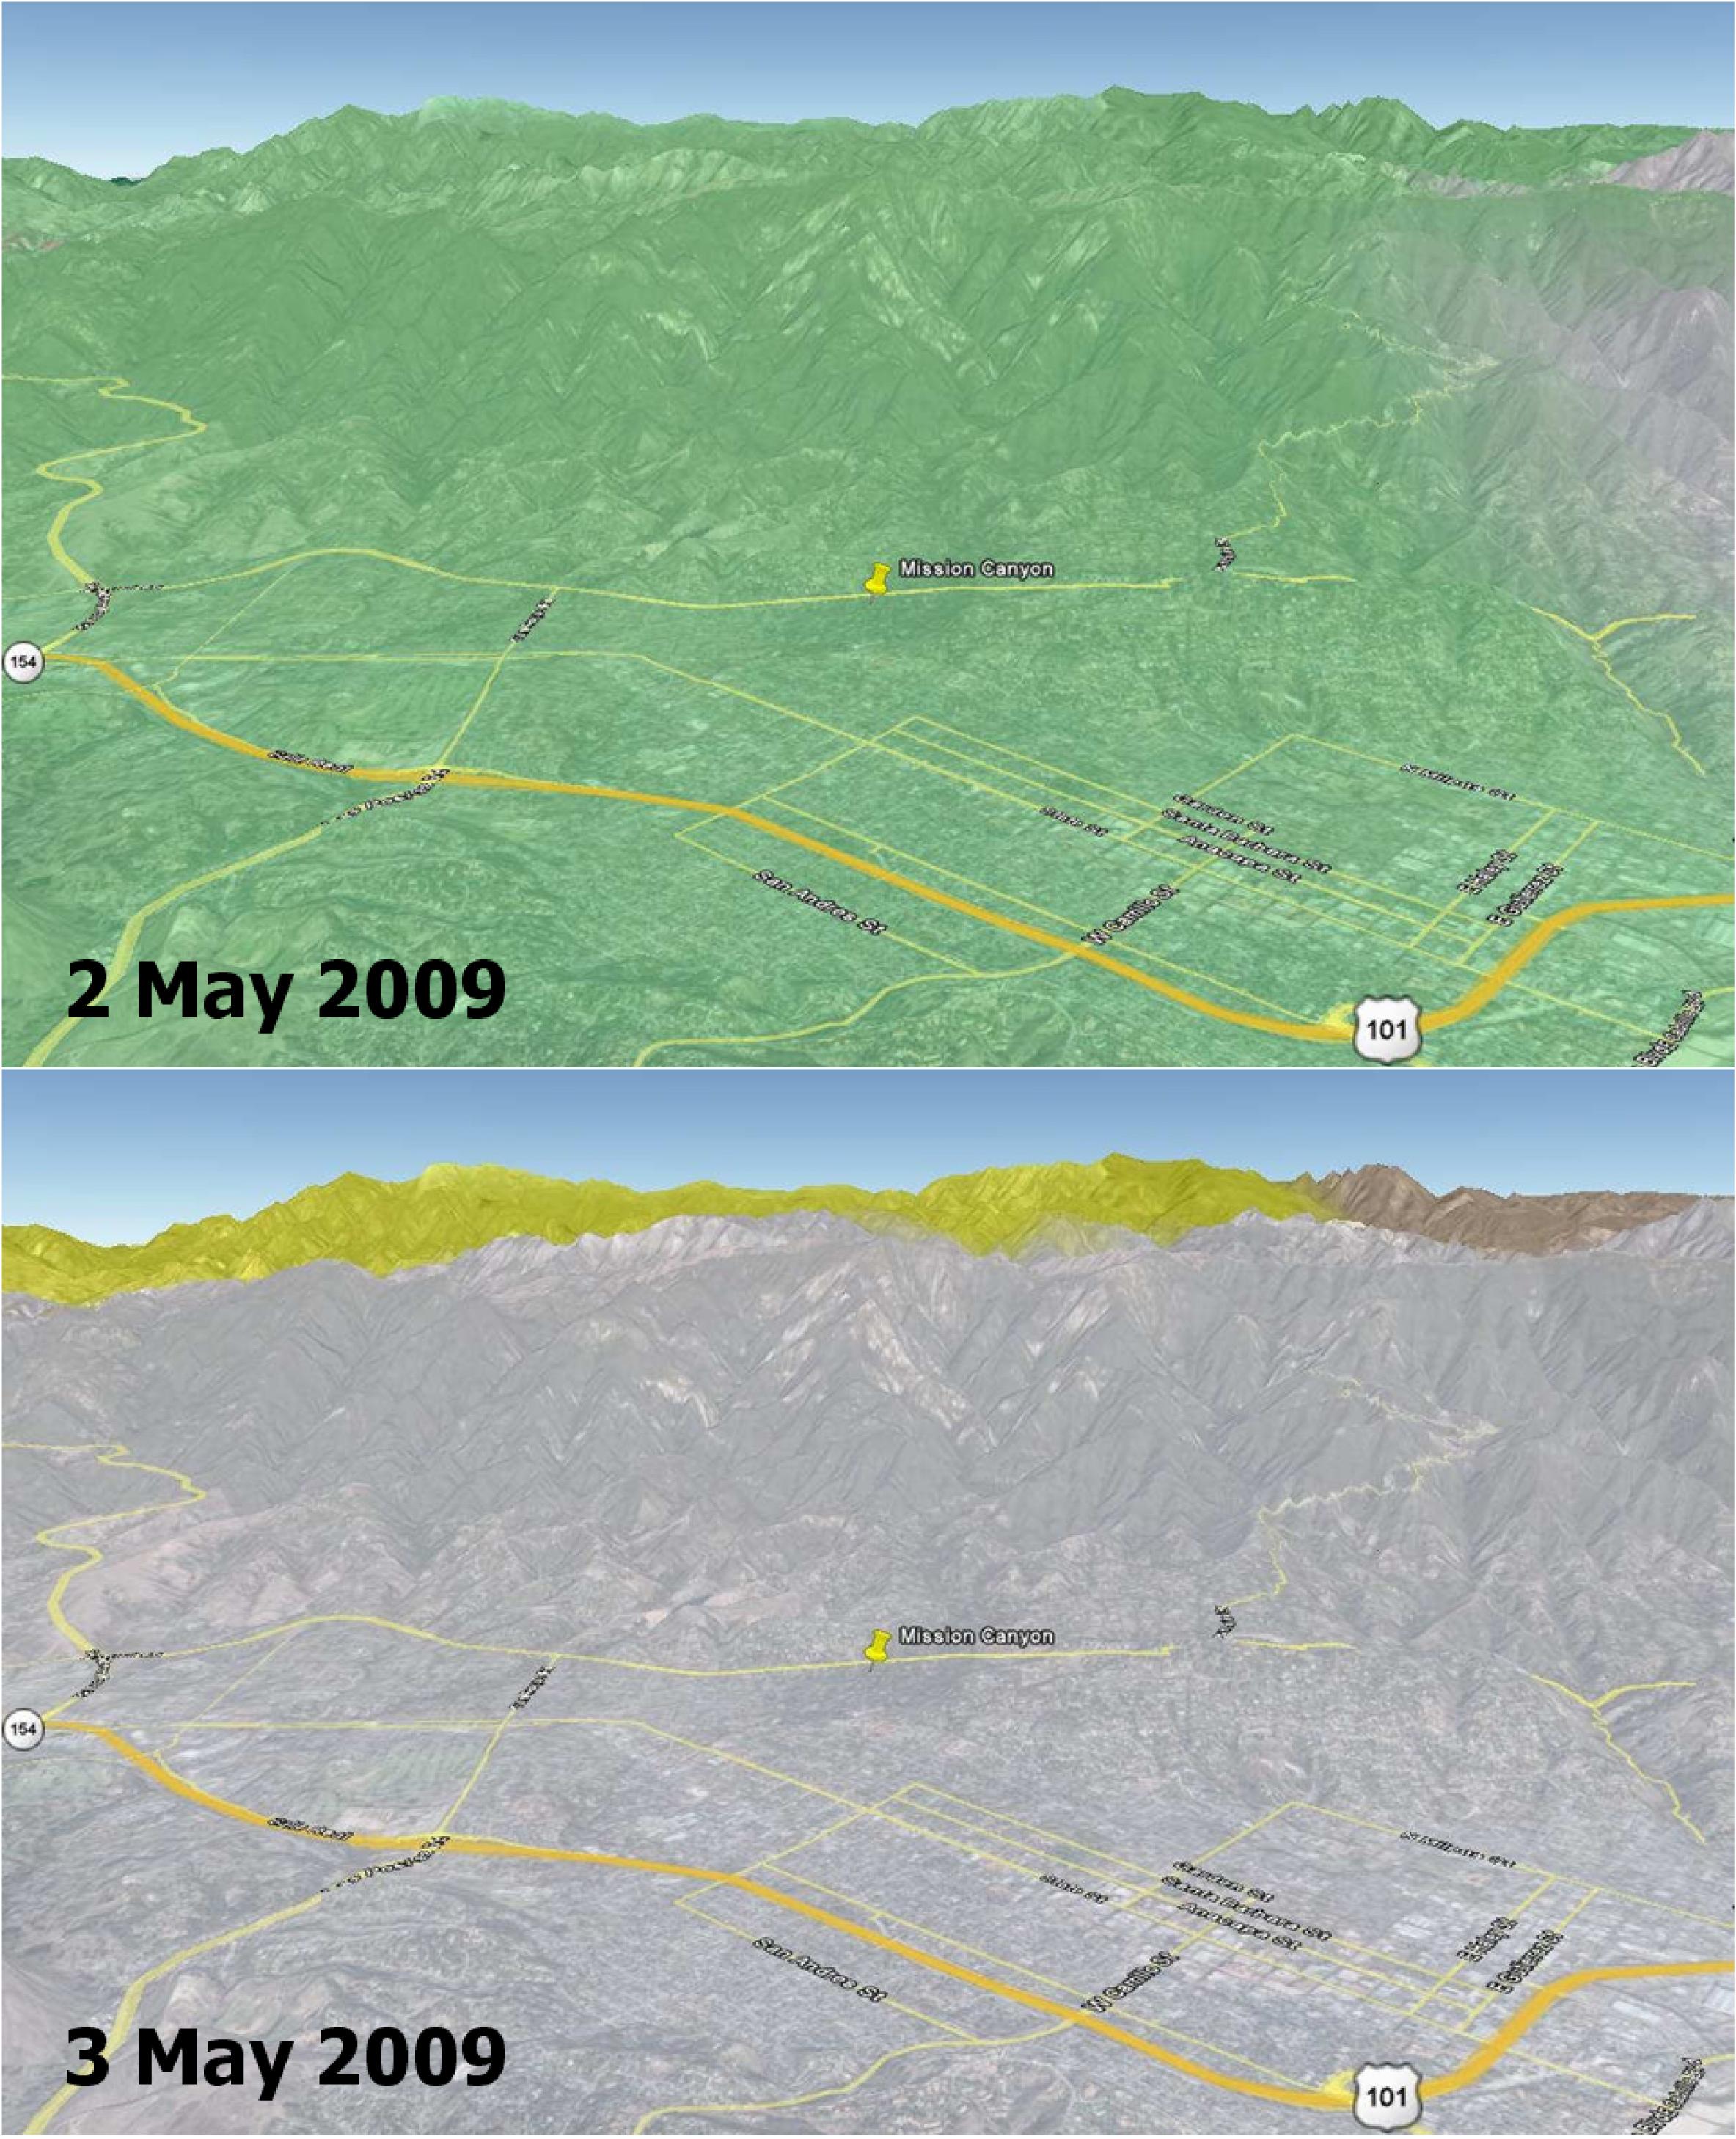
Earth
|
QuikScat
|
SeaWinds Scatterometer
|
2367x2916x3 |
|
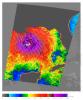
-
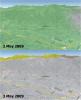
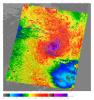
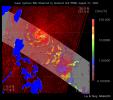
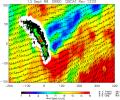
PIA12006:
-
Disaster Management: Rapid Dry-Up of Rainwater on Land Surface Leading to the Santa Barbara Wildfire
Full Resolution:
TIFF
(20.73 MB)
JPEG
(727.8 kB)
|
|
|
2008-09-11 |
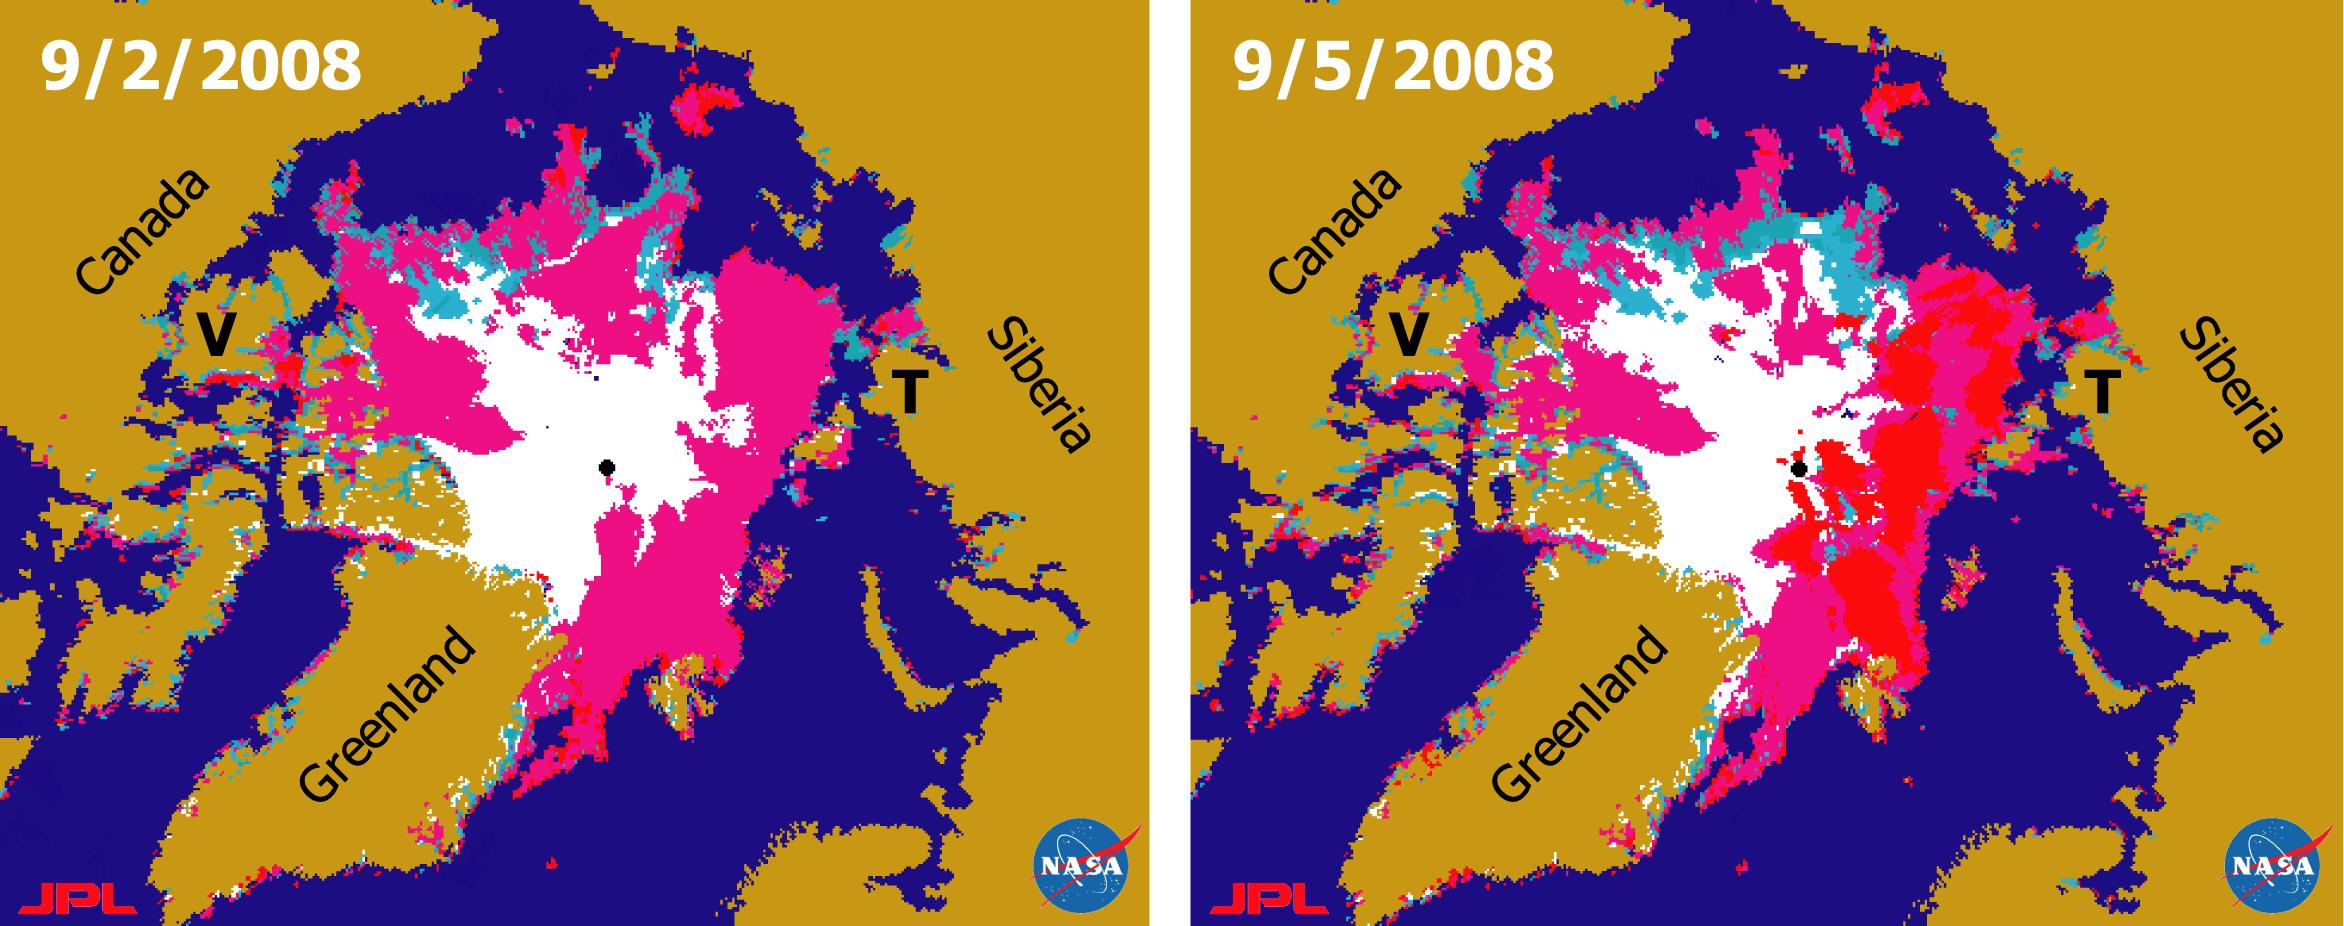
Earth
|
QuikScat
|
SeaWinds Scatterometer
|
2344x926x3 |
|
-
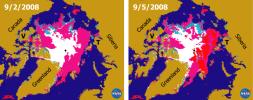
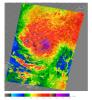
PIA11086:
-
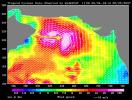
Recent State of Arctic Sea Ice
Full Resolution:
TIFF
(6.519 MB)
JPEG
(290.8 kB)
|
|
|
2007-10-23 |
Earth
|
QuikScat
|
SeaWinds Scatterometer
|
800x875x3 |
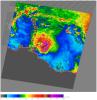
|
-
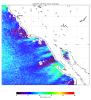
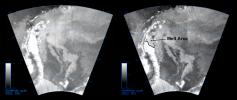
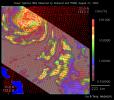
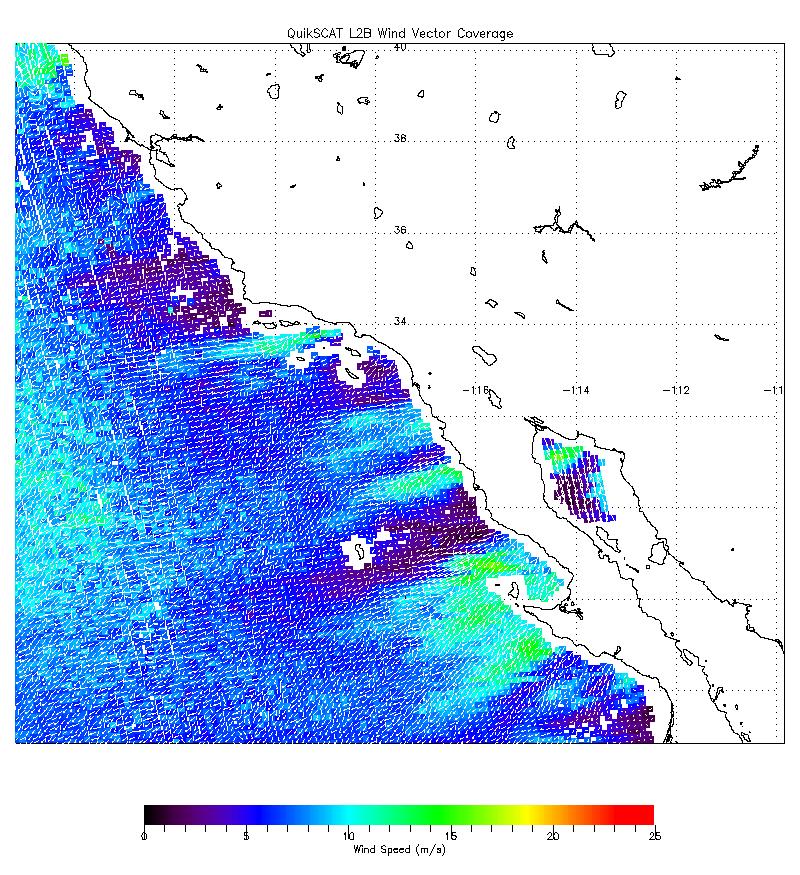
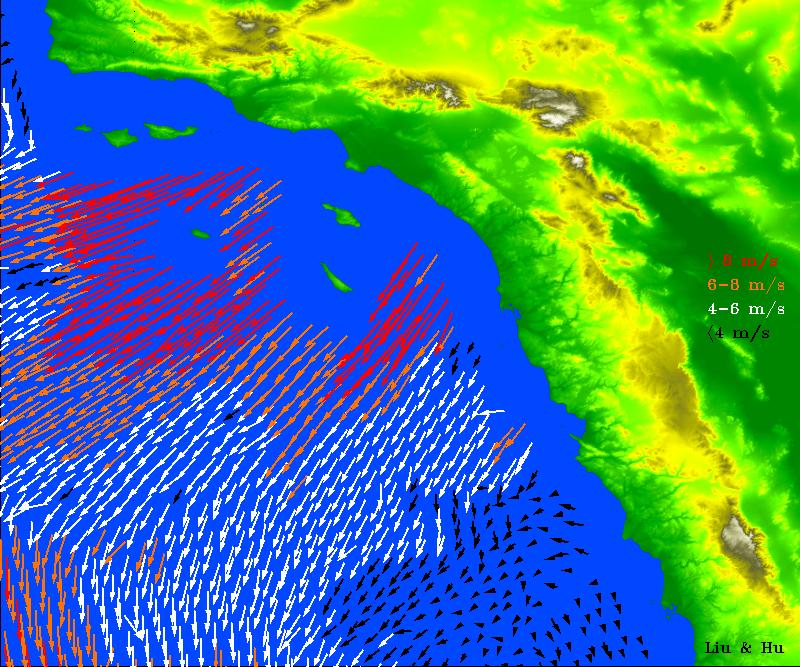
PIA10089:
-
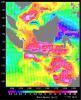
NASA's QuikScat Maps Southern California's Destructive Santa Ana Winds
Full Resolution:
TIFF
(702.5 kB)
JPEG
(223.2 kB)
|
|
|
2007-09-07 |
Earth
|
QuikScat
|
SeaWinds Scatterometer
|
1820x1560x3 |
|
-
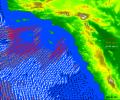
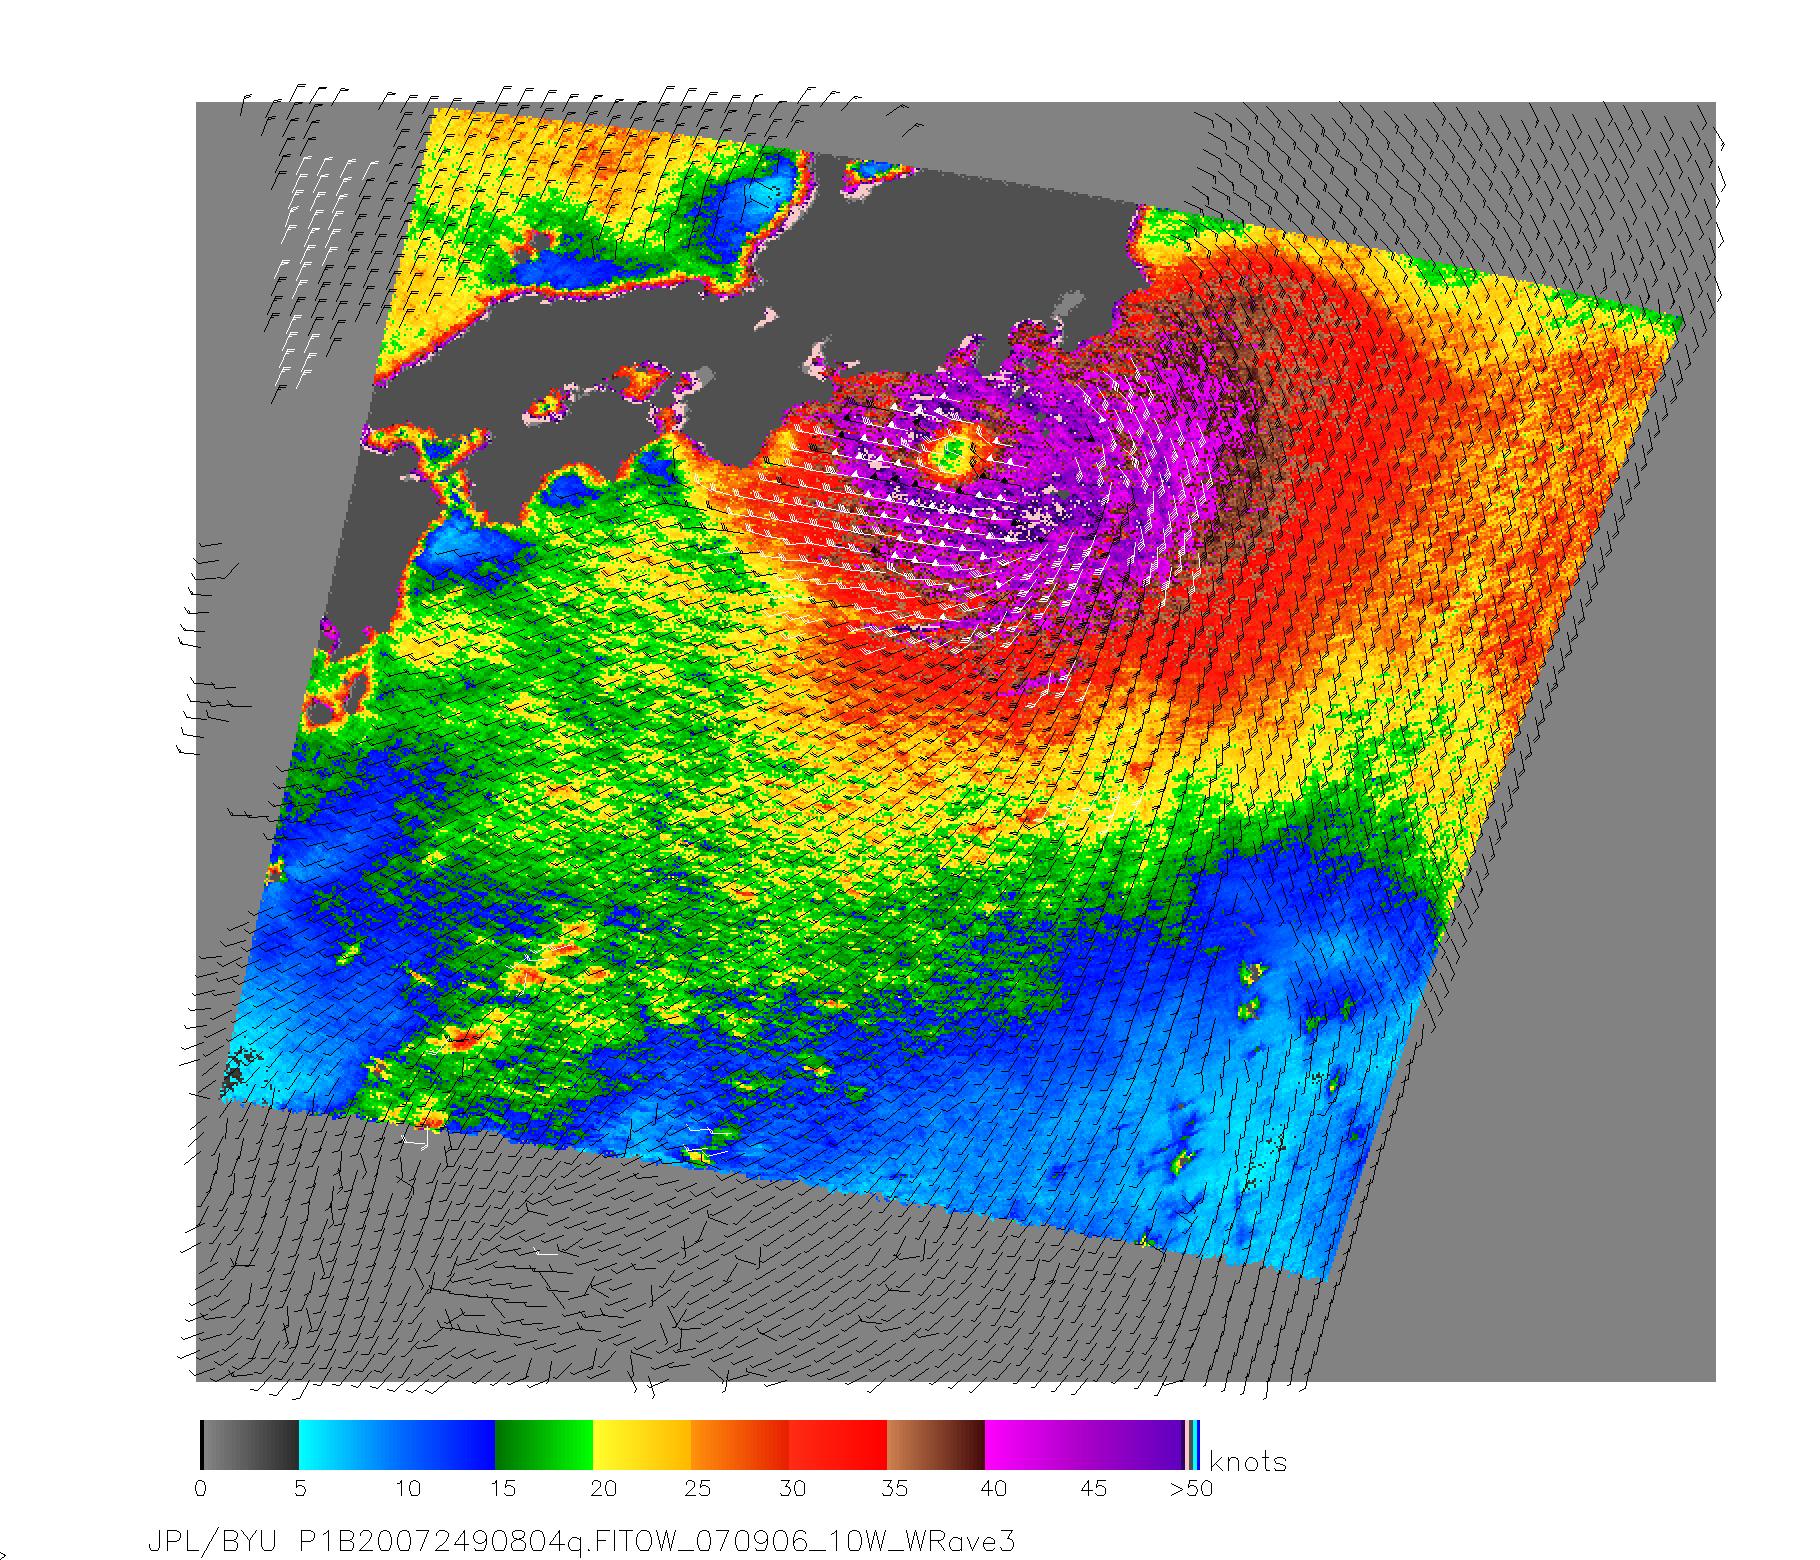
PIA09978:
-
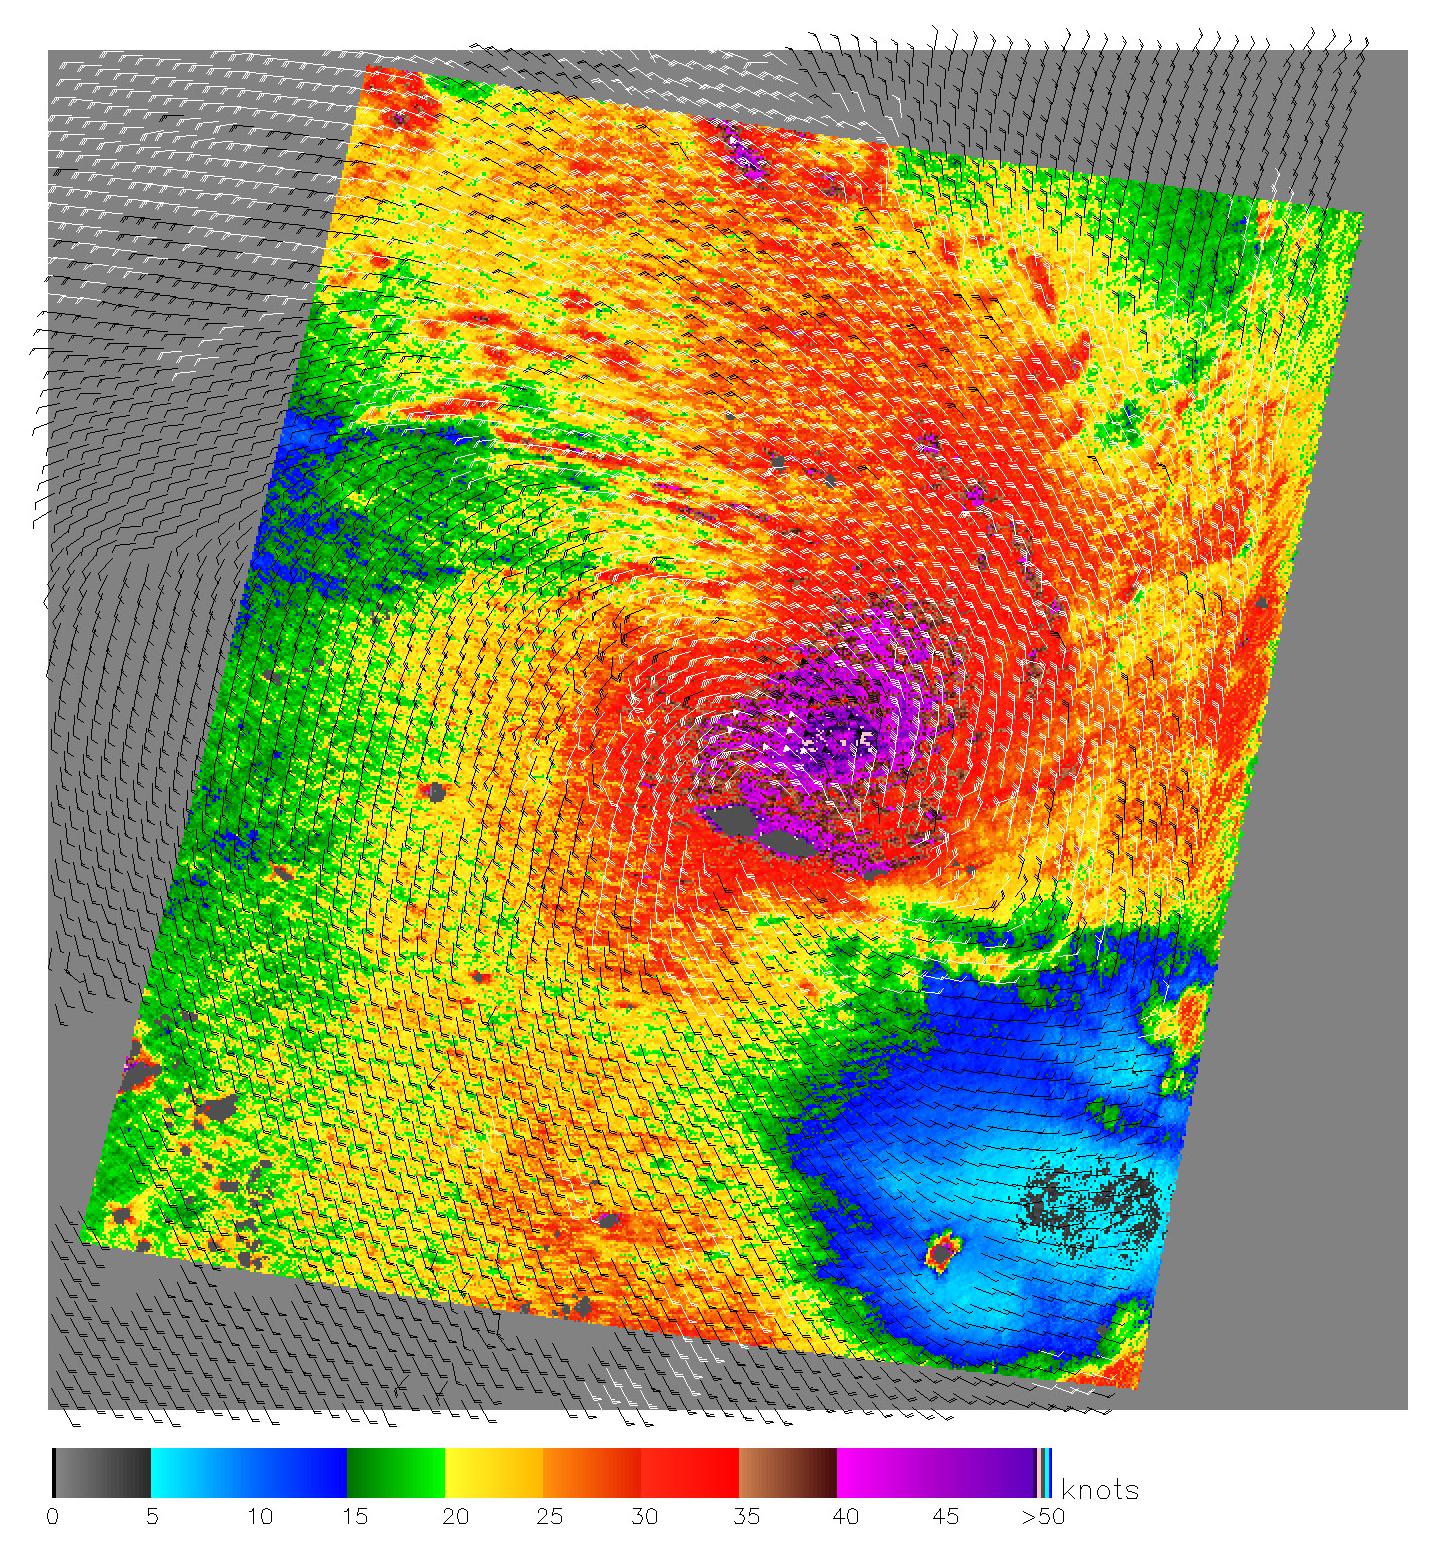
NASA Measures Fitow's Winds by Satellite
Full Resolution:
TIFF
(8.53 MB)
JPEG
(711.1 kB)
|
|
|
2007-06-06 |
Earth
|
QuikScat
|
SeaWinds Scatterometer
|
1418x1071x3 |
|
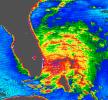
-
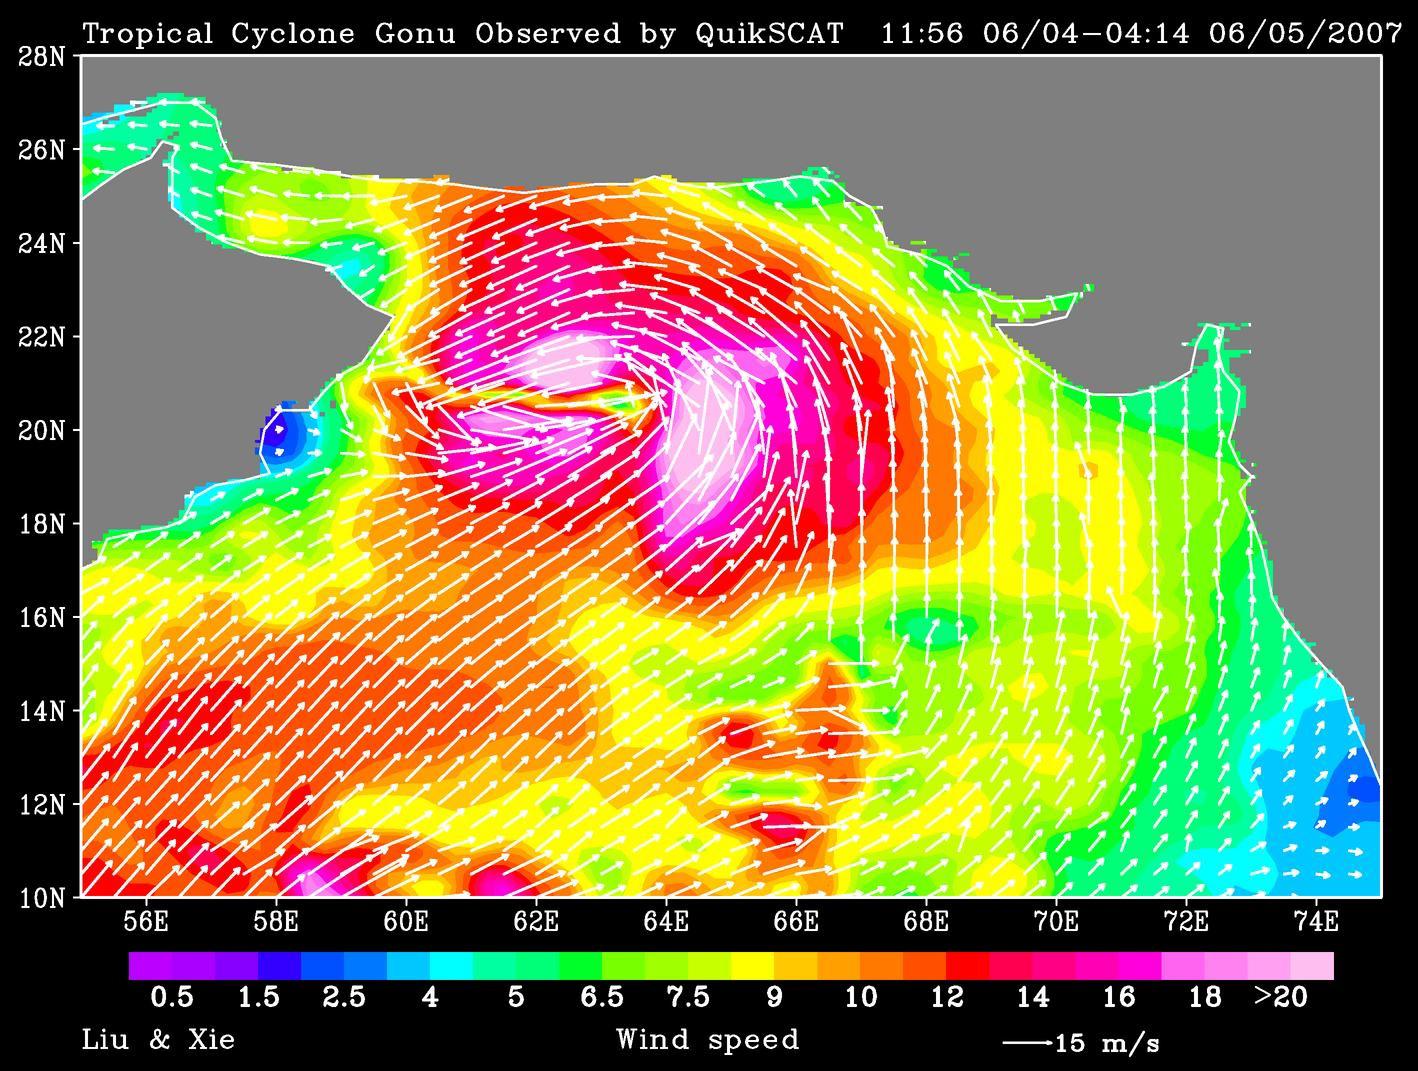
PIA09600:
-
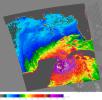
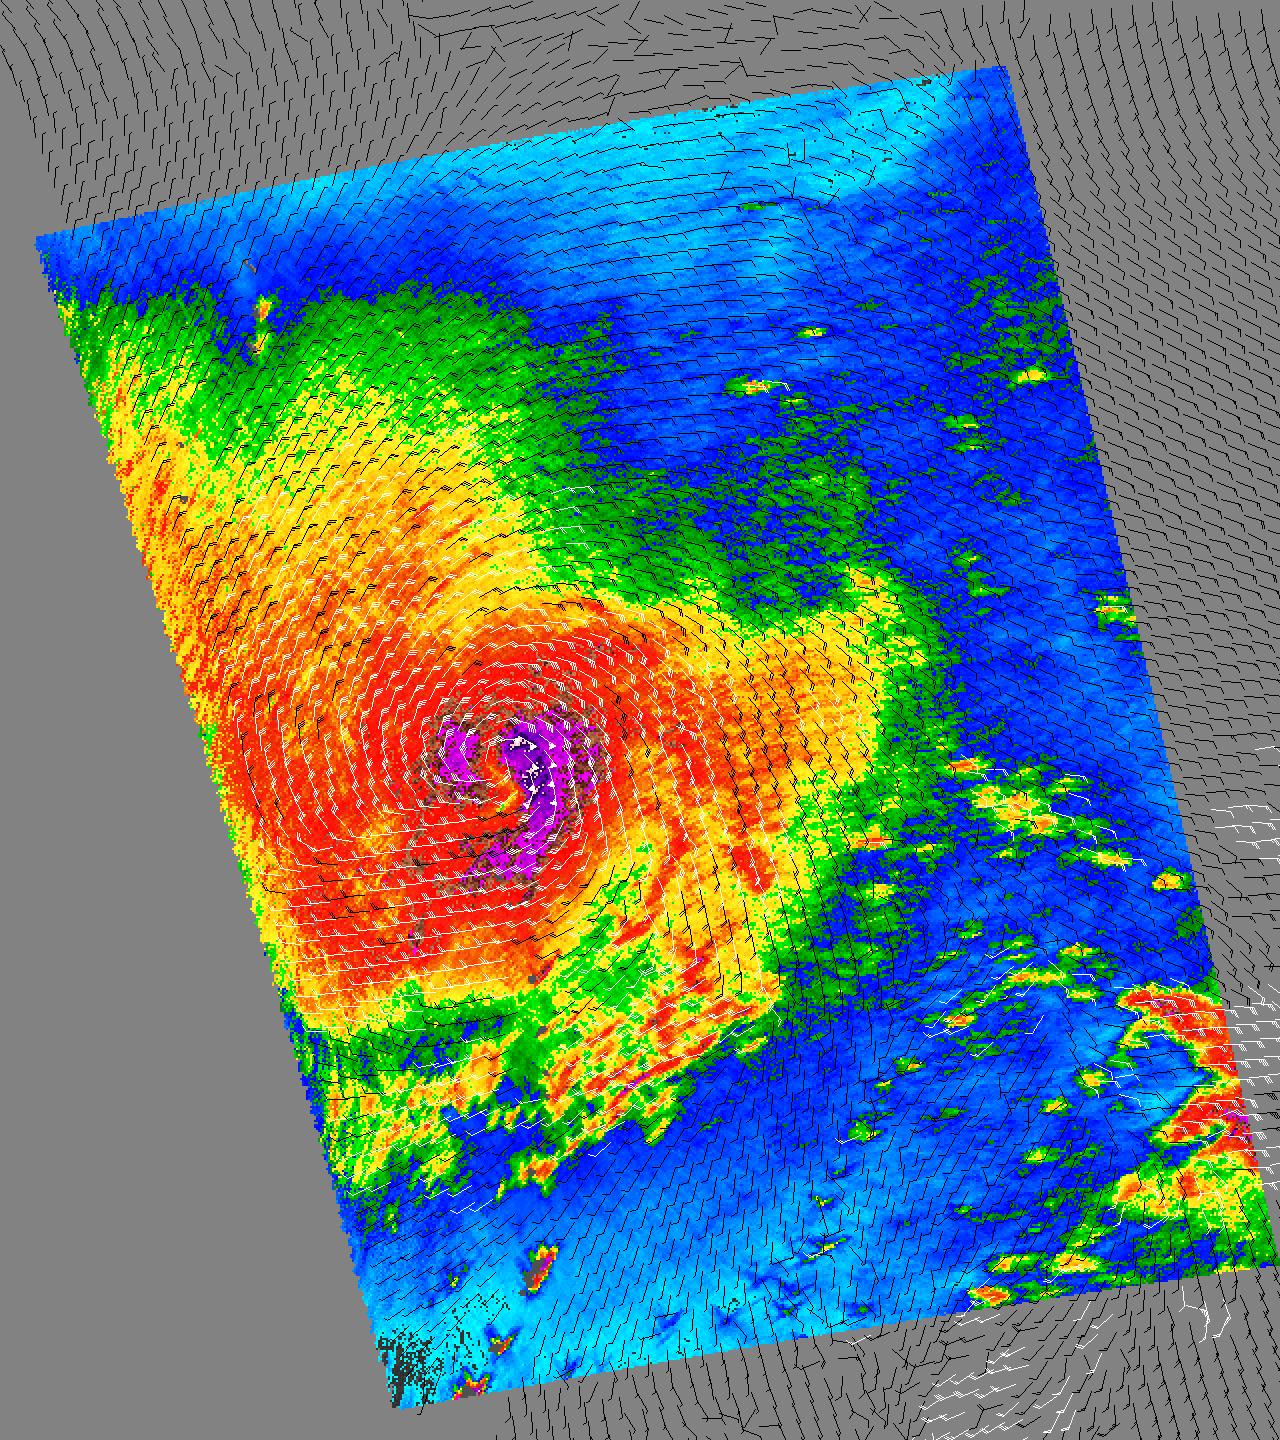
Tropical Cyclone Gonu Observed by QuikSCAT
Full Resolution:
TIFF
(4.565 MB)
JPEG
(271 kB)
|
|
|
2007-01-09 |
Earth
|
QuikScat
|
SeaWinds Scatterometer
|
1321x1623x3 |
|
-
PIA09110:
-
QuikScat Shows Rough Seas/Atmospheric Conditions at Time of Two Java Sea
Disasters
Full Resolution:
TIFF
(6.439 MB)
JPEG
(514.7 kB)
|
|
|
2005-10-21 |
Earth
|
QuikScat
|
SeaWinds Scatterometer
|
1599x1566x3 |
|
-
PIA03056:
-
Wilma's Winds Whip Mexico's Yucatan
Full Resolution:
TIFF
(2.508 MB)
JPEG
(579.9 kB)
|
|
|
2005-10-12 |
Earth
|
QuikScat
|
SeaWinds Scatterometer
|
3869x2421x3 |
|
-
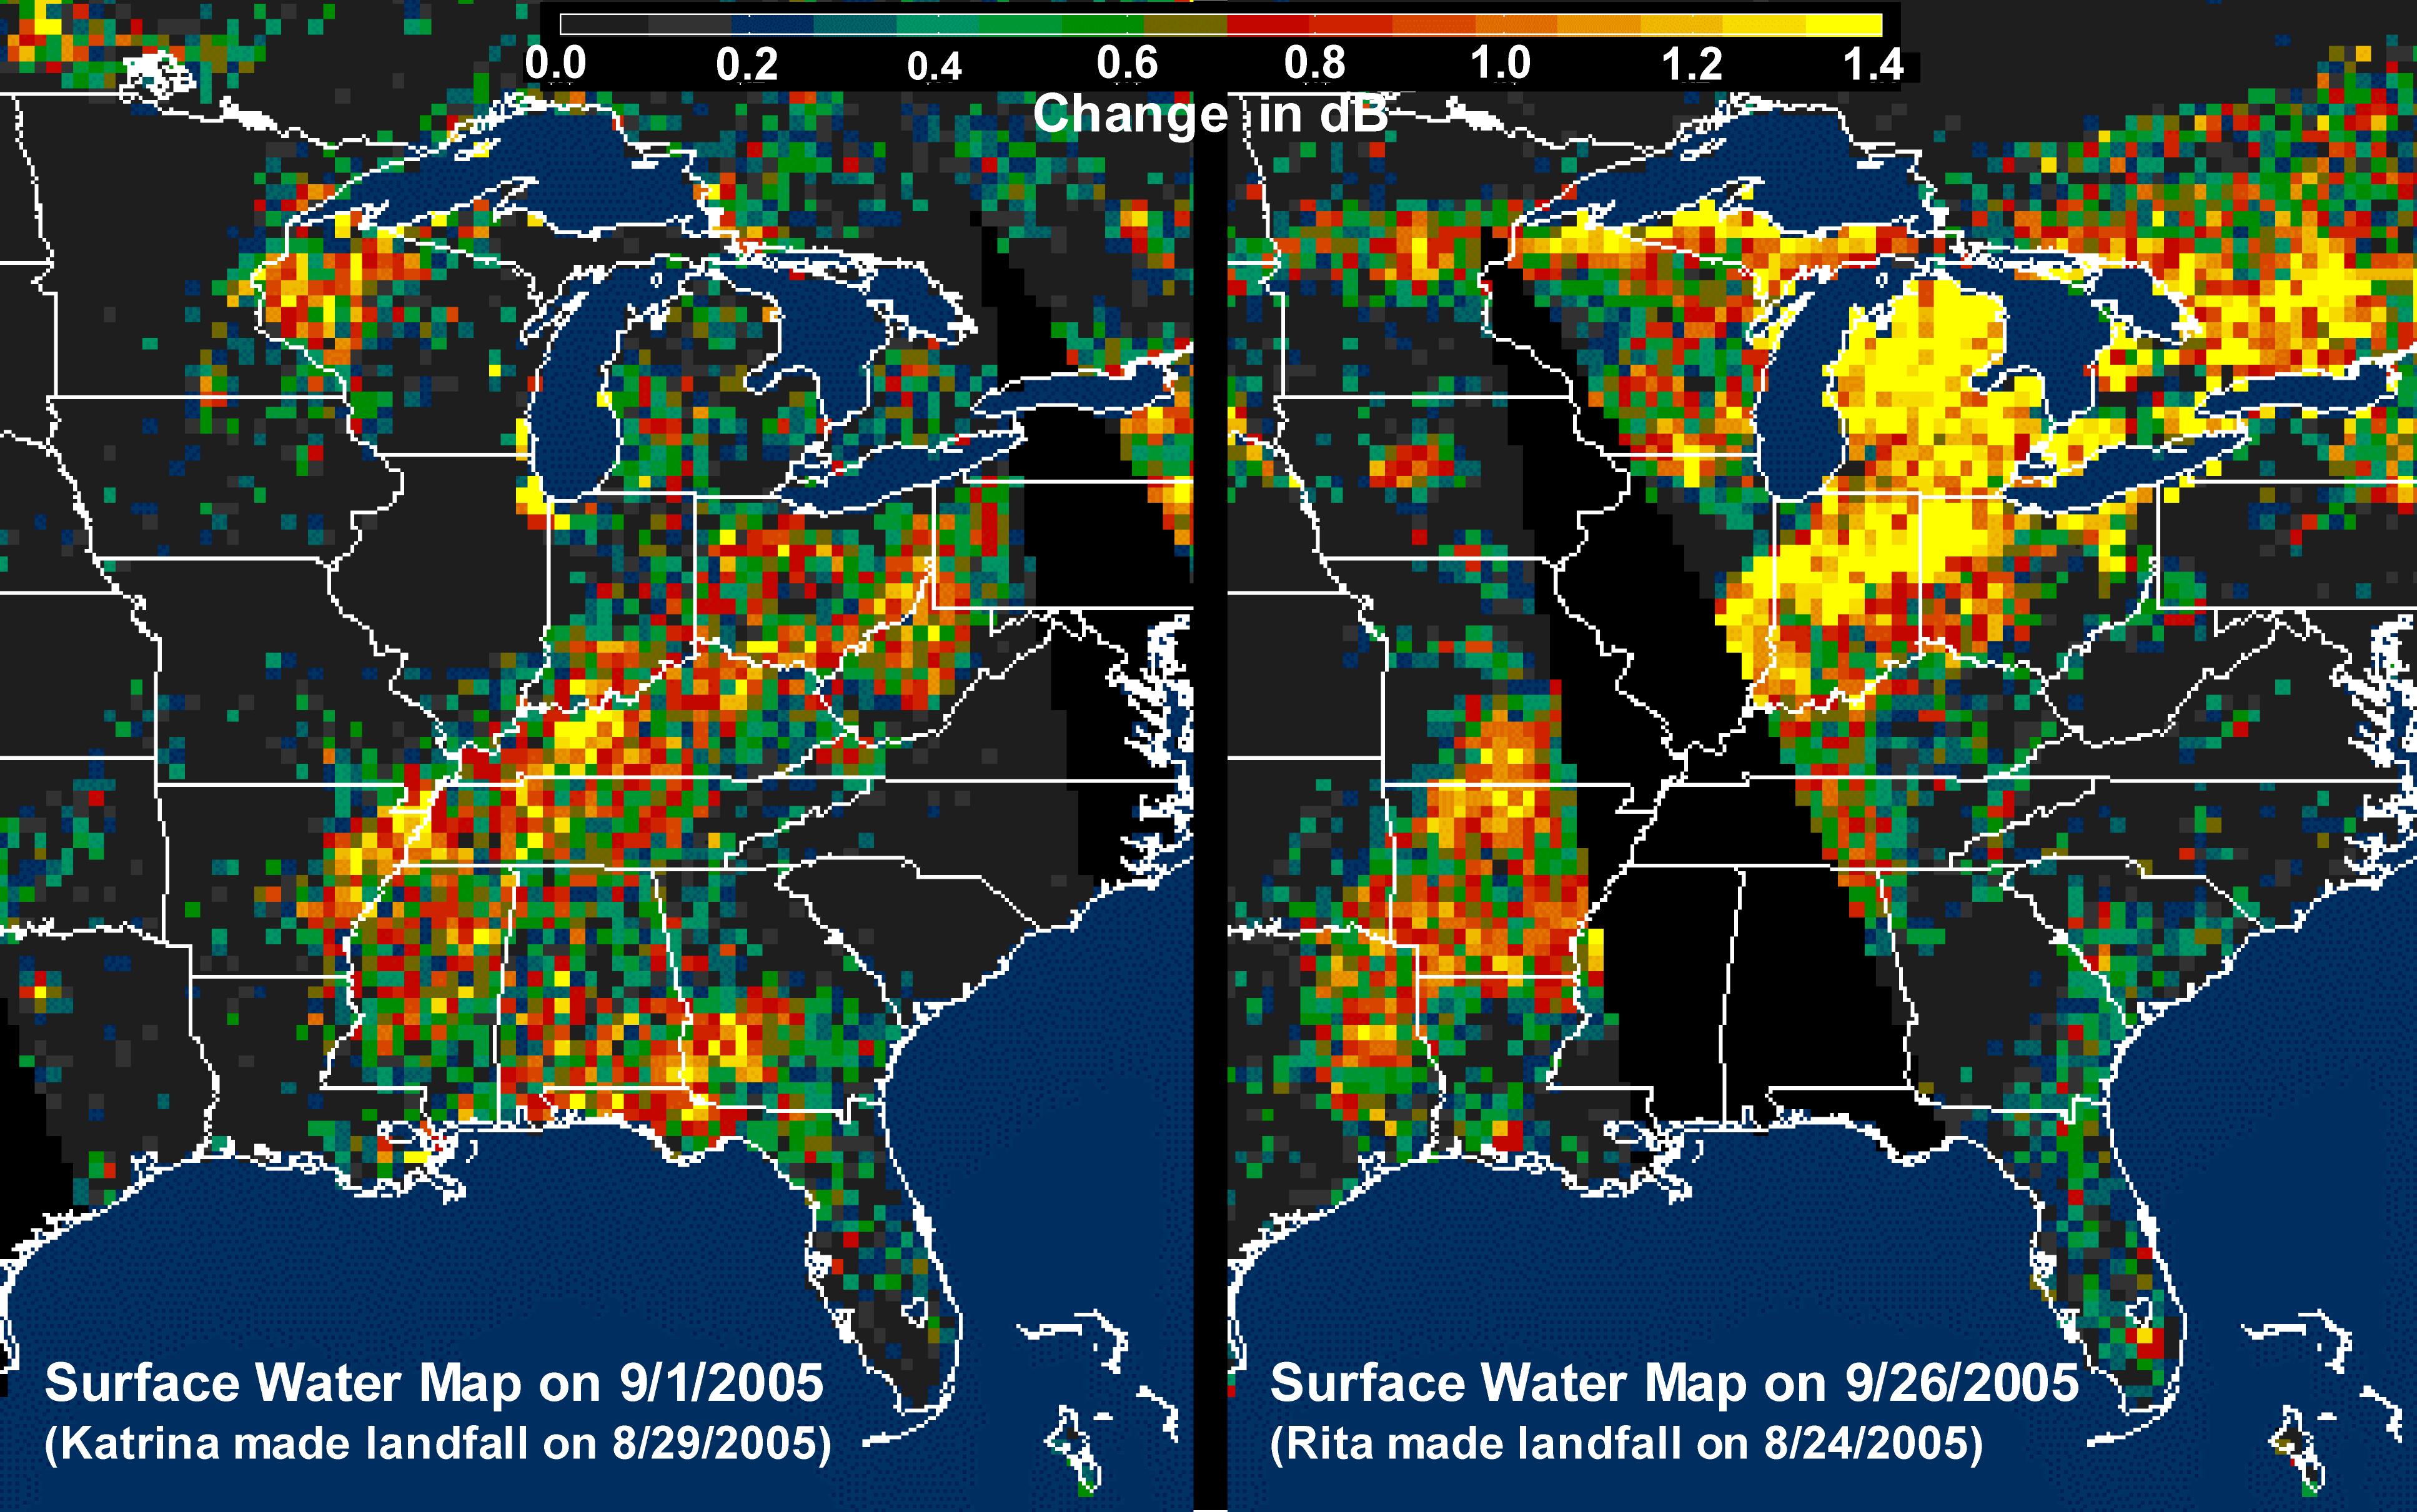
PIA03029:
-
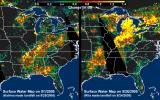
Distribution Patterns of Land
Surface Water from Hurricanes Katrina and Rita
Full Resolution:
TIFF
(28.1 MB)
JPEG
(1.148 MB)
|
|
|
2005-08-29 |
Earth
|
QuikScat
|
SeaWinds Scatterometer
|
1272x1531x3 |
|
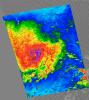
-
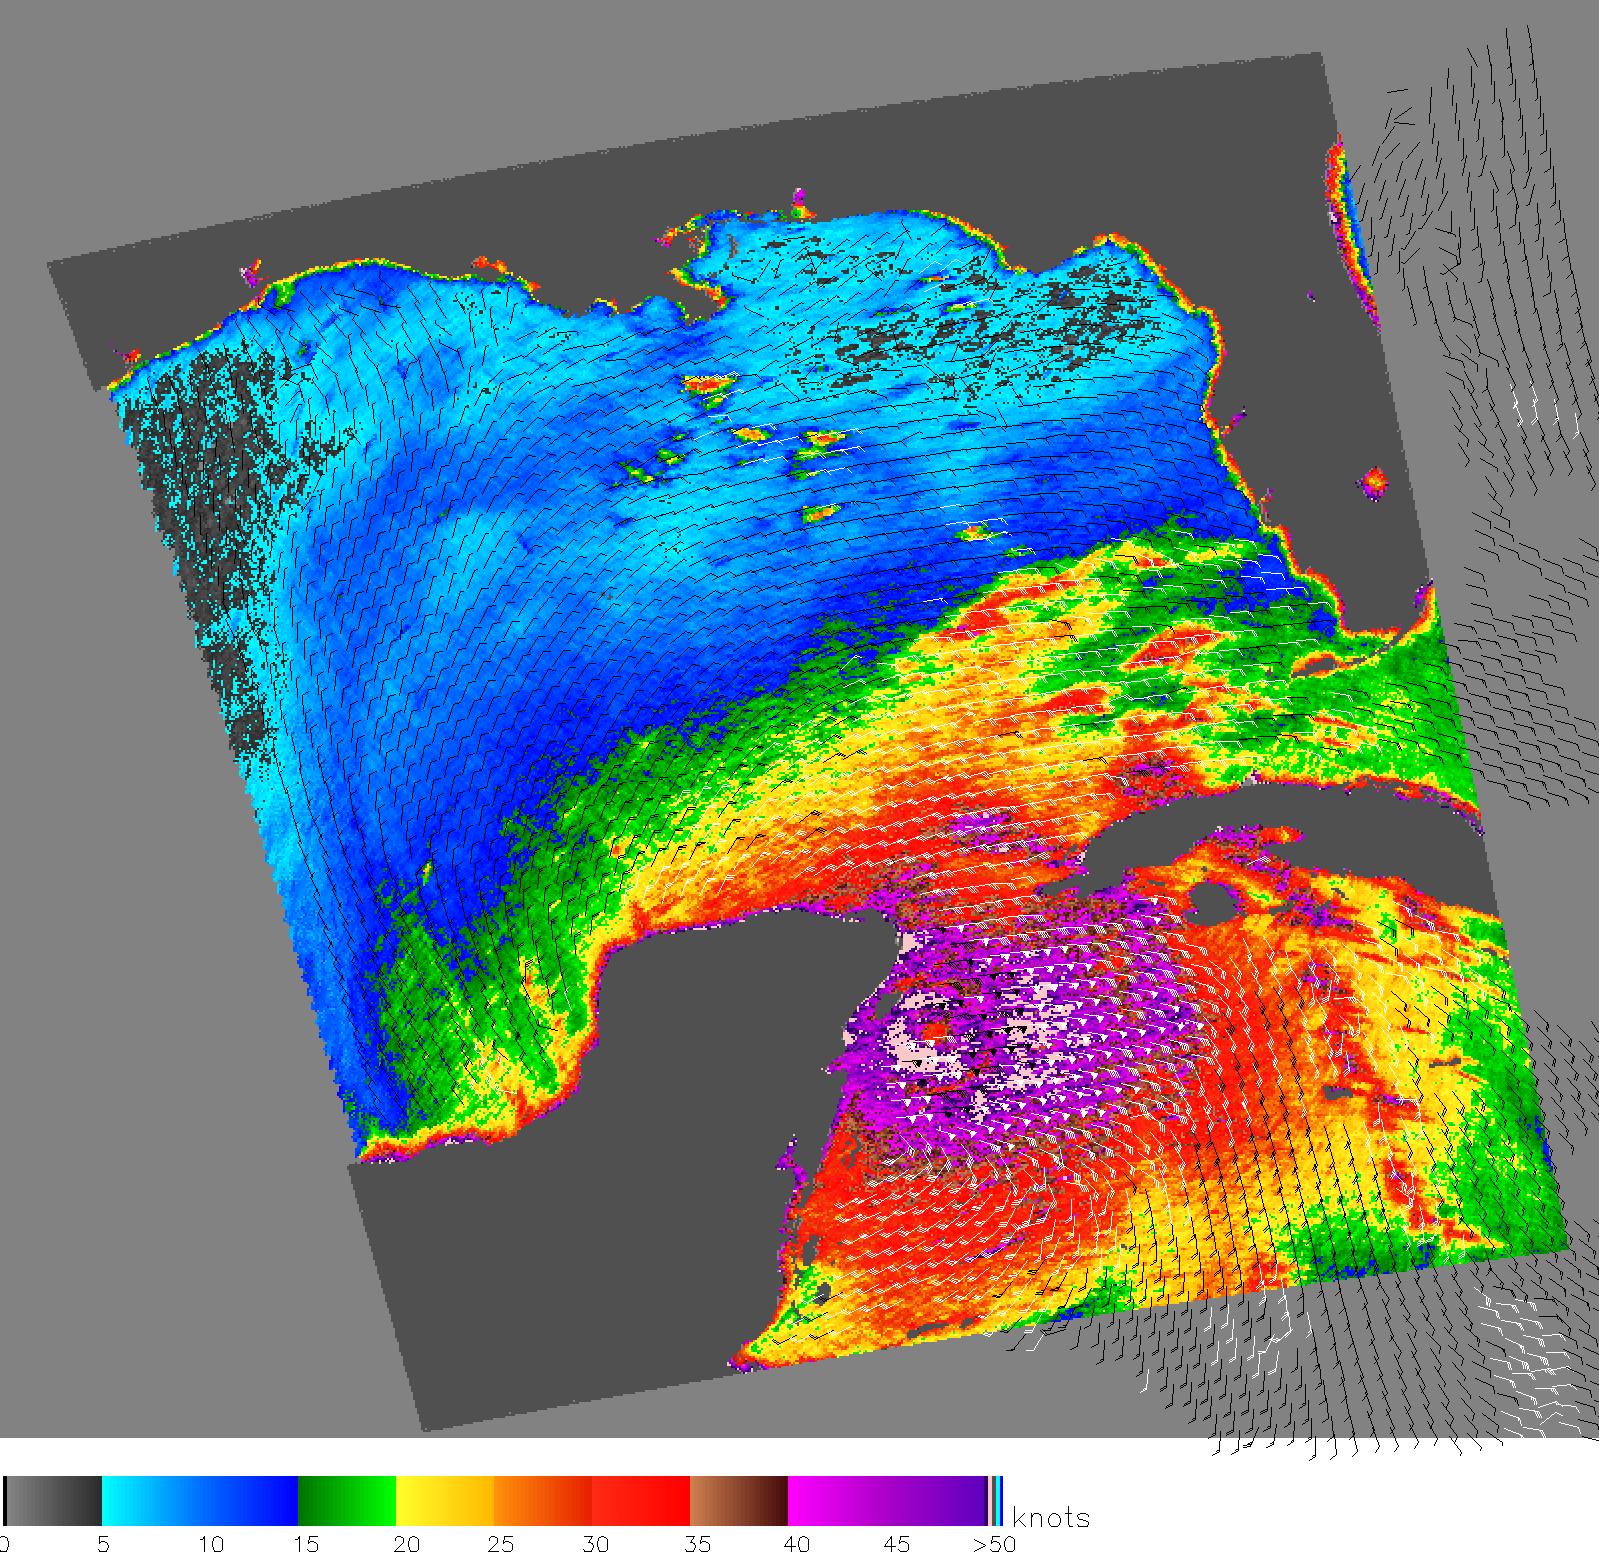
PIA04176:
-
Hurricane Katrina
Full Resolution:
TIFF
(5.849 MB)
JPEG
(446.3 kB)
|
|
|
2005-08-25 |
Earth
|
QuikScat
|
SeaWinds Scatterometer
|
835x773x3 |
|
-
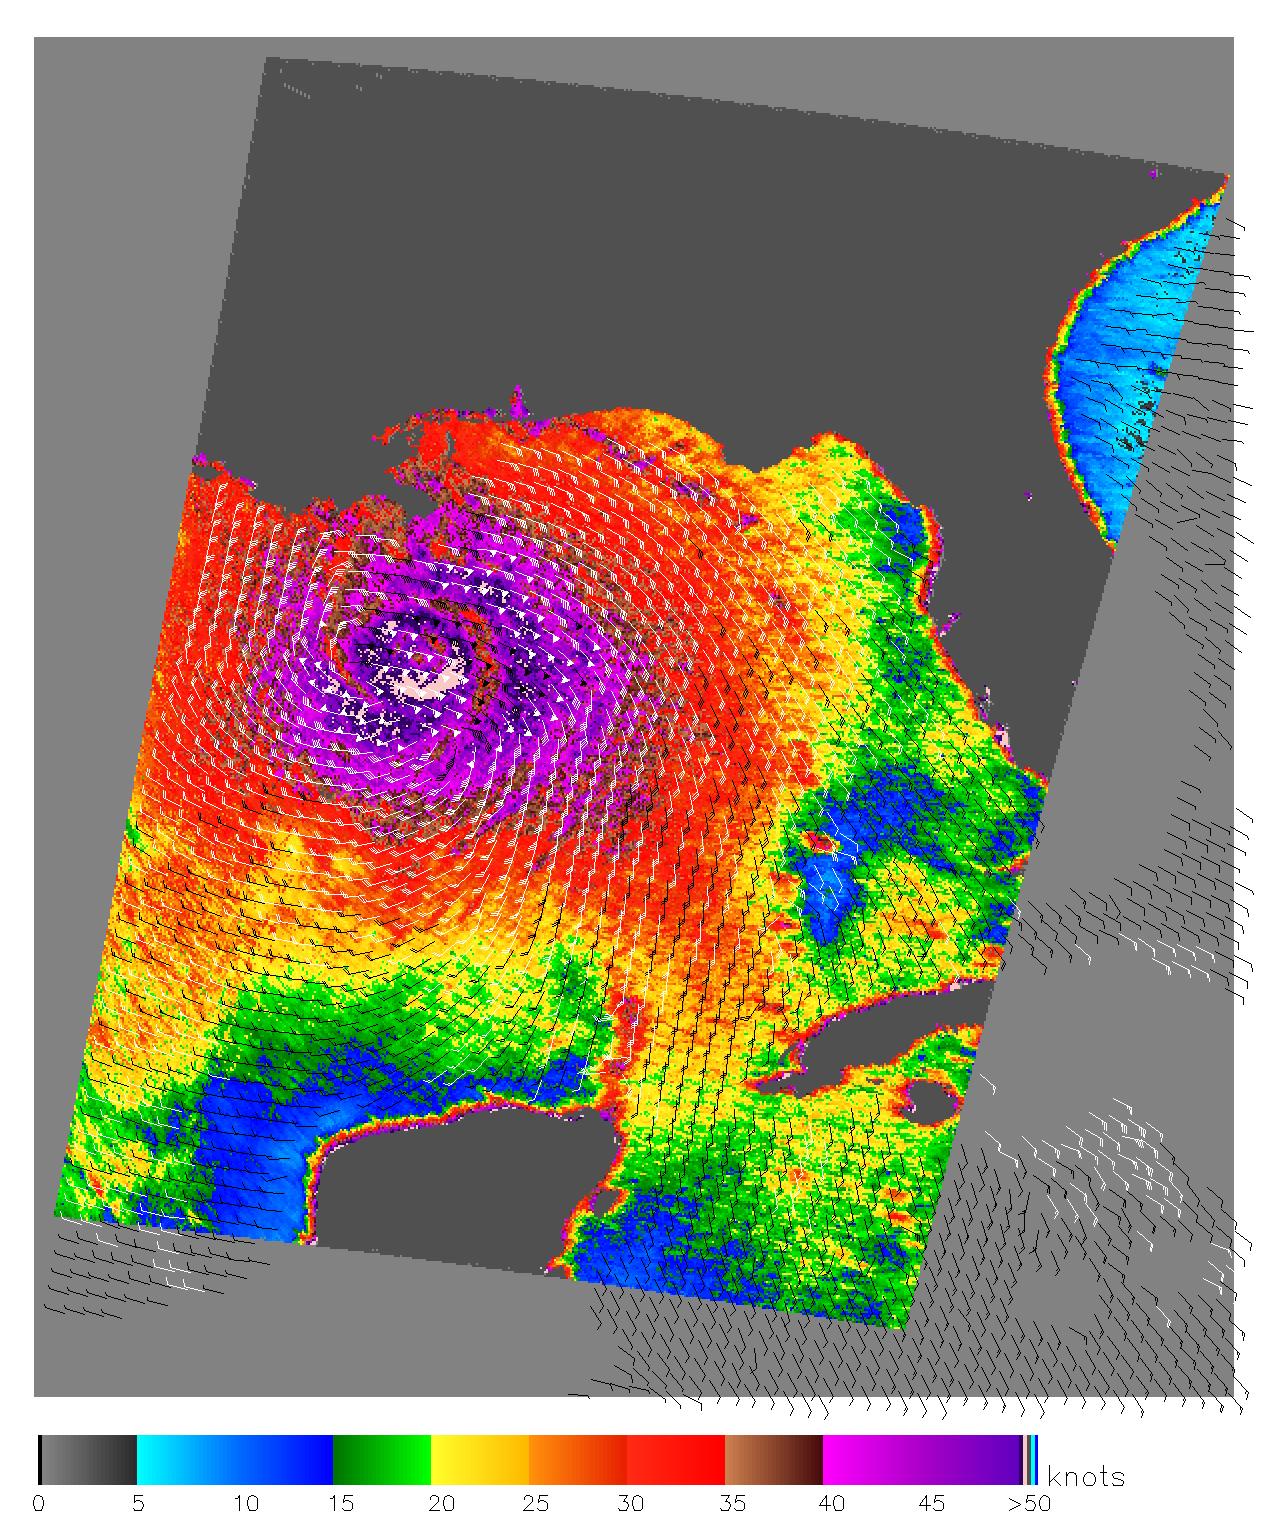
PIA07432:
-
Tropical Storm Katrina
Full Resolution:
TIFF
(1.939 MB)
JPEG
(229.8 kB)
|
|
|
2005-07-18 |
Earth
|
QuikScat
|
SeaWinds Scatterometer
|
1535x1575x3 |
|
-
PIA07969:
-
Hurricane Emily
Full Resolution:
TIFF
(7.266 MB)
JPEG
(561 kB)
|
|
|
2005-07-18 |
Earth
|
QuikScat
|
SeaWinds Scatterometer
|
1280x1440x3 |
|
-
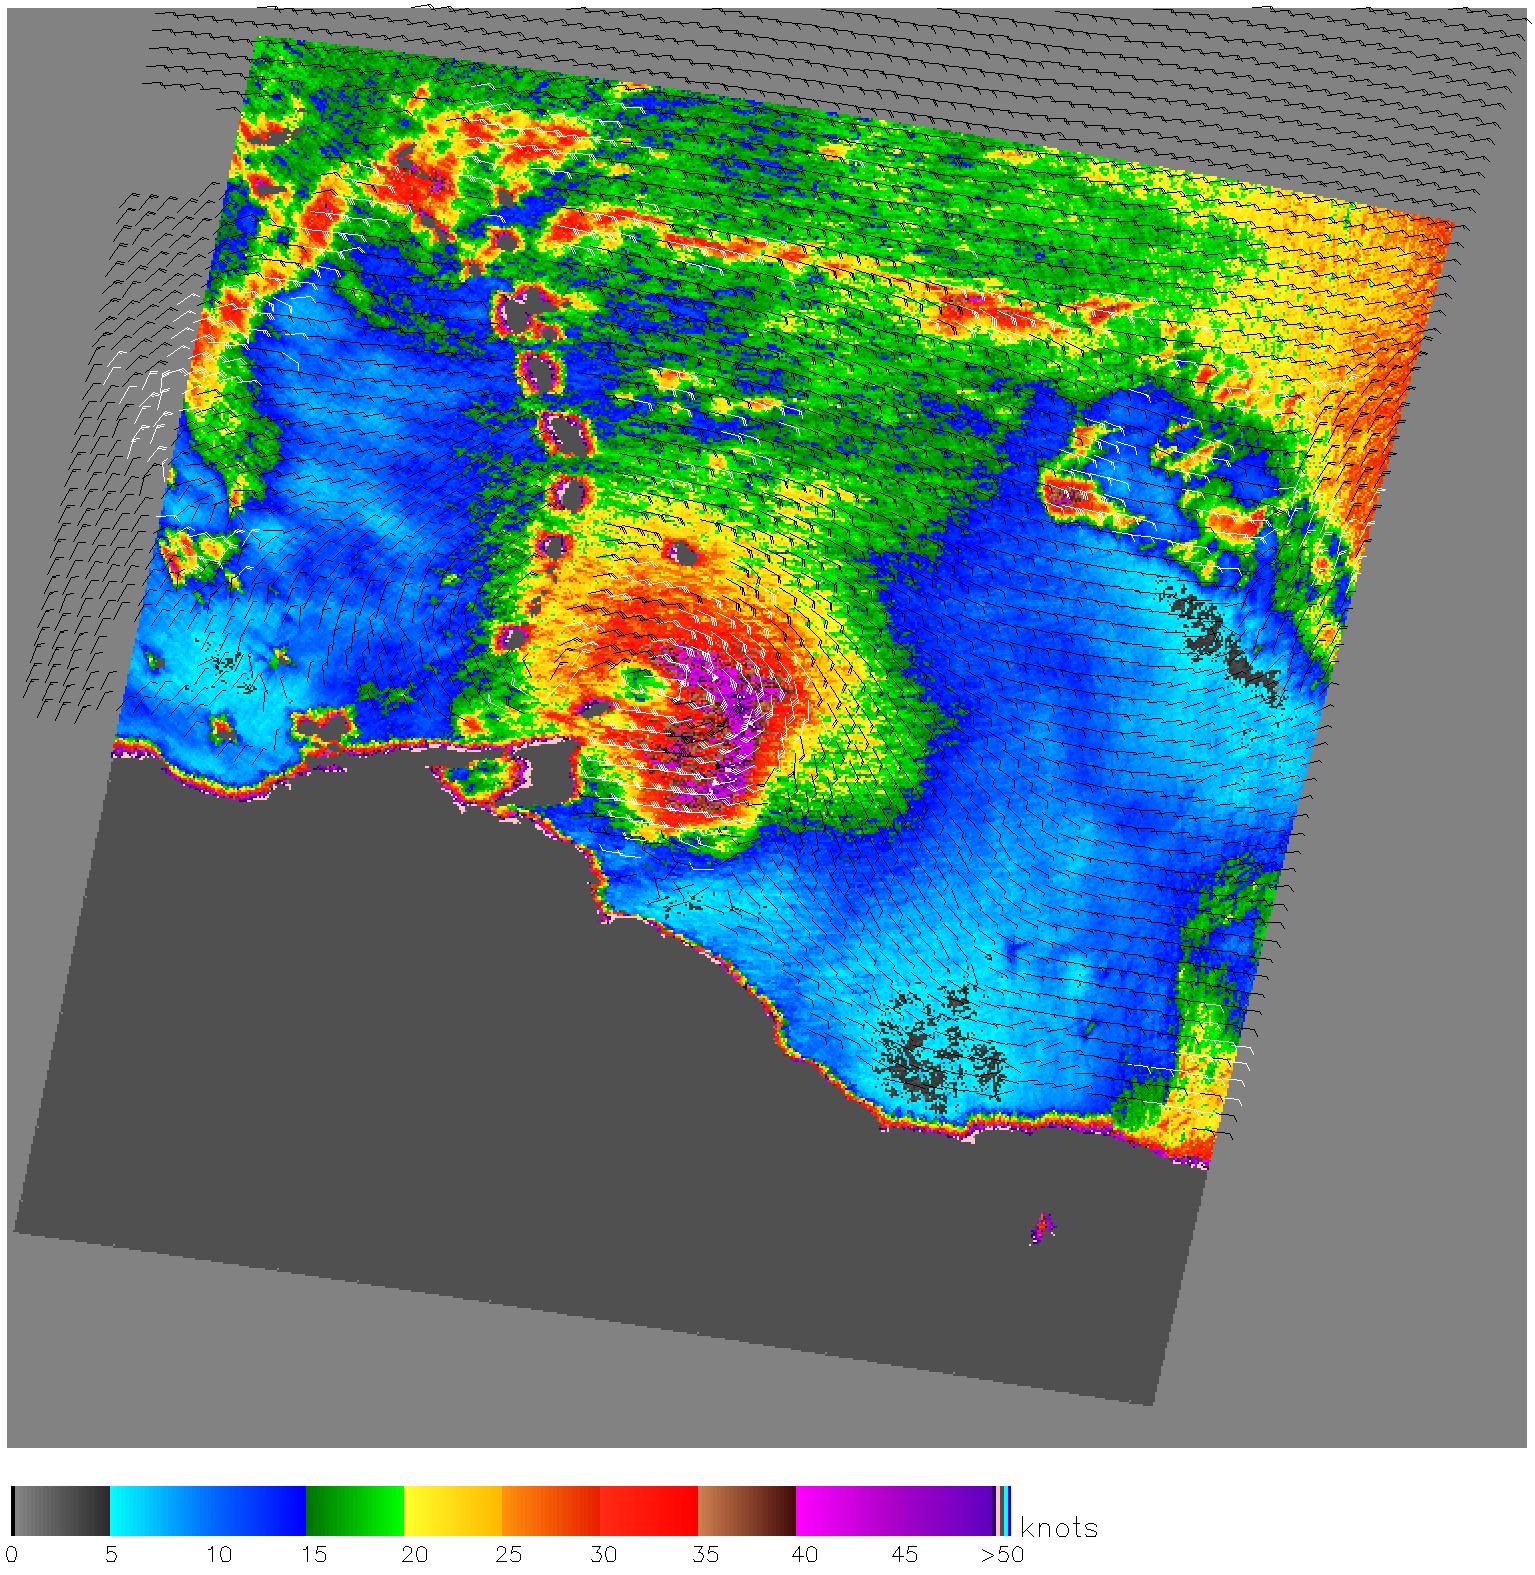
PIA07968:
-
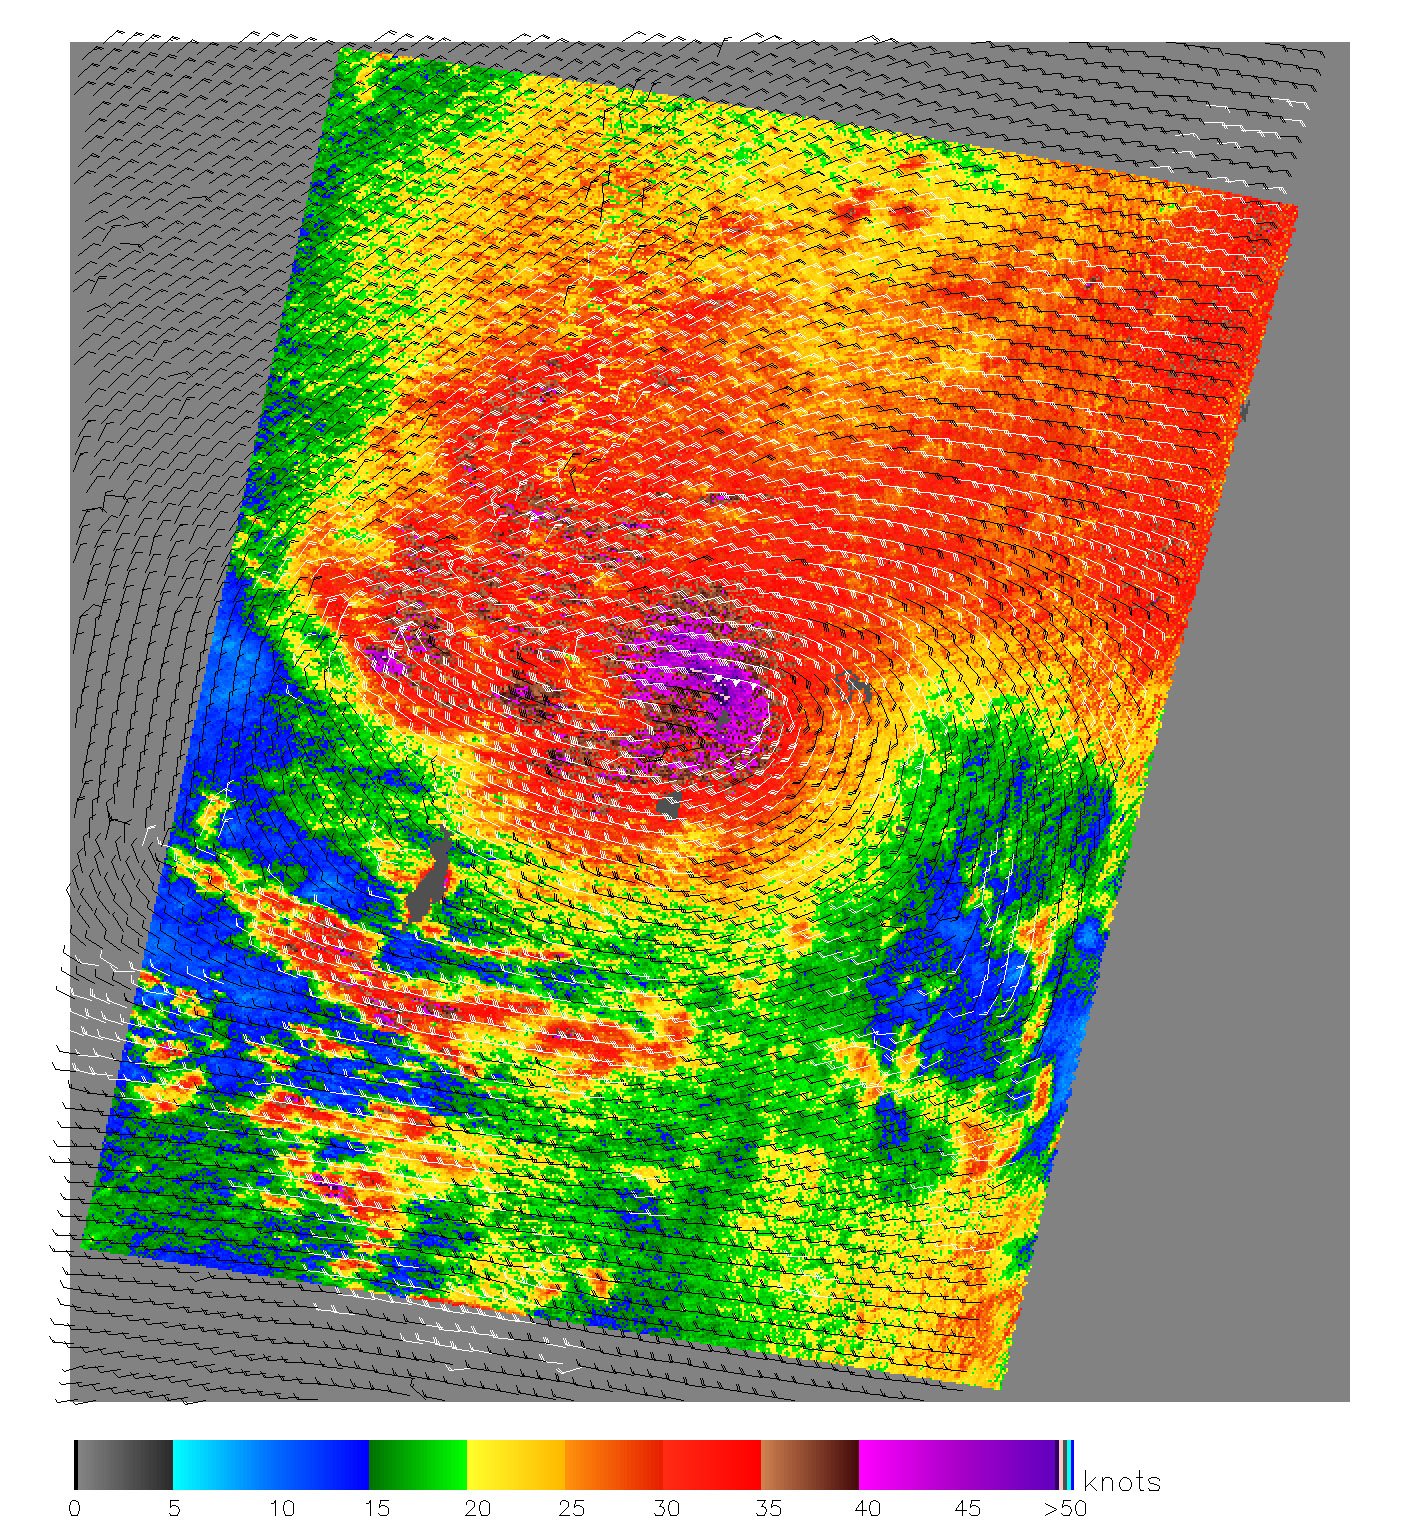
Super Typhoon Haitang
Full Resolution:
TIFF
(5.536 MB)
JPEG
(636.7 kB)
|
|
|
2005-03-03 |
Earth
|
QuikScat
|
SeaWinds Scatterometer
|
1456x1548x3 |
|
-
PIA07415:
-
Cyclones in the Pacific
Full Resolution:
TIFF
(4.757 MB)
JPEG
(792.9 kB)
|
|
|
2004-12-09 |
Earth
|
QuikScat
|
SeaWinds Scatterometer
|
1414x1540x3 |
|
-
PIA07100:
-
Typhoon Nanmadol
Full Resolution:
TIFF
(6.539 MB)
JPEG
(1.741 MB)
|
|
|
2003-01-13 |
Earth
|
QuikScat
|
SeaWinds Scatterometer
|
2490x1050x3 |
|
-
PIA03894:
-
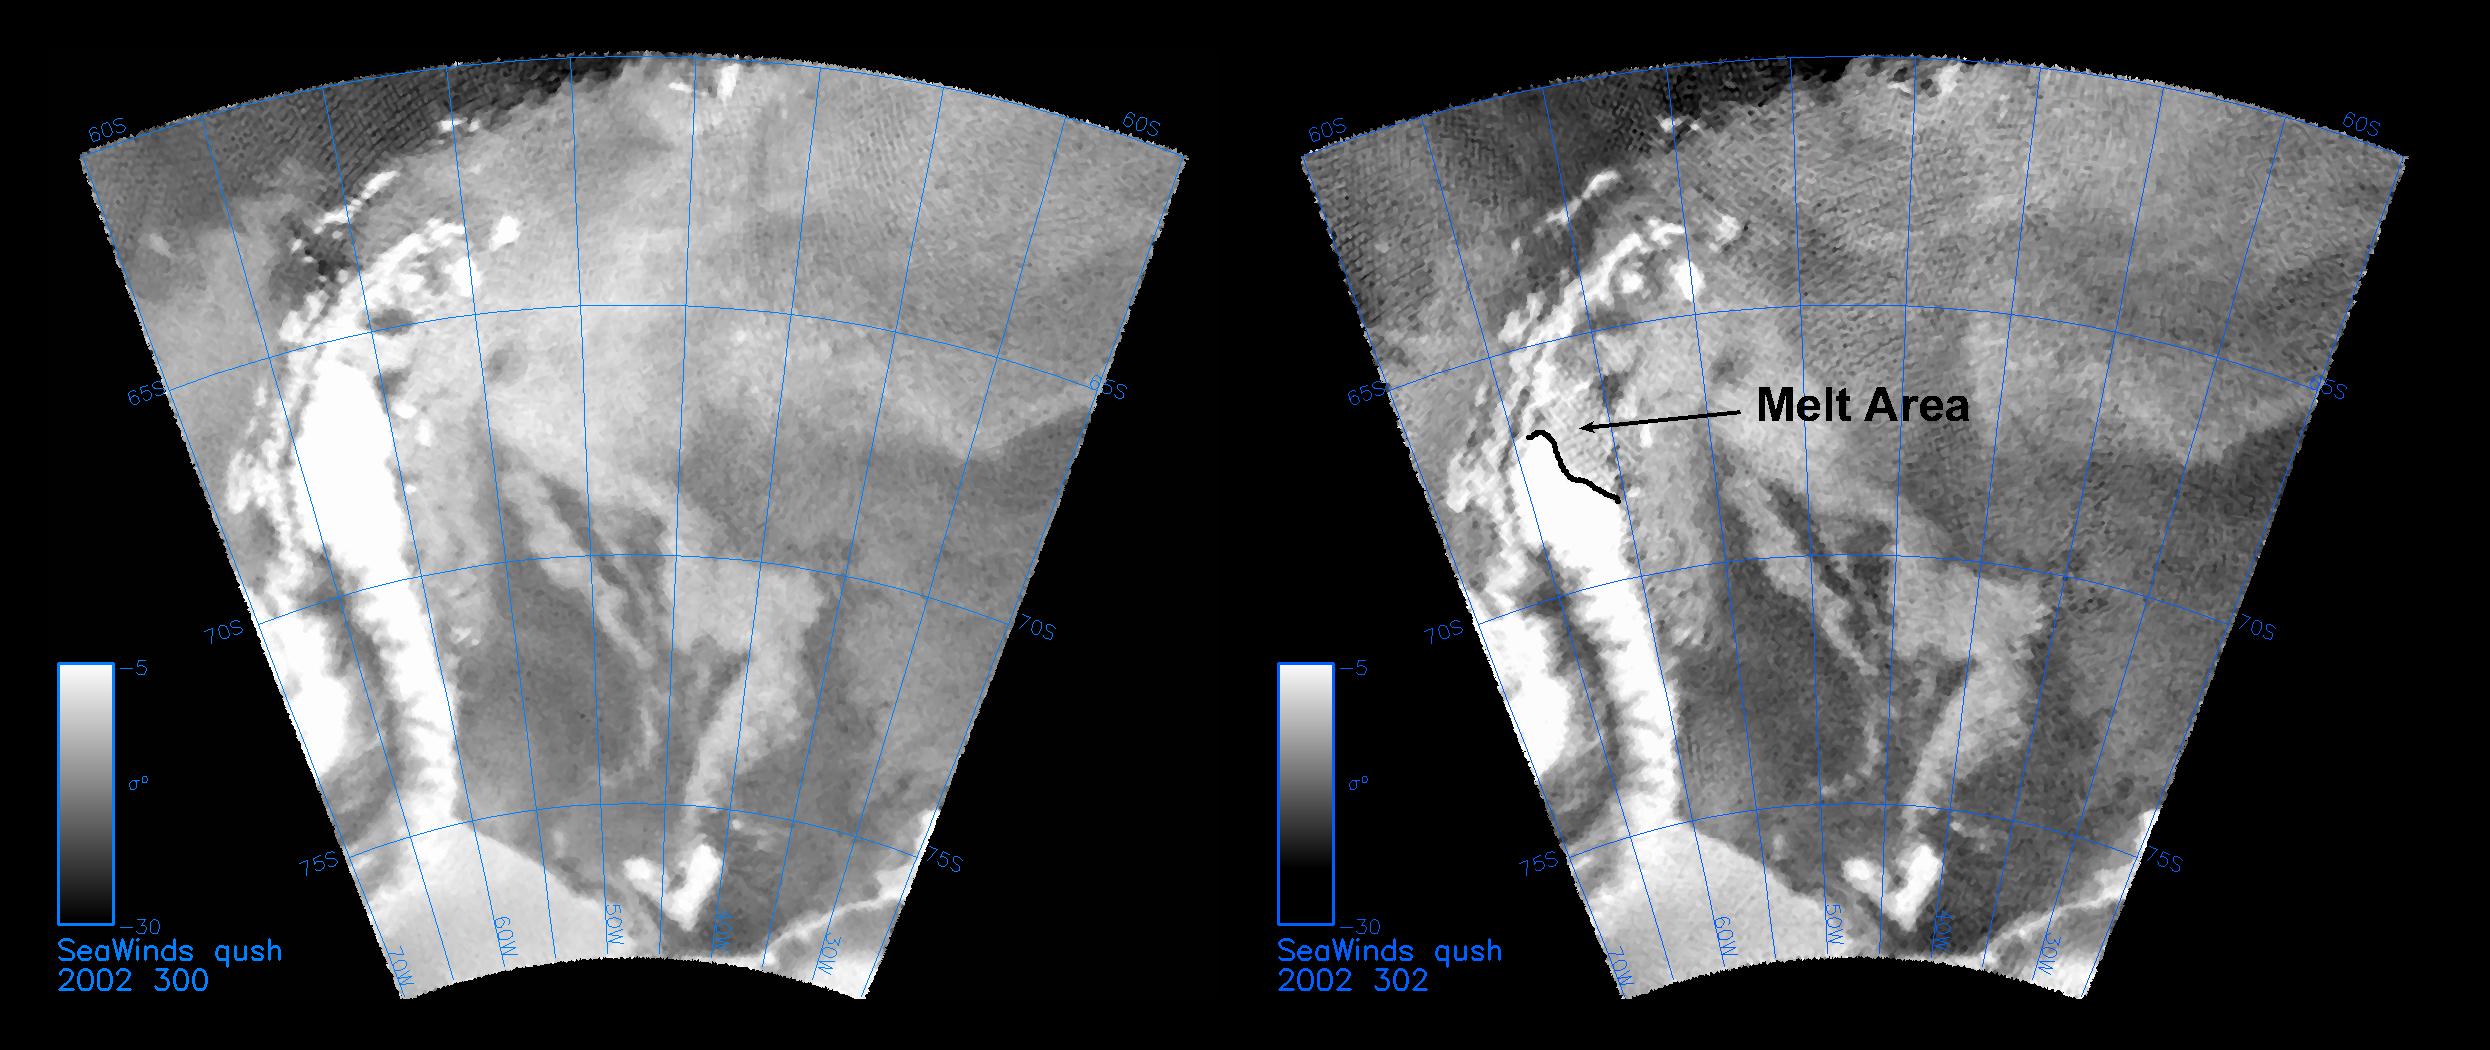
QuikScat Captures an Early Melt
Full Resolution:
TIFF
(2.168 MB)
JPEG
(289.1 kB)
|
|
|
2003-01-08 |
Earth
|
QuikScat
|
SeaWinds Scatterometer
|
800x667x3 |
|
-
PIA03892:
-
Santa Ana Winds Over Los Angeles
Full Resolution:
TIFF
(1.608 MB)
JPEG
(154.9 kB)
|
|
|
2002-07-05 |
Earth
|
QuikScat
|
SeaWinds Scatterometer
|
640x568x3 |
|
-
PIA01048:
-
Typhoon Bilis
Full Resolution:
TIFF
(166 kB)
JPEG
(122.5 kB)
|
|
|
2000-08-23 |
Earth
|
QuikScat
|
SeaWinds Scatterometer
|
640x565x3 |
|
-
PIA01047:
-
Typhoon Bilis
Full Resolution:
TIFF
(229 kB)
JPEG
(123.4 kB)
|
|
|
2000-05-08 |
Earth
|
QuikScat
|
SeaWinds Scatterometer
|
1452x1280x3 |
|
-
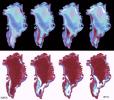
PIA02459:
-
SeaWinds - Greenland
Full Resolution:
TIFF
(765.6 kB)
JPEG
(205.7 kB)
|
|
|
2000-05-08 |
Earth
|
QuikScat
|
SeaWinds Scatterometer
|
2048x2048x3 |
|
-
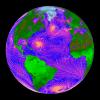
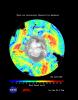
PIA02458:
-
SeaWinds - Oceans, Land, Polar Regions
Full Resolution:
TIFF
(934.2 kB)
JPEG
(679.2 kB)
|
|
|
2000-05-07 |
Earth
|
QuikScat
|
SeaWinds Scatterometer
|
2638x2201x3 |
|
-
PIA02457:
-
SeaWinds - South Georgia Island
Full Resolution:
TIFF
(1.029 MB)
JPEG
(1.018 MB)
|
|
|
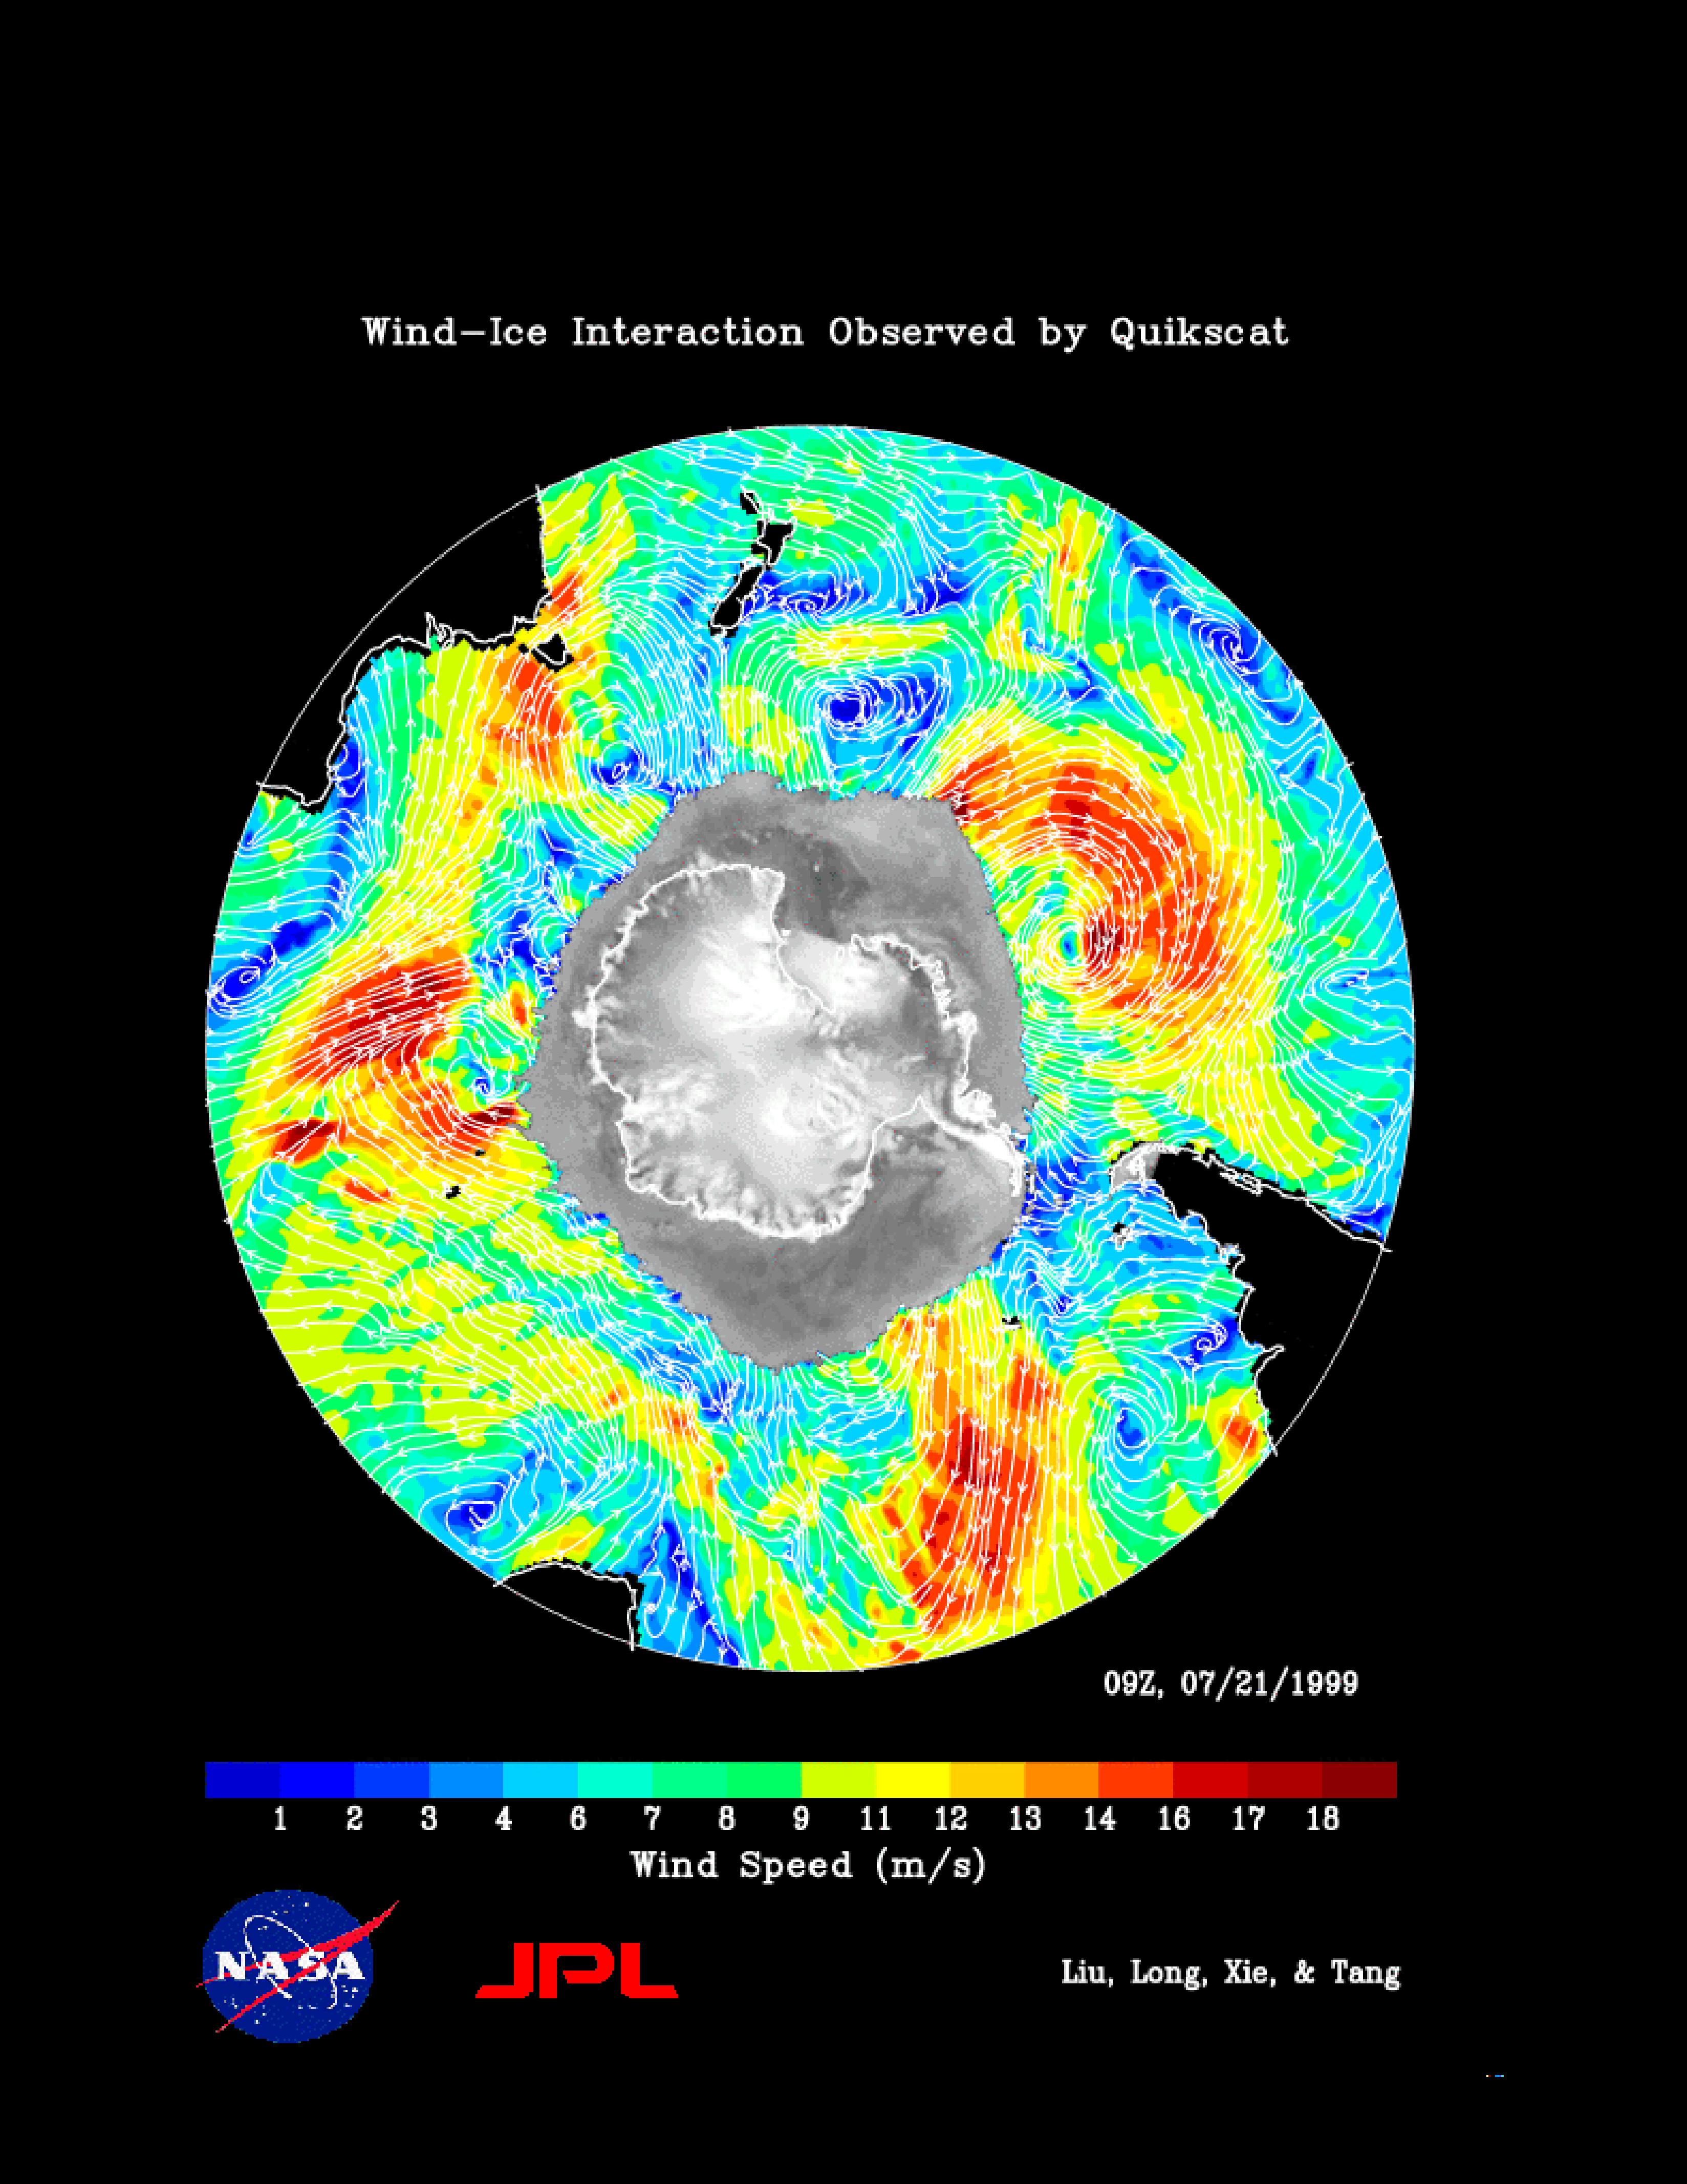
2000-05-07 |
Earth
|
QuikScat
|
SeaWinds Scatterometer
|
3296x4267x3 |
|
-
PIA02456:
-
SeaWinds Wind-Ice Interaction
Full Resolution:
TIFF
(1.974 MB)
JPEG
(1.274 MB)
|
|
|
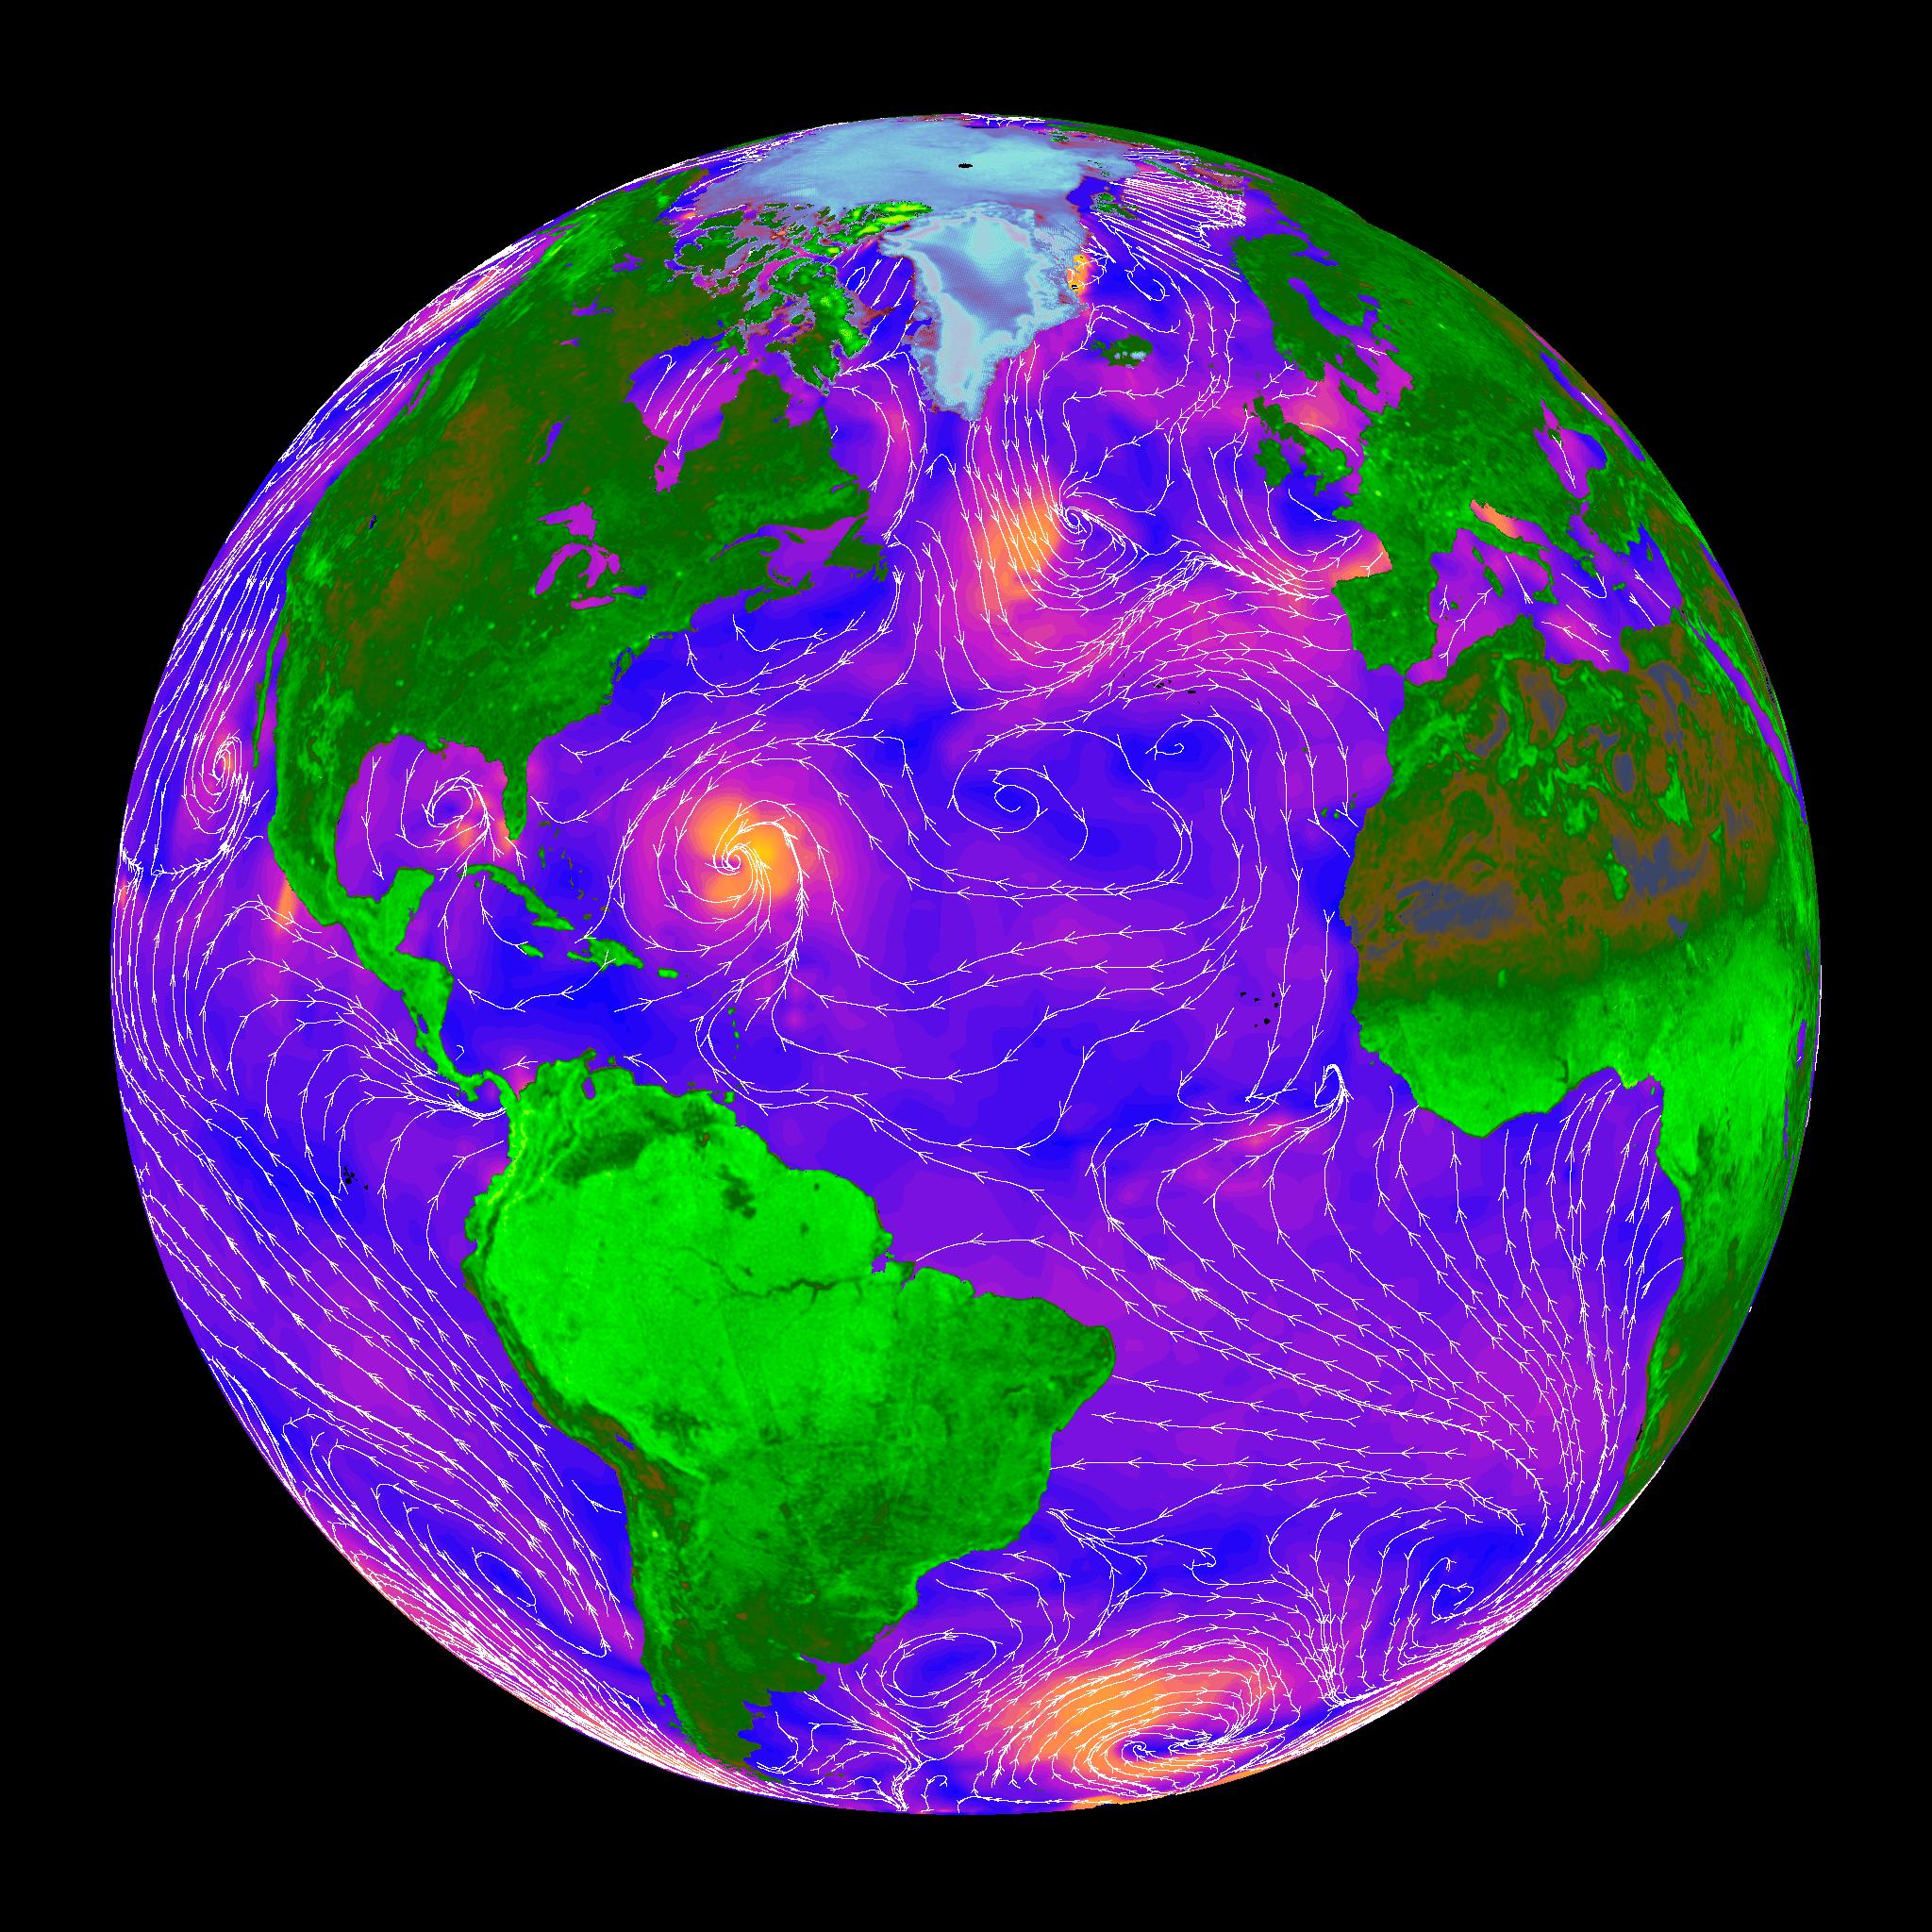
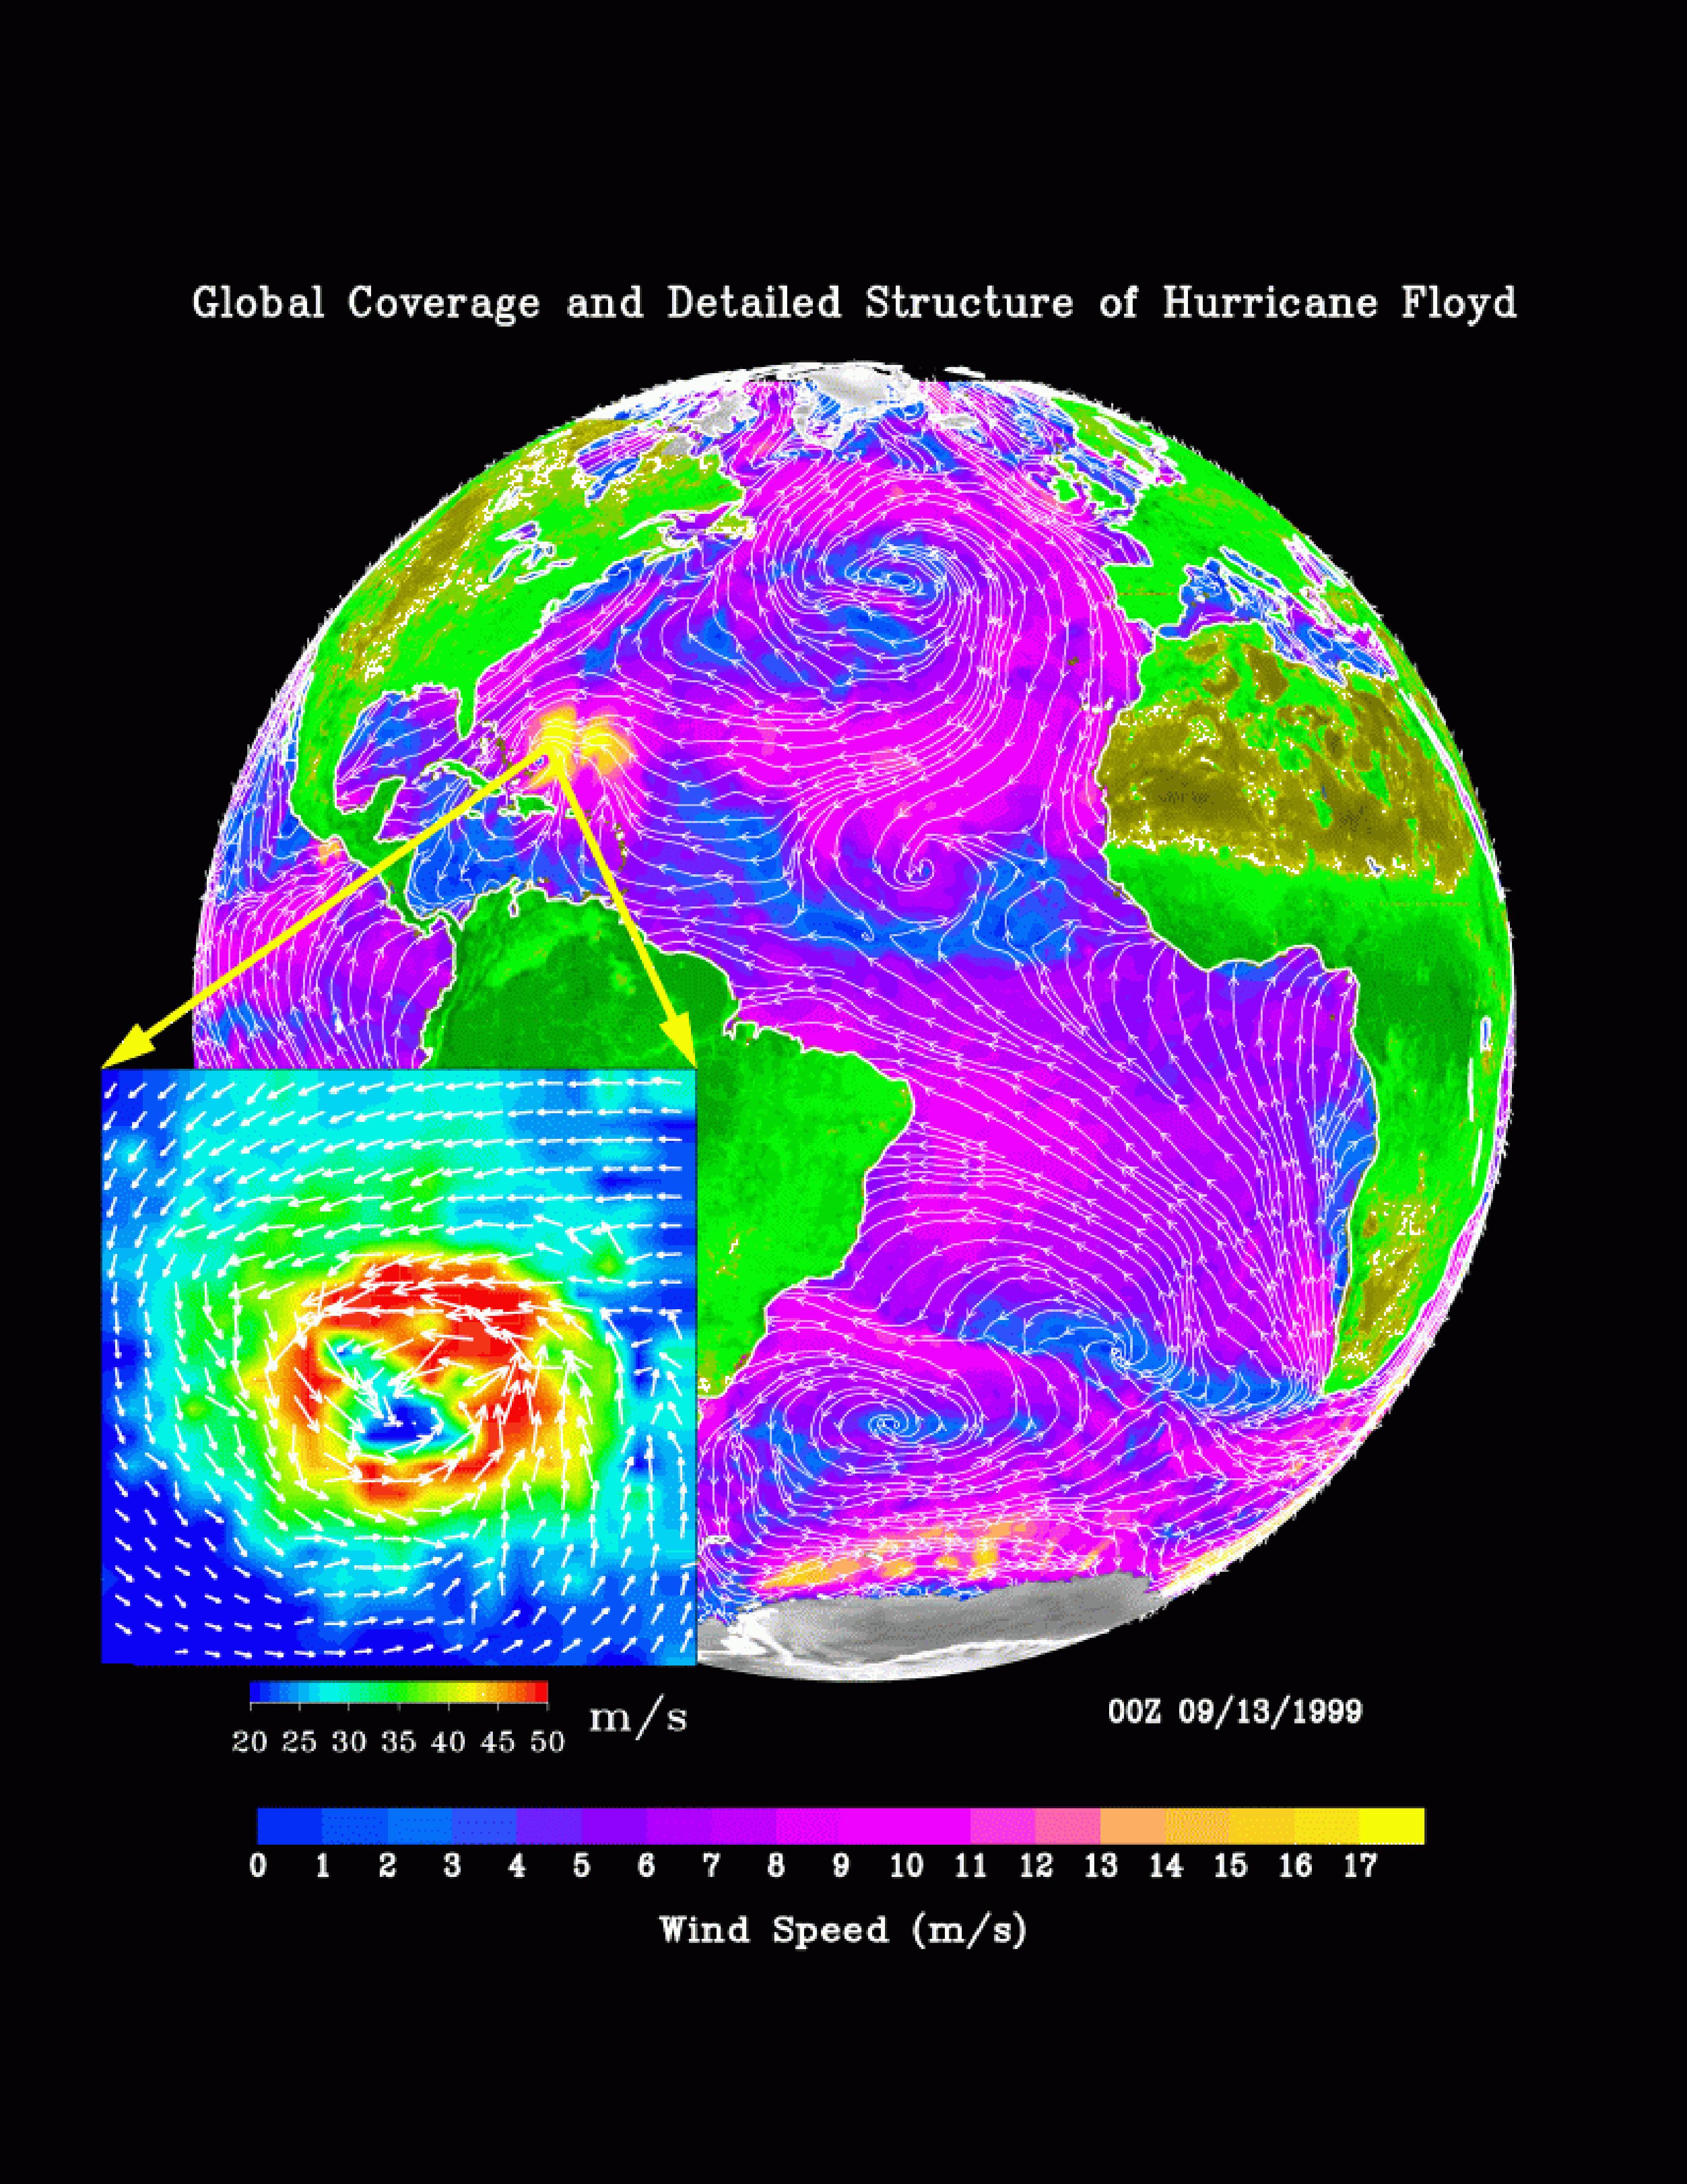
2000-05-07 |
Earth
|
QuikScat
|
SeaWinds Scatterometer
|
3296x4267x3 |

|
-
PIA02455:
-
SeaWinds Global Coverage with Detail of Hurricane Floyd
Full Resolution:
TIFF
(1.921 MB)
JPEG
(1.595 MB)
|
|
|
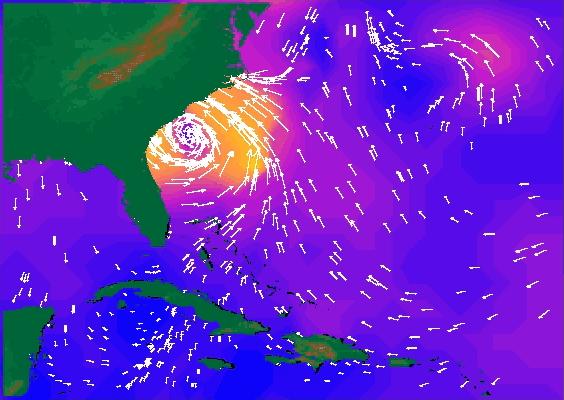
1999-09-16 |
Earth
|
QuikScat
|
SeaWinds Scatterometer
|
564x400x3 |
|
-
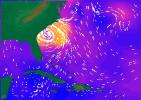
PIA02334:
-
SeaWinds Radar Stares Into The Eye Of Angry Hurricane Floyd
Full Resolution:
TIFF
(192.6 kB)
JPEG
(44.92 kB)
|
|
|
1999-09-08 |
Earth
|
QuikScat
|
SeaWinds Scatterometer
|
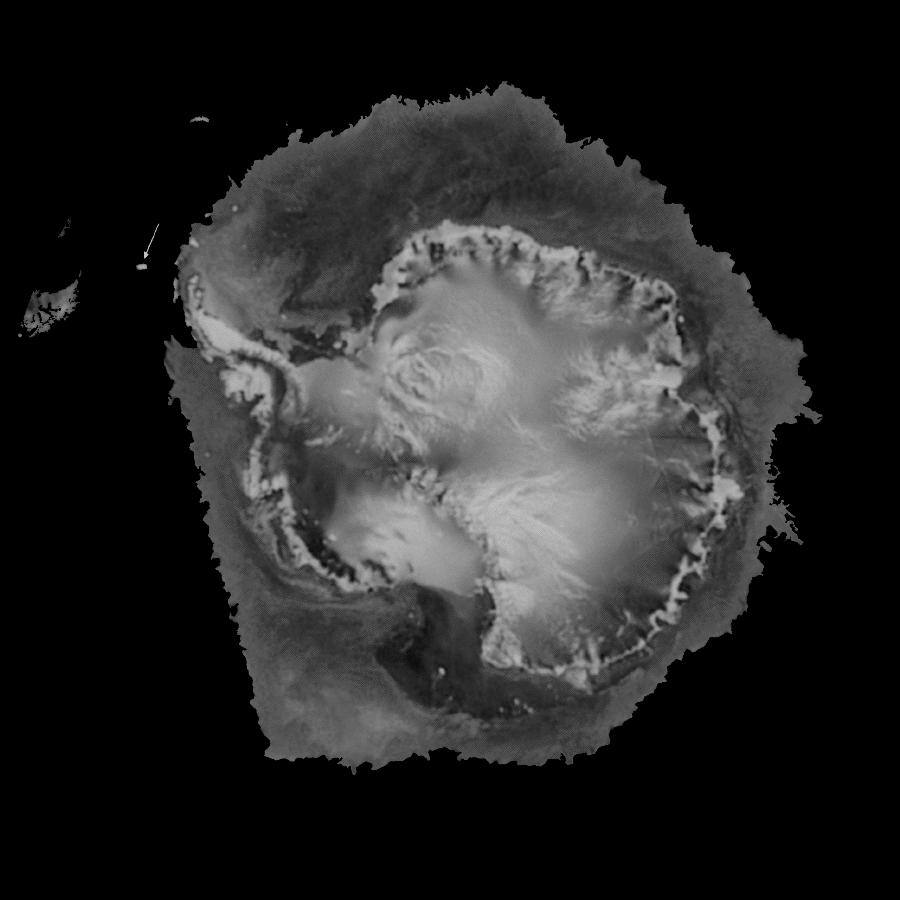
900x900x1 |
|
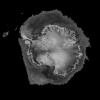
-
PIA02329:
-
SeaWinds Watches for Breakup of Giant Iceberg
Full Resolution:
TIFF
(132.8 kB)
JPEG
(49.24 kB)
|
|
|
1999-08-25 |
Earth
|
QuikScat
|
SeaWinds Scatterometer
|
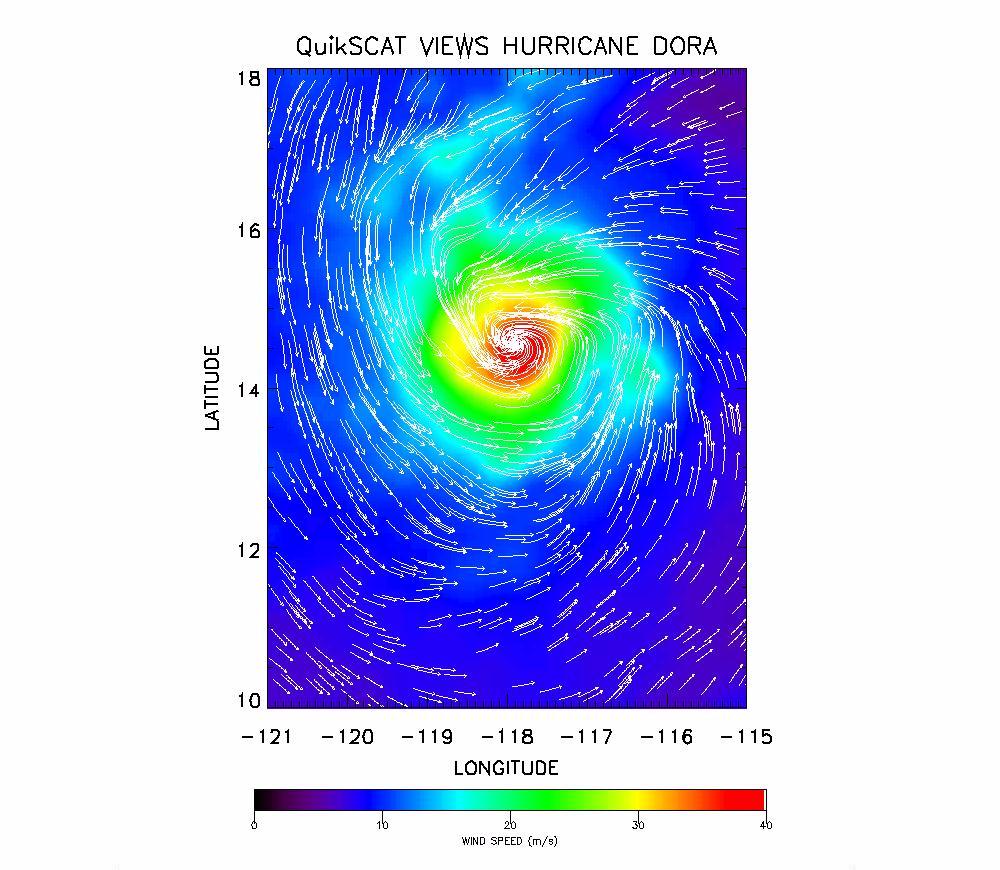
1000x870x3 |

|
-
PIA02404:
-
SeaWinds Radar Clocks Hurricane Dora's Wind Speeds
Full Resolution:
TIFF
(1.118 MB)
JPEG
(142.8 kB)
|
|
|
1999-08-09 |
Earth
|
QuikScat
|
SeaWinds Scatterometer
|
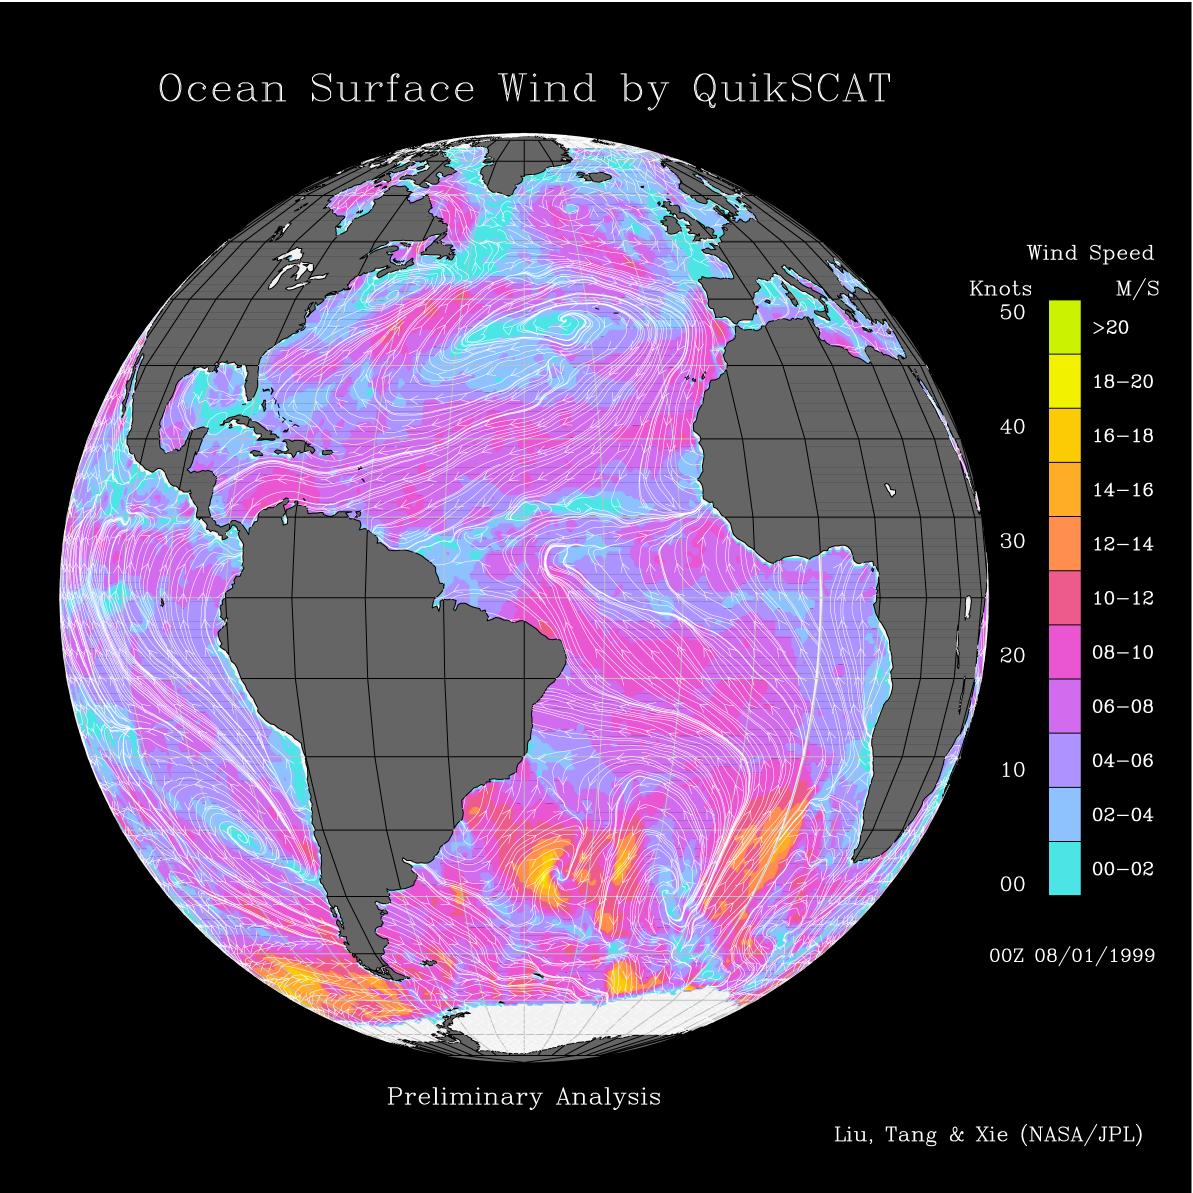
1193x1193x3 |
|
-
PIA01347:
-
Atlantic Ocean Surface Winds from QuikScat
Full Resolution:
TIFF
(1.065 MB)
JPEG
(237.9 kB)
|
|
|
1999-08-09 |
Earth
|
QuikScat
|
SeaWinds Scatterometer
|
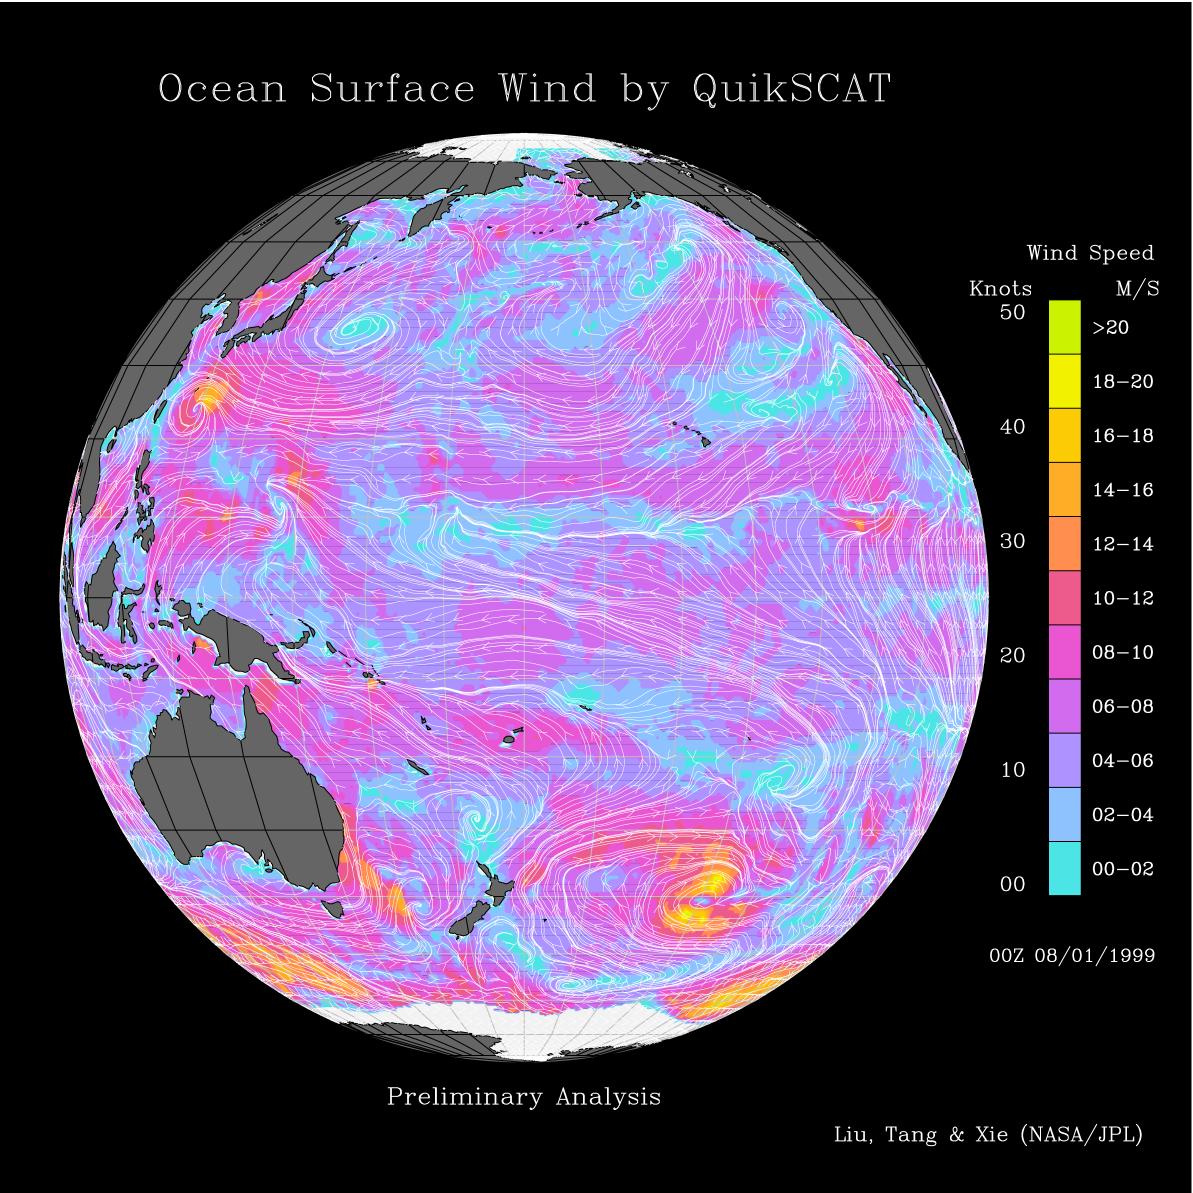
1193x1193x3 |
|
-
PIA01346:
-
Pacific Ocean Surface Winds from QuikScat
Full Resolution:
TIFF
(1.208 MB)
JPEG
(258.1 kB)
|
 Planetary Data System


