The frequent coverage provided by NASA's SeaWinds instrument on the QuikScat satellite provides unprecedented capability to monitor daily and seasonal changes in the key melt zones of Greenland, which is covered with a thick ice sheet that resulted from snow accumulating over tens of thousands of years. The thickness of the snow layers reveals details about the past global climate, and comparing snow accumulation and snow melting can provide insight into climate change and global warming. In particular, the extent of summer melting of snow in Greenland is considered a sensitive indicator of global change.
Earlier scatterometer data has suggested that Greenland has experienced significantly more melting in recent years. This figure compares the melting observed over 15 days during July 1999 in Greenland. The red areas around the central blue and white areas are the main melt zones and have lower radar back scatter because of water on the surface that saturates the surface snow. As the days warm up, the melt extent dramatically increases. Comparing this data with computer models and past scatterometer data will help scientists evaluate the inter-annual variability of the melting as a step toward understanding potential climate change.
The world's large ice sheets in Greenland and Antarctica act as vast storehouses of freshwater. Summer season melting releases large quantities of freshwater into the ocean, and year-to-year variations can have a significant impact on global sea level. Furthermore, long-term changes in the patterns and extent of melting on the large ice sheets reflect the effects of climate variability; thus Greenland is considered a sensitive indicator of global warming.
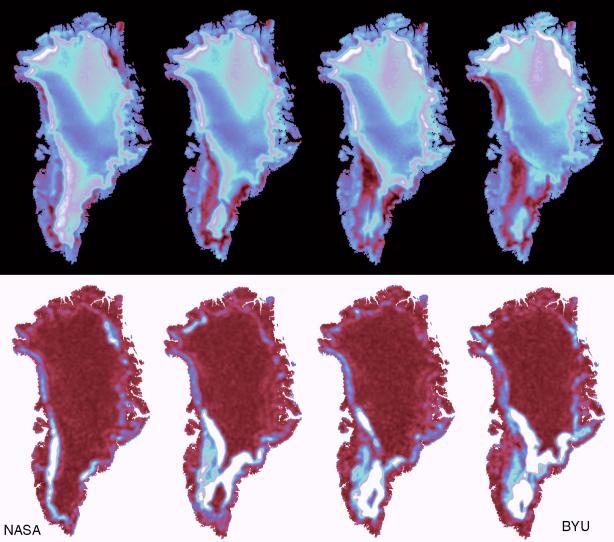
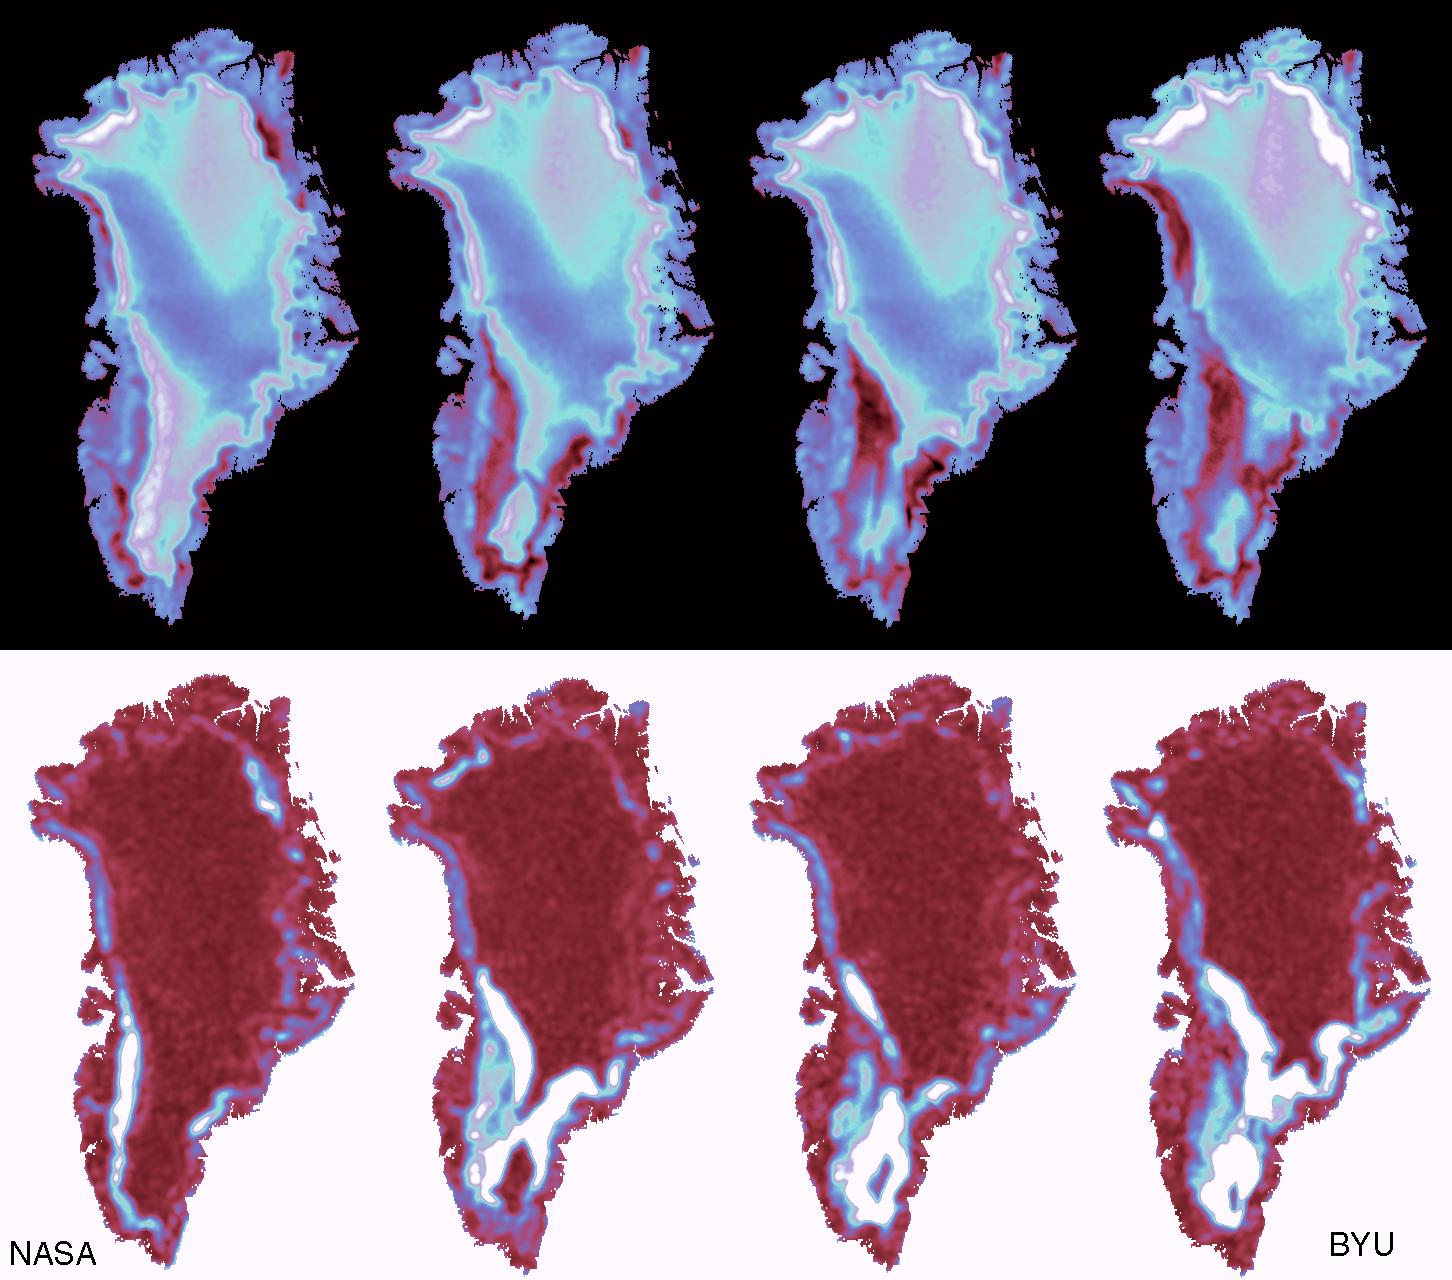
Satellite microwave radars are extremely sensitive to melting and can provide the only effective means of accurately measuring the year-round picture of the extent and variability in ice sheet melting. Daily mean images were produced from QuikScat data collected over the Greenland ice sheet at the height of the present summer melt period. In the top row, four images are shown at intervals of 5 days, for (a) day 203, (b) 208,(c) 213, and (d) 218 in 1999. Blue and white colors indicate surfaces which are cold and dry, while read and black indicate wet snow surfaces experiencing melting. The coastal regions are lower in elevation and begin to melt first. As summer progresses, the area of melting expands inland and northwards along the western coast of Greenland as air temperatures warm. A large pale and dark blue region in the central, high-elevation part of the ice sheet survives each summer without experiencing any melting. This is known as the dry snow region, and its area is a measure of the stability of the central part of the ice sheet. The line dividing the melt area and the dry snow is very sensitive to climate conditions and monitoring this line will help scientists determine whether the Earth's climate is changing.
The lower series of four images shows the daily variability in the radar data within each image. White patches in these images identify regions where the most rapid changes are taking place. Air temperature and precipitation variations are responsible for the patterns, with the greatest impact over the southern tip of Greenland occurring from storms originating over the Atlantic. Note that the red areas of central and northern Greenland experience much smaller or slower changes, with the central ice sheet showing little change during this summer period.
With its frequent coverage, the SeaWinds instrument is a power and unique tool for monitoring the health of the large ice sheets. The continuing time-series of data is a valuable contribution to assessments of the effects and impact of global change in the polar regions.
NASA's Earth Science Enterprise is a long-term research and technology program designed to examine Earth's land, oceans, atmosphere, ice and life as a total integrated system. JPL is a division of the California Institute of Technology, Pasadena, CA.
 Planetary Data System


