A ferry carrying more than 600 passengers sank in the Java Sea between the island of Java and Borneo just before midnight on December 29, 2006, during high winds and rough seas. On January 1, 2007, a plane carrying more than 100 people crashed on its flight over the Java Sea; high winds and turbulent weather are being investigated as possible causes. The origin of surges of deadly winds in this usually relatively calm region is poorly monitored and understood. However, ocean winds data from NASA's QuikScat satellite show potential for helping alleviate such deficiencies.
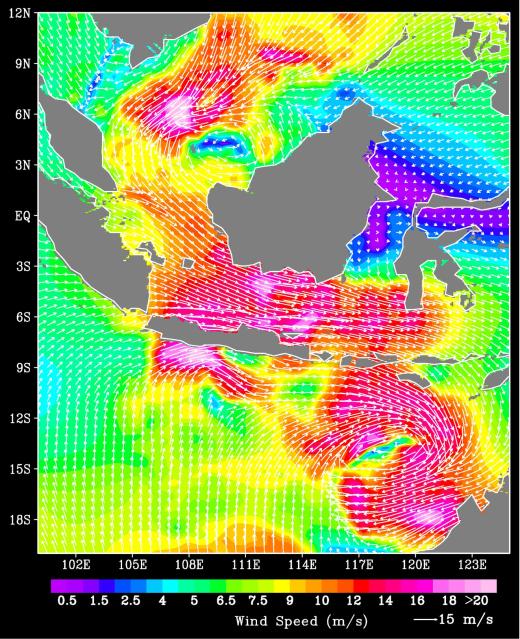
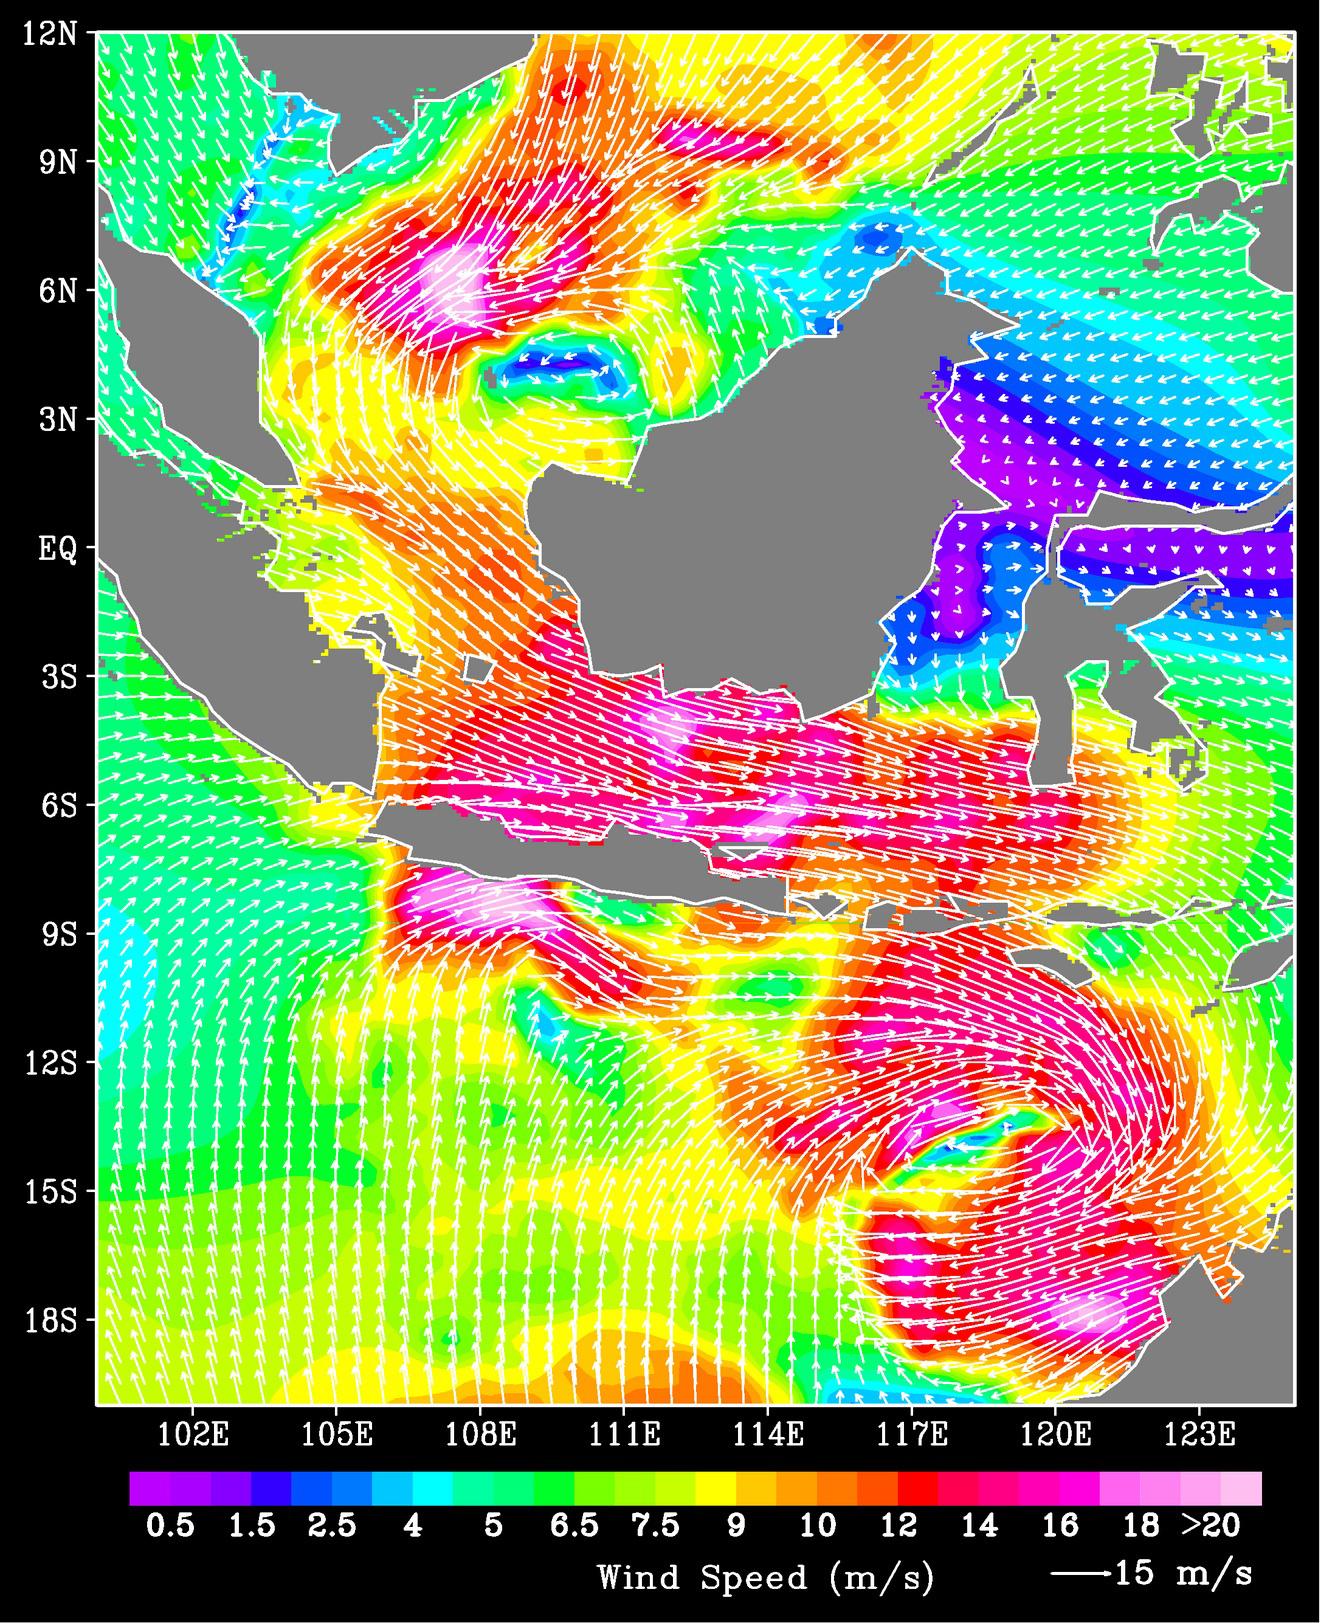
Data obtained from QuikScat on December 30 and January 1 shed new insights into the atmospheric conditions at the time of these incidents. QuikScat data are available in near real time to operational weather forecasting agencies around the world. The data from December 30 and January 1 observed that the strong winds in the Java Sea originated from the surge of a strong winter monsoon from the Asian continent. The monsoon winds blew south across the South China Sea and deflected eastward after they crossed the equator due to the rotation of Earth. The winds strengthened as they were channeled through the land masses of Indonesia. The winds in the Java Sea remained strong through January 1, 2007. Associated with the eastward winds, twin cyclones (a counter-clockwise circulation in the Northern Hemisphere and a clockwise circulation in the Southern Hemisphere) were also observed by QuikScat; the stronger one was south of the equator (summer hemisphere) between Java and Australia, and a weaker one was north of the equator (winter hemisphere) west of Borneo. In this image from January 1, the different colors denote different wind speeds. White arrows are wind vectors showing both direction and speed.
The large-scale, broad and simultaneous observations by QuikScat make it possible to put the local weather into the context of the large-scale circulation, and confirm one of the assumptions that links the cold surge of the Asian monsoon with tropical cyclones in the western Pacific.
QuikScat, managed by JPL, measures ocean surface wind/stress by sending radar pulses to the surface and measuring the strength of the signals returned.
QuikScat Background
NASA's Quick Scatterometer (QuikScat) spacecraft was launched from Vandenberg Air Force Base, California on June 19, 1999. QuikScat carriesthe SeaWinds scatterometer, a specialized microwave radar that measures near-surface wind speed and direction under all weather and cloud conditions over the Earth's oceans. More information about the QuikScat mission and observations is available at http://winds.jpl.nasa.gov. QuikScat is managed for NASA's Science Mission Directorate, Washington, DC, by NASA's Jet Propulsion Laboratory, Pasadena, CA. JPL also built the SeaWinds radar instrument and is providing ground science processing systems. NASA's Goddard Space Flight Center, Greenbelt, MD, managed development of the satellite, designed and built by Ball Aerospace & Technologies Corp., Boulder, CO. The National Oceanic and Atmospheric Administration has contributed support to ground systems processing and related activities.
 Planetary Data System


