PDS logoPlanetary Data System
PDS Information
Find a Node - Use these links to navigate to any of the 8 publicly accessible PDS Nodes.

This bar indicates that you are within the PDS enterprise which includes 6 science discipline nodes and 2 support nodes which are overseen by the Project Management Office at NASA's Goddard Space Flight Center (GSFC). Each node is led by an expert in the subject discipline, supported by an advisory group of other practitioners of that discipline, and subject to selection and approval under a regular NASA Research Announcement.
Click here to return to the Photojournal Home Page Click here to view a list of Photojournal Image Galleries Photojournal_inner_header
Latest Images  |  Spacecraft & Technology  |  Animations  |  Space Images App  |  Feedback  |  Photojournal Search  
Your search criteria found 4 images
Instrument
Go to PIAxxxxx:
Refine this list of images by:
Spacecraft:
Click on an image for detailed information
Click on a column heading to sort in ascending or descending order
My
List
Addition DateSort Ascending Target Mission Instrument Size
Add Image to Favorite List 2025-02-10 Earth InSAR
1440x1800x3
Researchers from NASA's Jet Propulsion Laboratory and the National Oceanic and Atmospheric Administration (NOAA) analyzed vertical land motion along the California coast between 2015 and 2023. They detailed where land is sinking.
PIA25530:
Map of California Subsidence and Uplift
Full Resolution:     TIFF (3.216 MB)     JPEG (222.6 kB)
Add Image to Favorite List 2023-09-27 Earth InSAR
1584x934x3
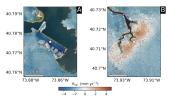
The team pinpointed hot spots: runway 13/31 at LaGuardia Airport in Queens, is subsiding at a rate of about 0.15 inches per year; part of Newtown Creek, a Superfund site in East Williamsburg, Brooklyn, is rising unevenly by about 0.06 inches per year.
PIA25528:
Hot Spots of Subsidence, Uplift in New York City
Full Resolution:     TIFF (2.374 MB)     JPEG (173.7 kB)
Add Image to Favorite List 2023-09-27 Earth InSAR
2036x1446x3
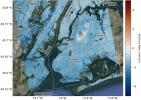
Mapping vertical land motion across the New York City area, researchers found the land sinking by about 0.06 inches (1.6 millimeters) per year on average. They also detected modest uplift in Queens and Brooklyn.
PIA25527:
Map of New York City Subsidence and Uplift
Full Resolution:     TIFF (7.442 MB)     JPEG (516.4 kB)
Add Image to Favorite List 2012-10-01 Earth Terra
ASTER
InSAR
1024x575x3
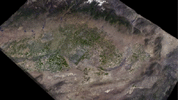
This still from an animation shows, in exaggerated terms, how the surface of the southern Central Valley of California deformed from the period 2007 to 2011.
PIA16293:
InSAR Measurements of Subsidence in California's Central Valley (June 2007--December 2010) Animation Icon
Full Resolution:     TIFF (1.767 MB)     JPEG (81.67 kB)
Currently displaying images: 1 - 4 of 4