My
List |
Addition Date
|
Target
|
Mission
|
Instrument
|
Size
|

|
2003-12-08 |
Mars
|
2001 Mars Odyssey
|
Gamma Ray Spectrometer Suite
|
1850x2272x3 |
|
-
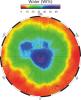
PIA04908:
-
North Polar Water Ice by Weight
Full Resolution:
TIFF
(5.945 MB)
JPEG
(318.1 kB)
|
|
|
2003-12-08 |
Mars
|
2001 Mars Odyssey
|
Gamma Ray Spectrometer Suite
|
1134x756x3 |
|
-
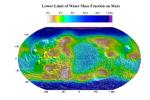
PIA04907:
-
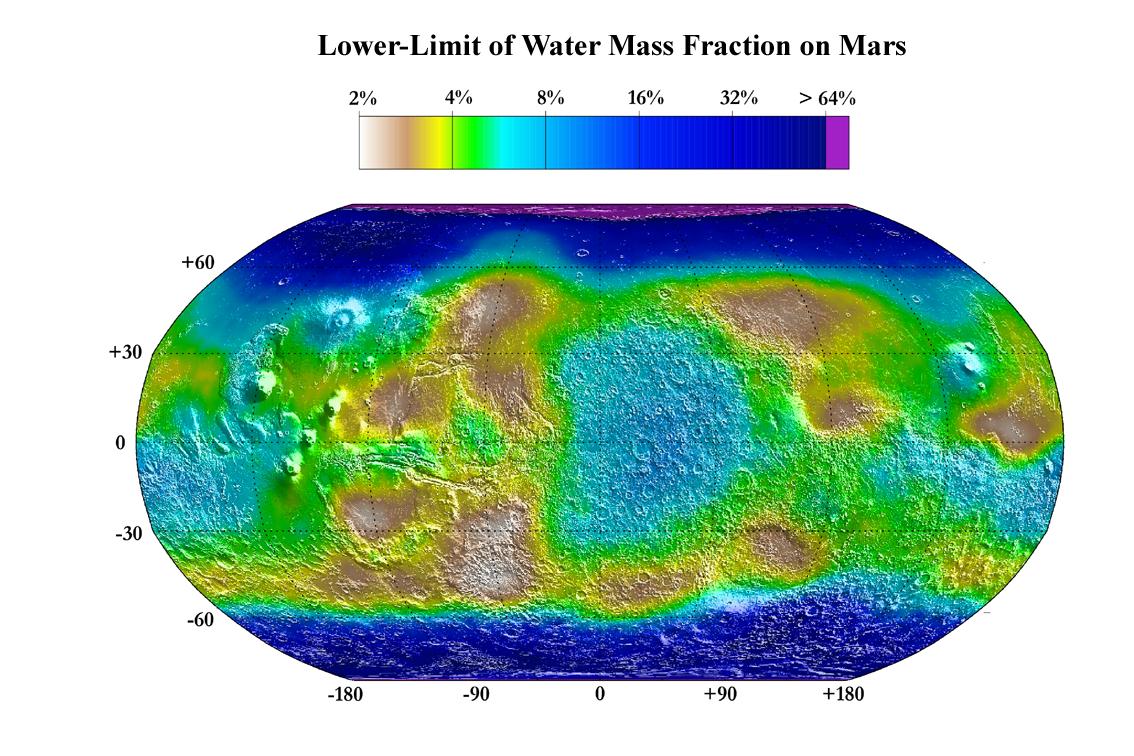
Water Mass Map from Neutron Spectrometer
Full Resolution:
TIFF
(1.486 MB)
JPEG
(165.4 kB)
|
|
|
2003-06-30 |
Mars
|
2001 Mars Odyssey
|
Gamma Ray Spectrometer Suite
|
2560x1918x3 |

|
-
PIA04596:
-
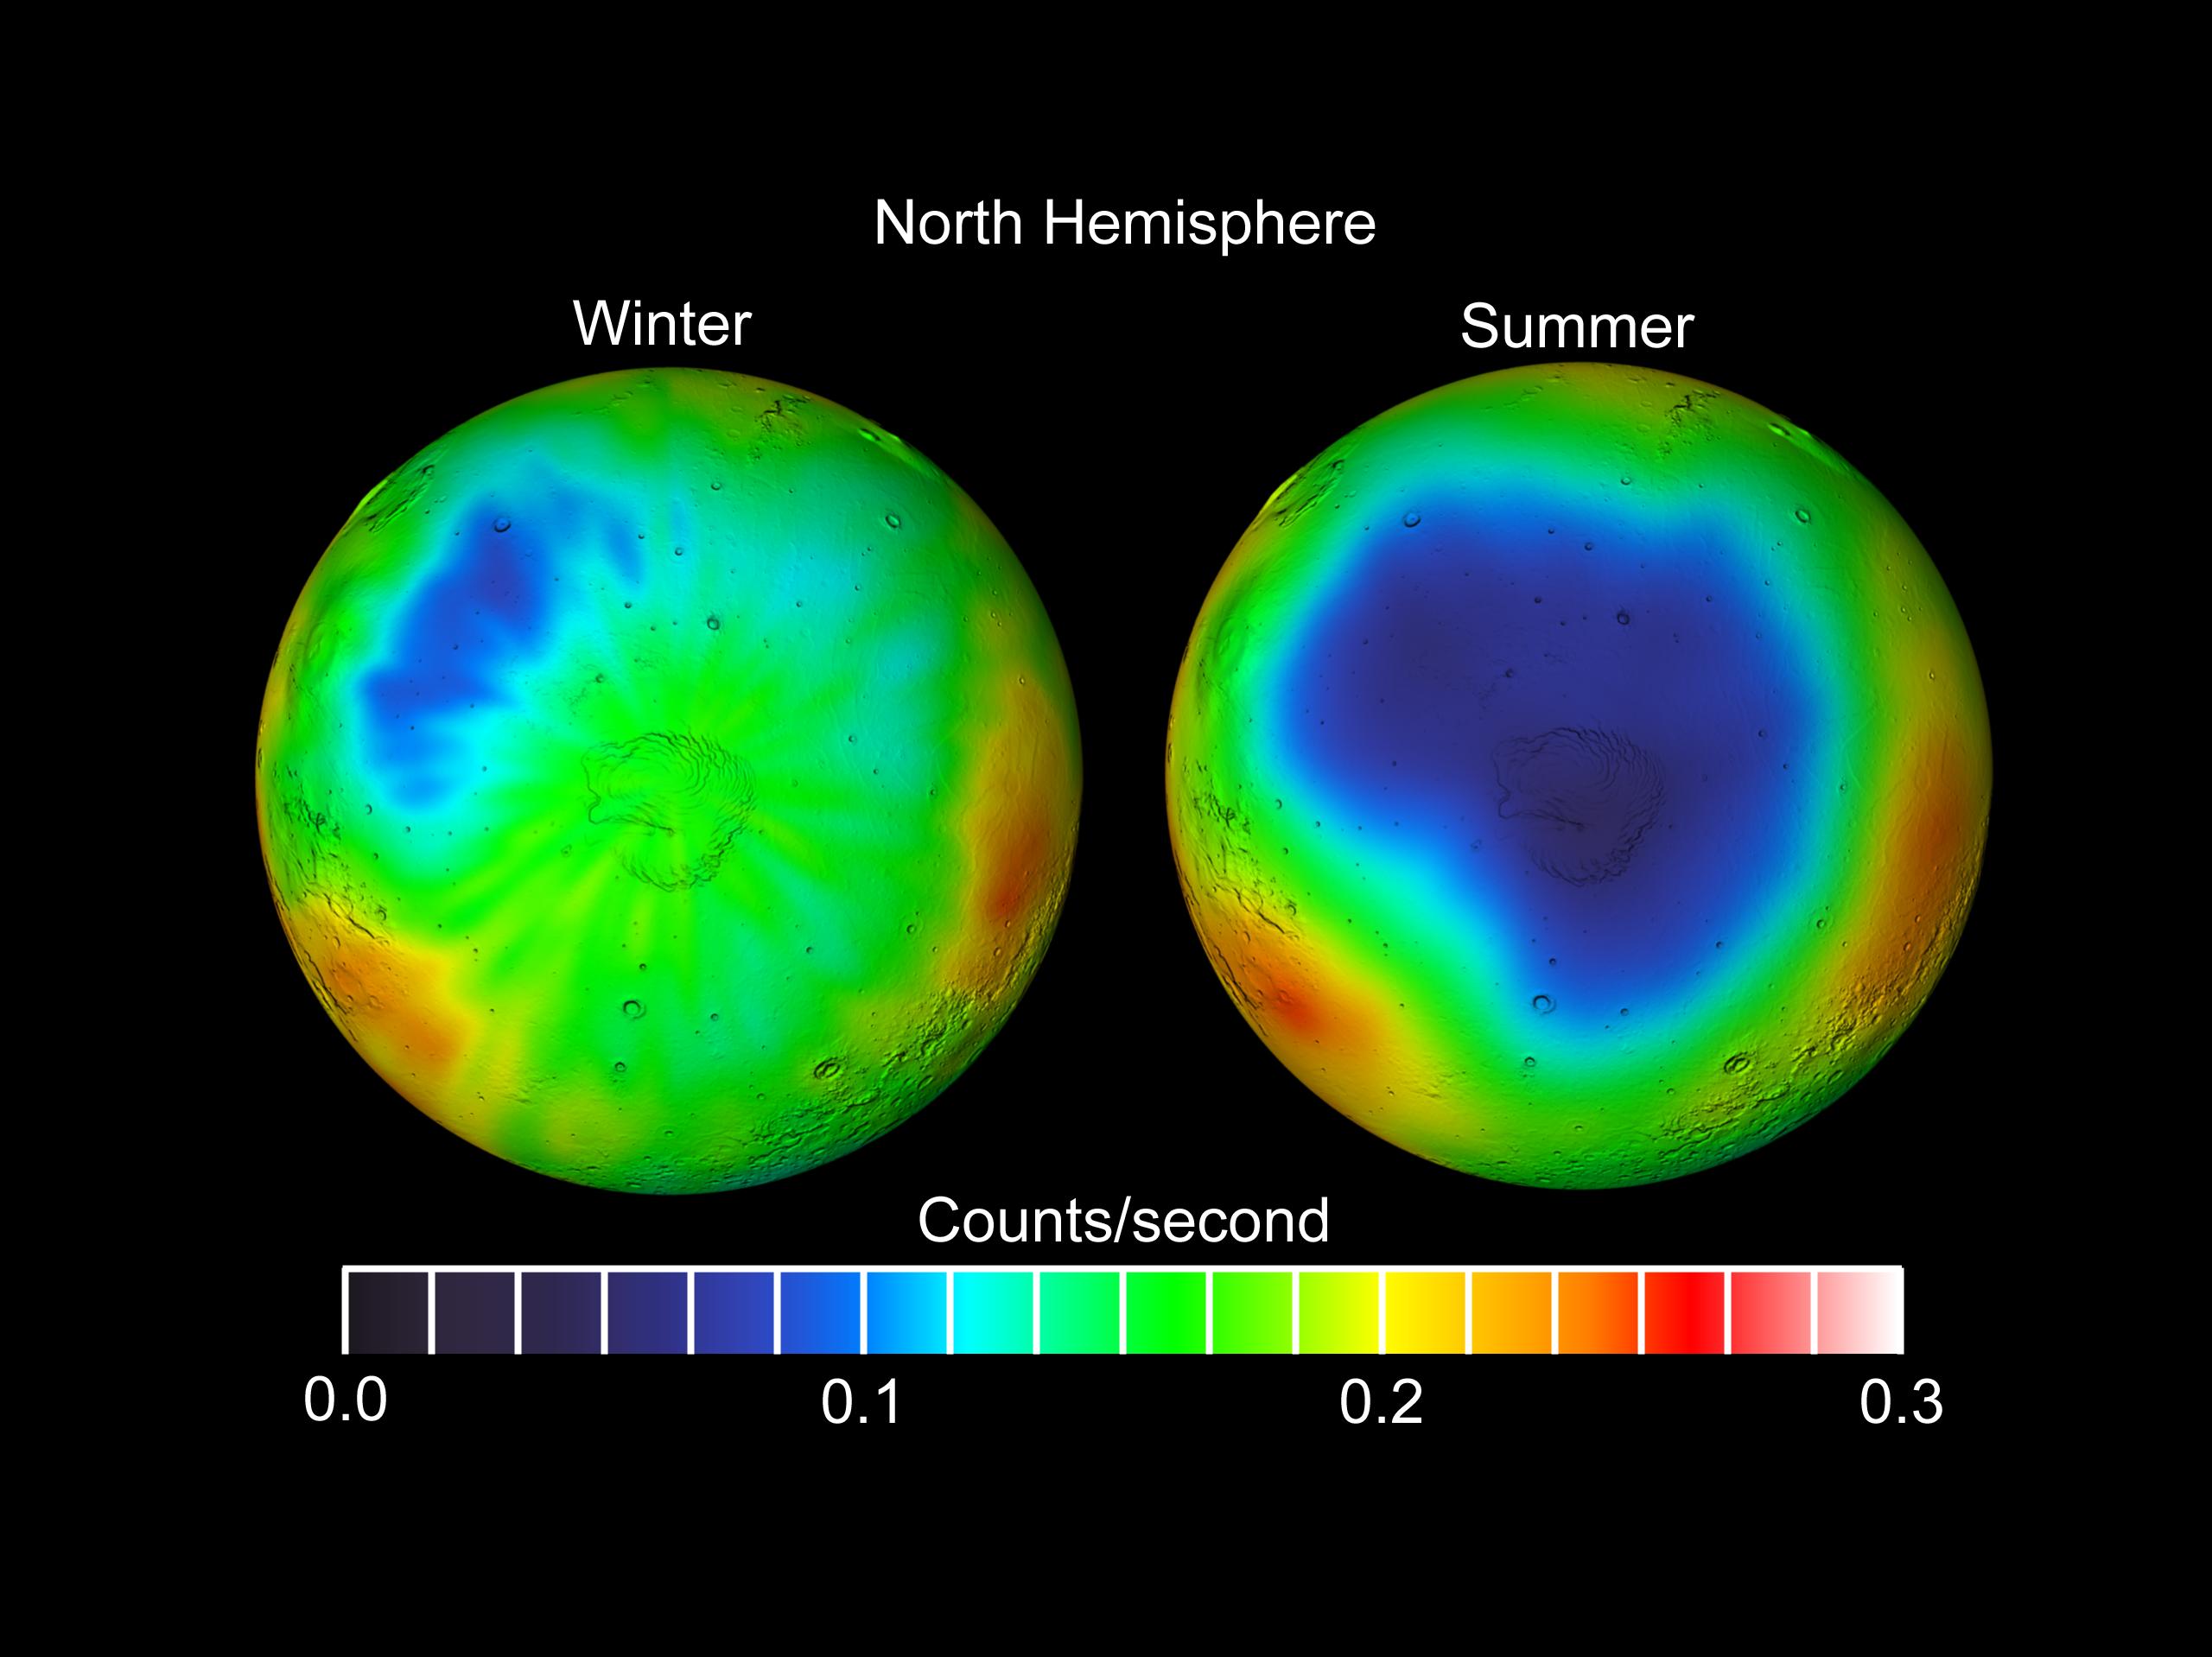
Seasonal Frost Changes on Mars
Full Resolution:
TIFF
(4.931 MB)
JPEG
(239.6 kB)
|
|
|
2003-06-30 |
Mars
|
2001 Mars Odyssey
|
Gamma Ray Spectrometer Suite
|
2560x1918x3 |

|
-
PIA04595:
-
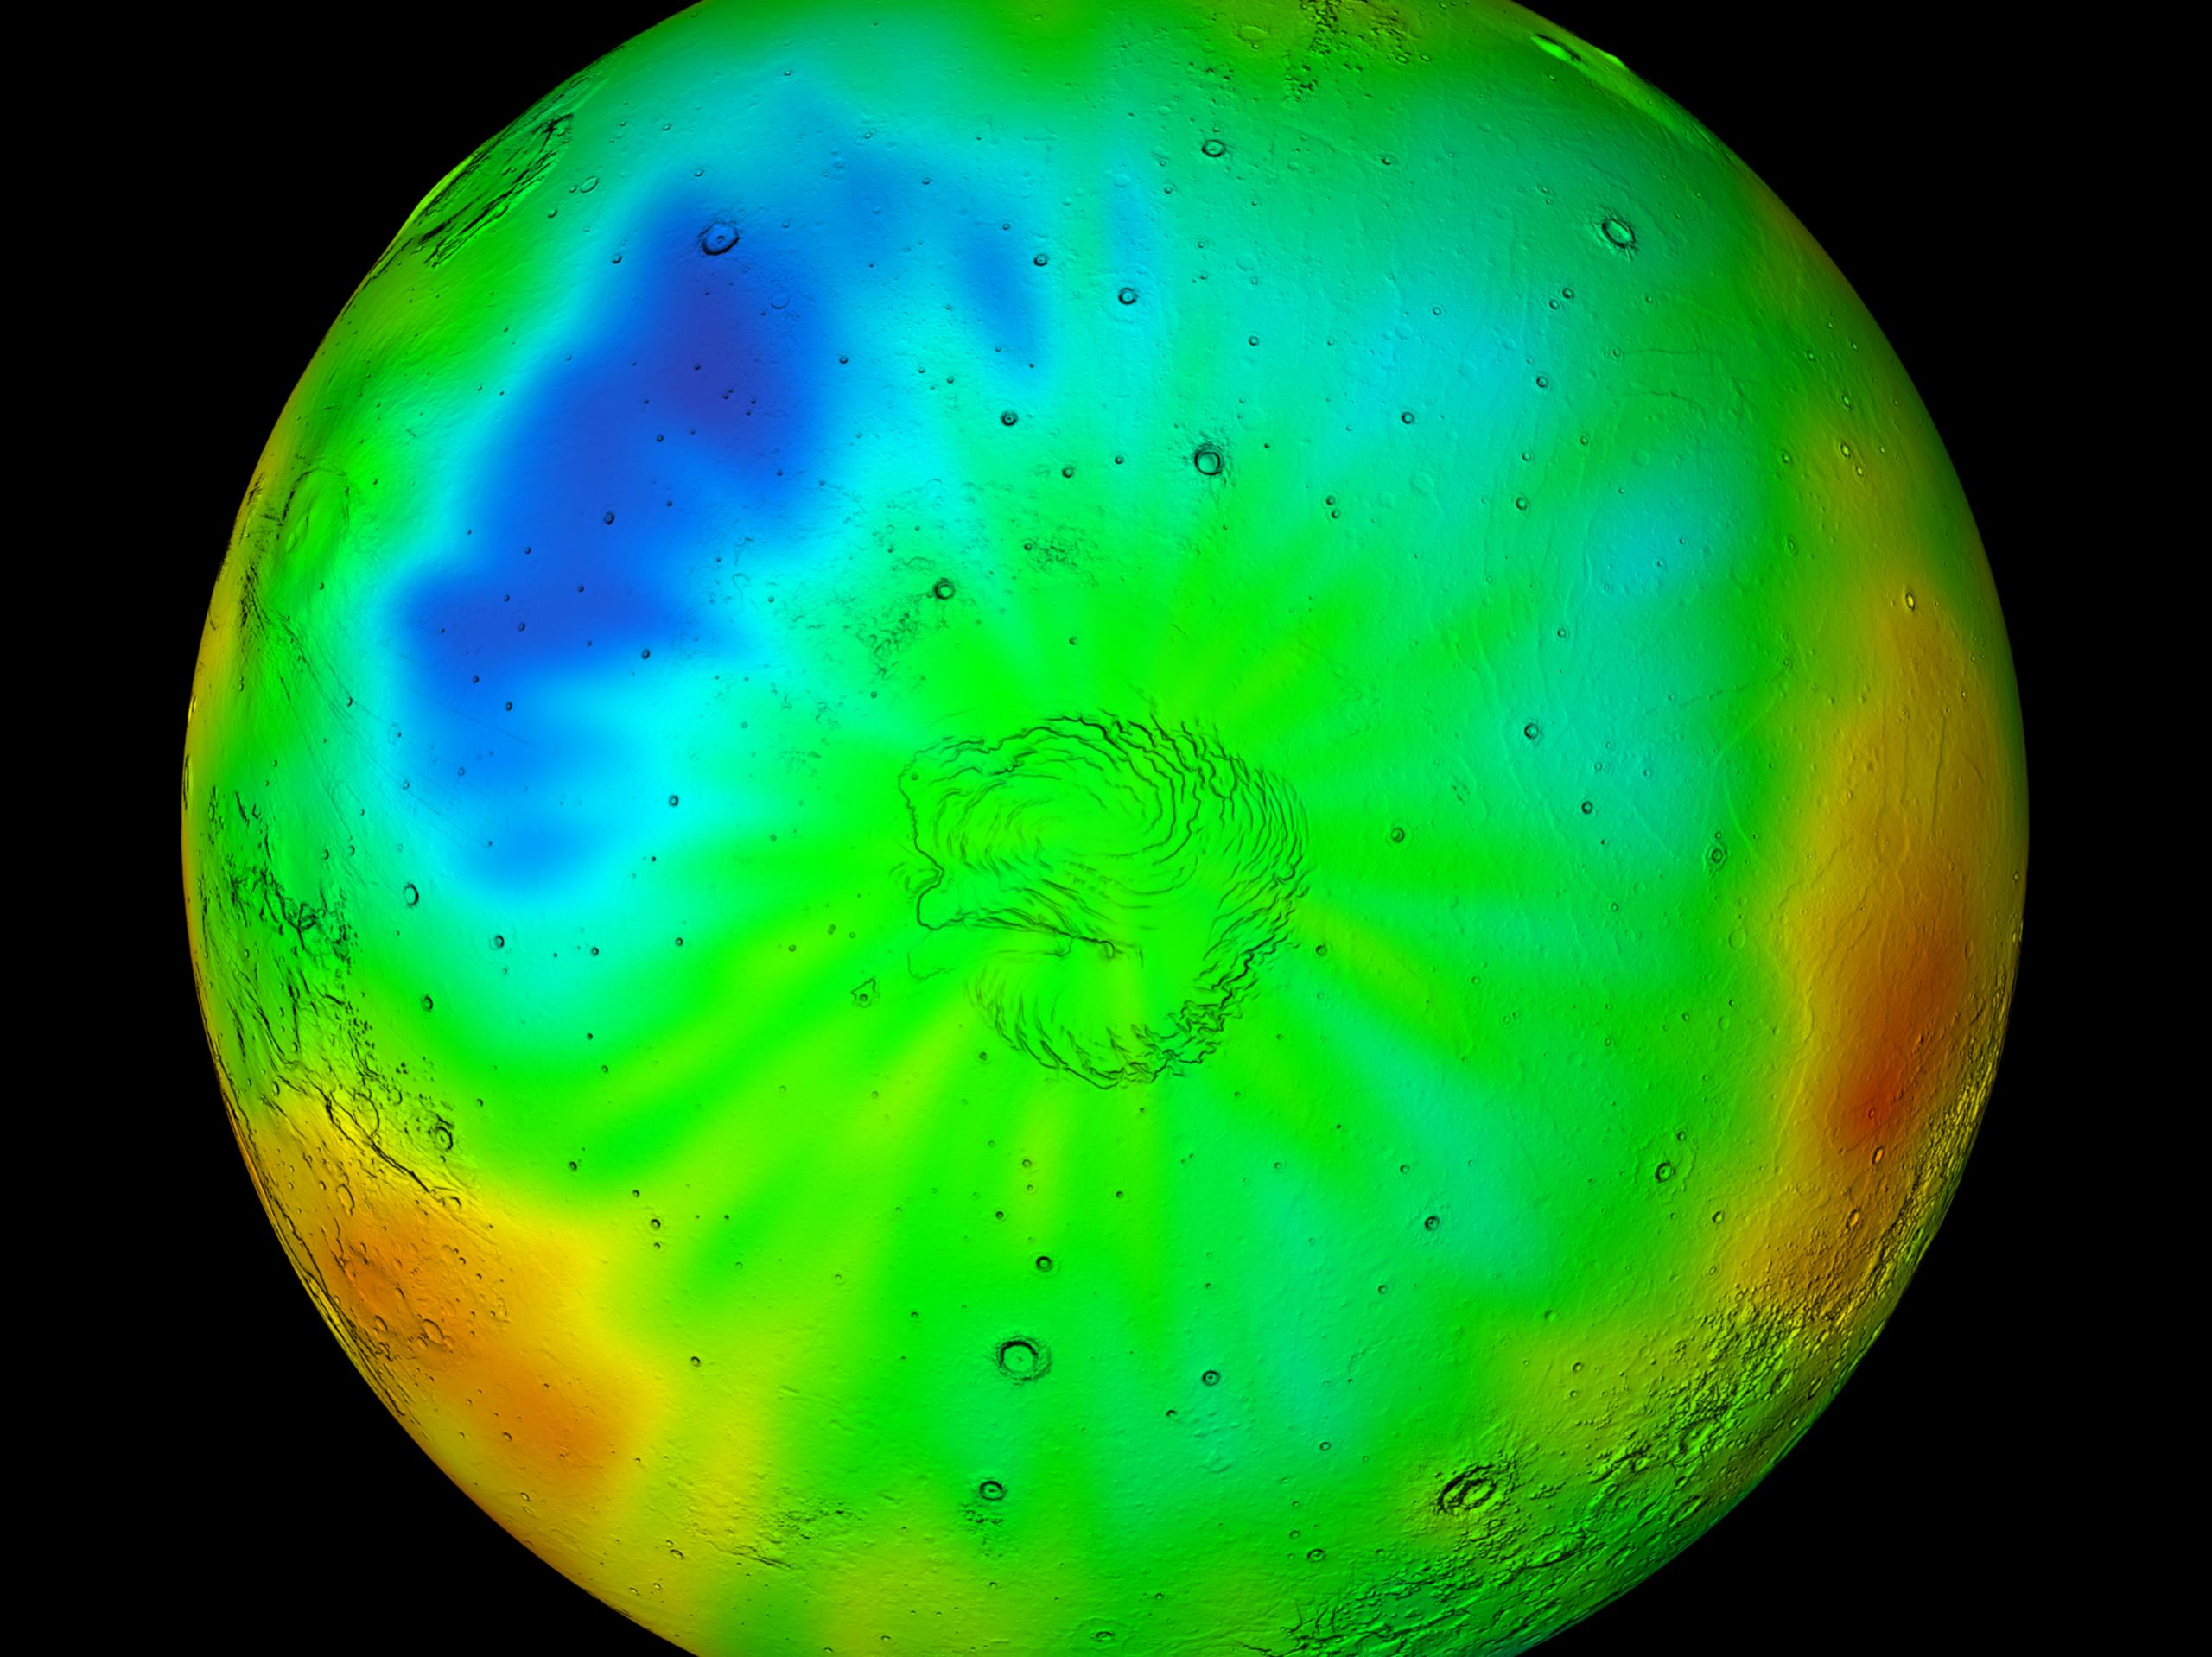
Winter in Mars' North Polar Region
Full Resolution:
TIFF
(9.608 MB)
JPEG
(381.1 kB)
|
|
|
2003-06-30 |
Mars
|
2001 Mars Odyssey
|
Gamma Ray Spectrometer Suite
|
2560x1918x3 |
|
-
PIA04593:
-
Summer in Mars' North Polar Region
Full Resolution:
TIFF
(10.15 MB)
JPEG
(337.8 kB)
|
|
|
2003-03-13 |
Mars
|
2001 Mars Odyssey
|
Gamma Ray Spectrometer Suite
|
2068x947x3 |
|
-
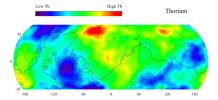
PIA04257:
-
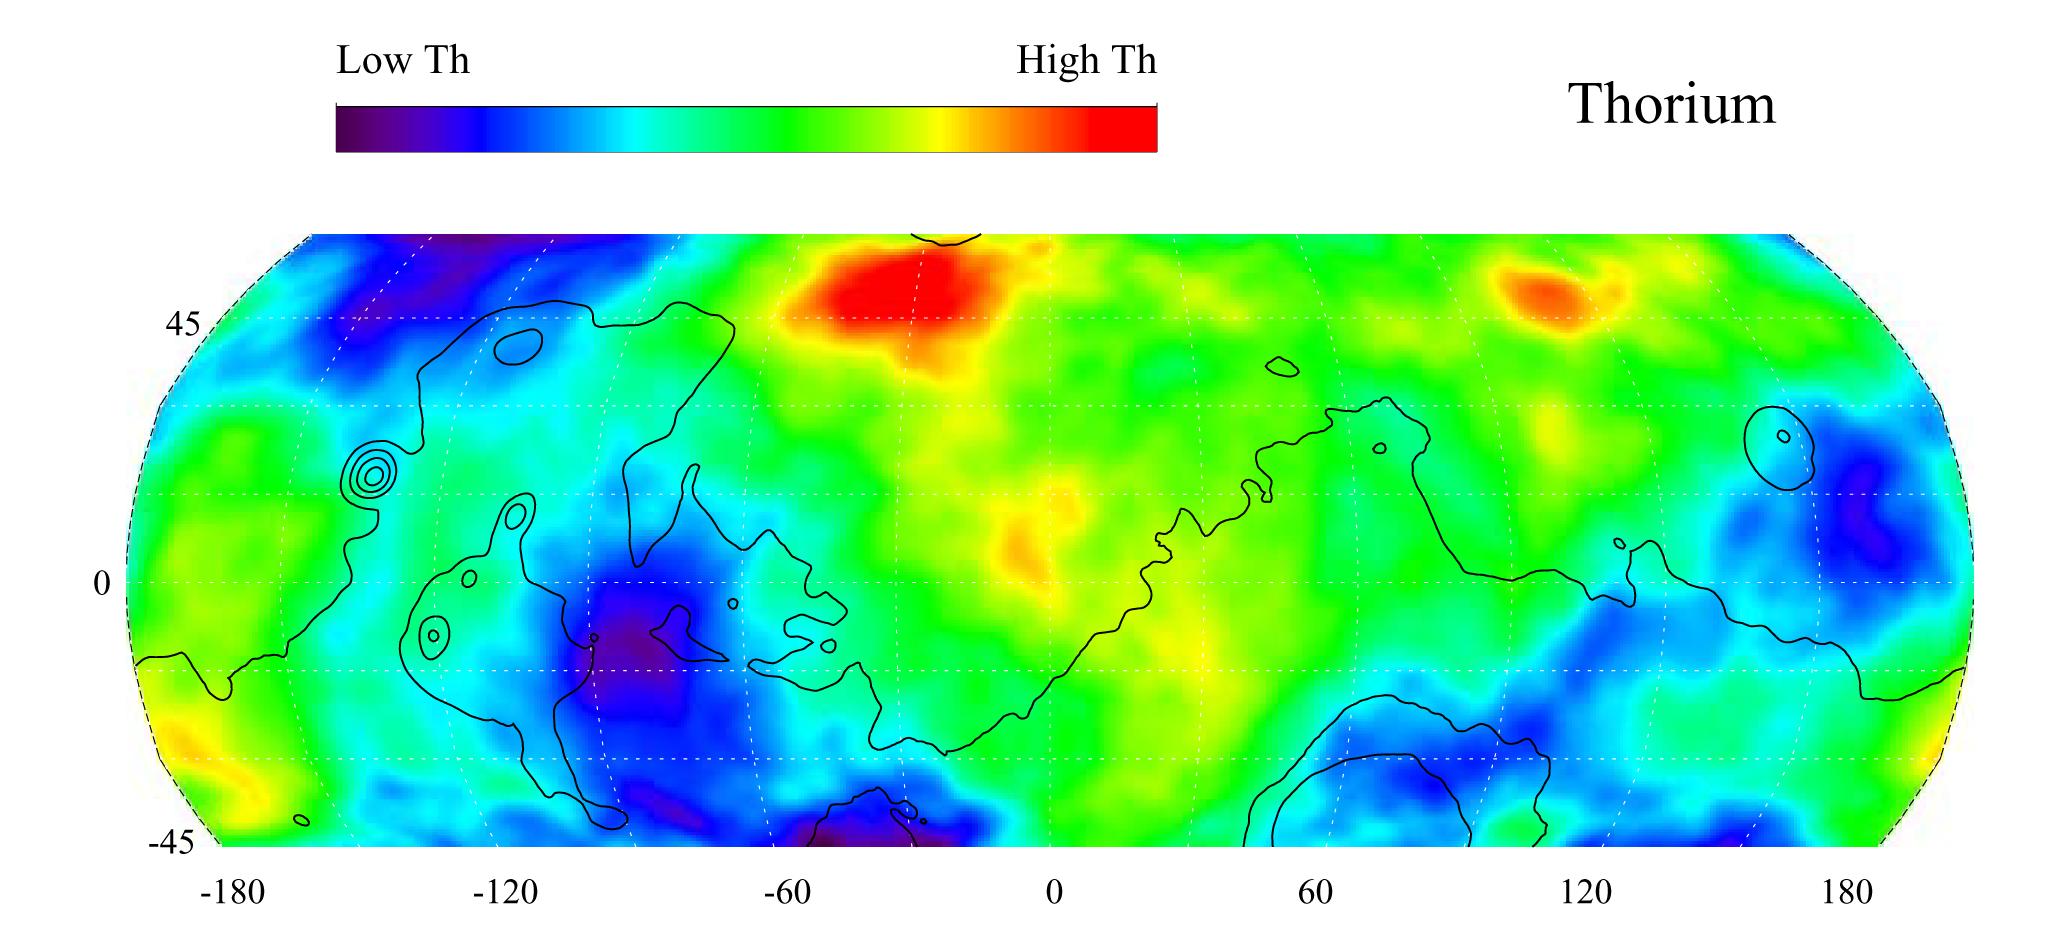
Map of Martian Thorium at Mid-Latitudes
Full Resolution:
TIFF
(2.505 MB)
JPEG
(174.9 kB)
|
|
|
2003-03-13 |
Mars
|
2001 Mars Odyssey
|
Gamma Ray Spectrometer Suite
|
2065x929x3 |

|
-
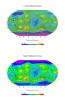
PIA04256:
-
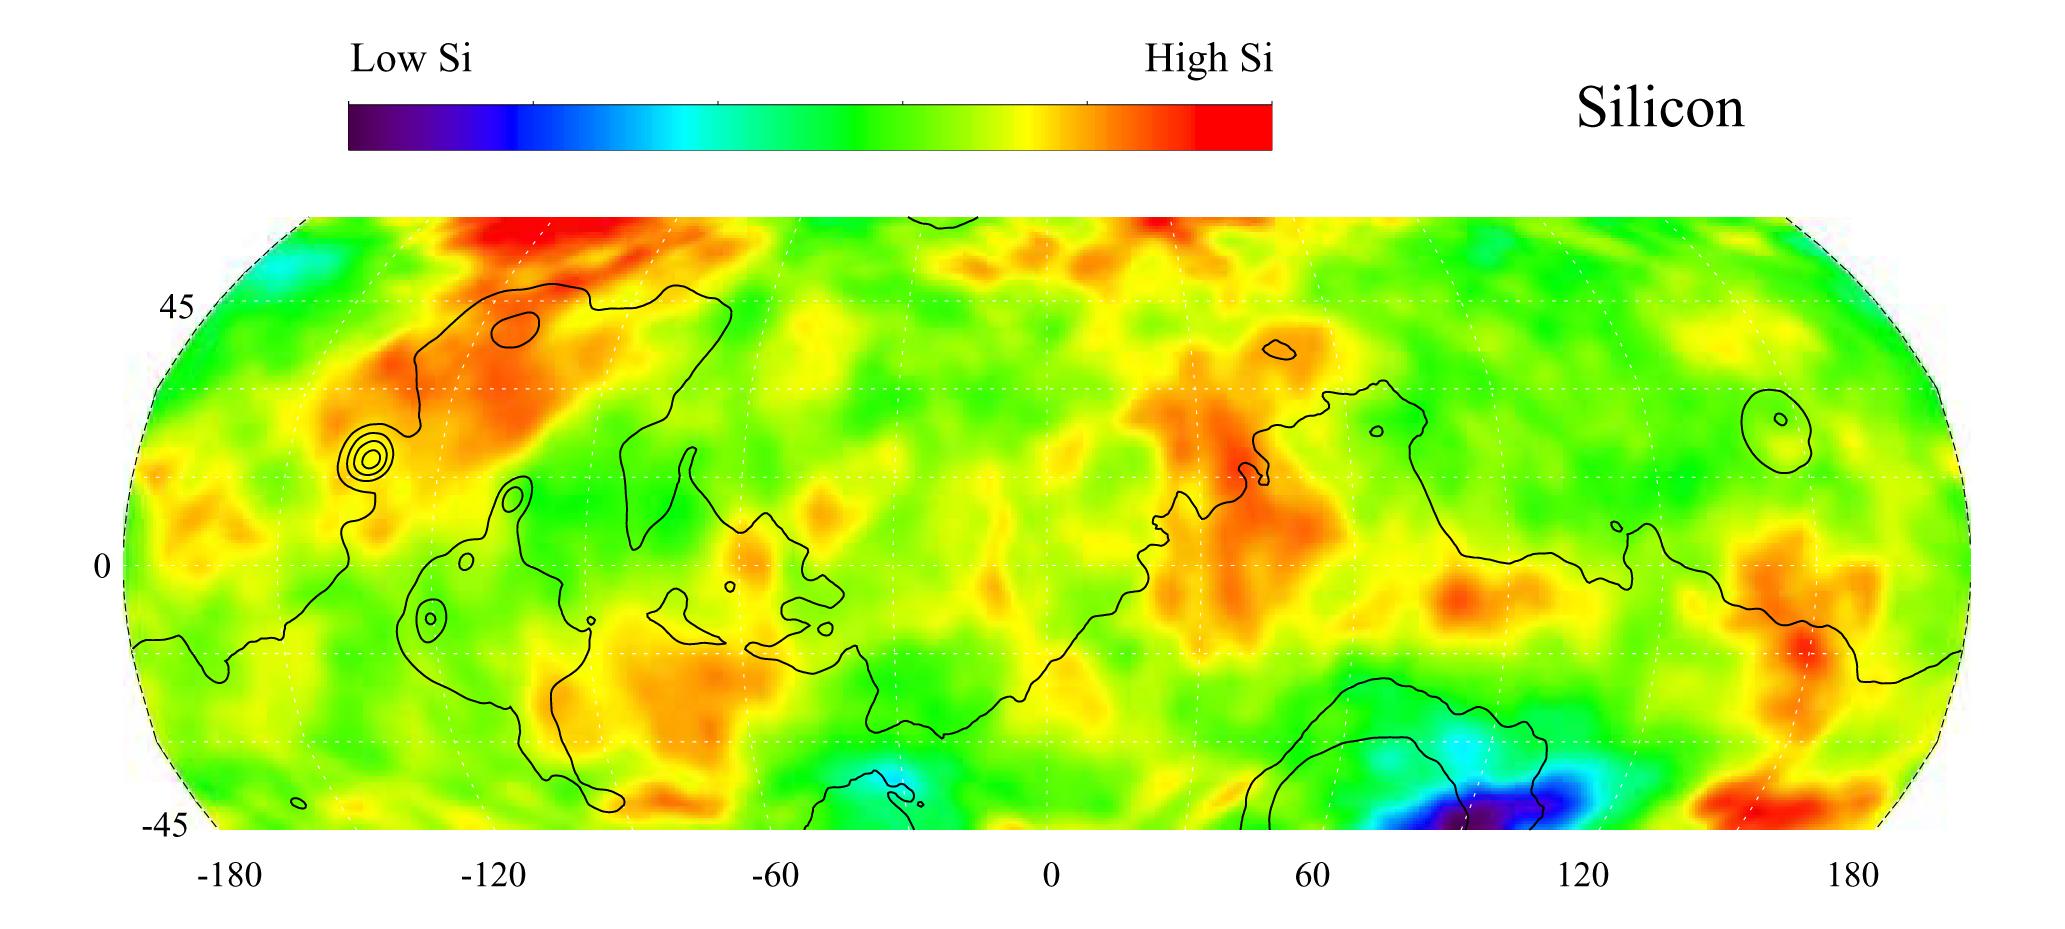
Map of Martian Silicon at Mid-Latitudes
Full Resolution:
TIFF
(2.631 MB)
JPEG
(173.6 kB)
|
|
|
2003-03-13 |
Mars
|
2001 Mars Odyssey
|
Gamma Ray Spectrometer Suite
|
2072x1013x3 |
|
-
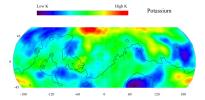
PIA04255:
-
Map of Martian Potassium at Mid-Latitudes
Full Resolution:
TIFF
(2.463 MB)
JPEG
(179.9 kB)
|
|
|
2003-03-13 |
Mars
|
2001 Mars Odyssey
|
Gamma Ray Spectrometer Suite
|
1163x1579x3 |
|
-
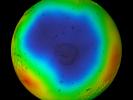
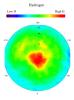
PIA04254:
-
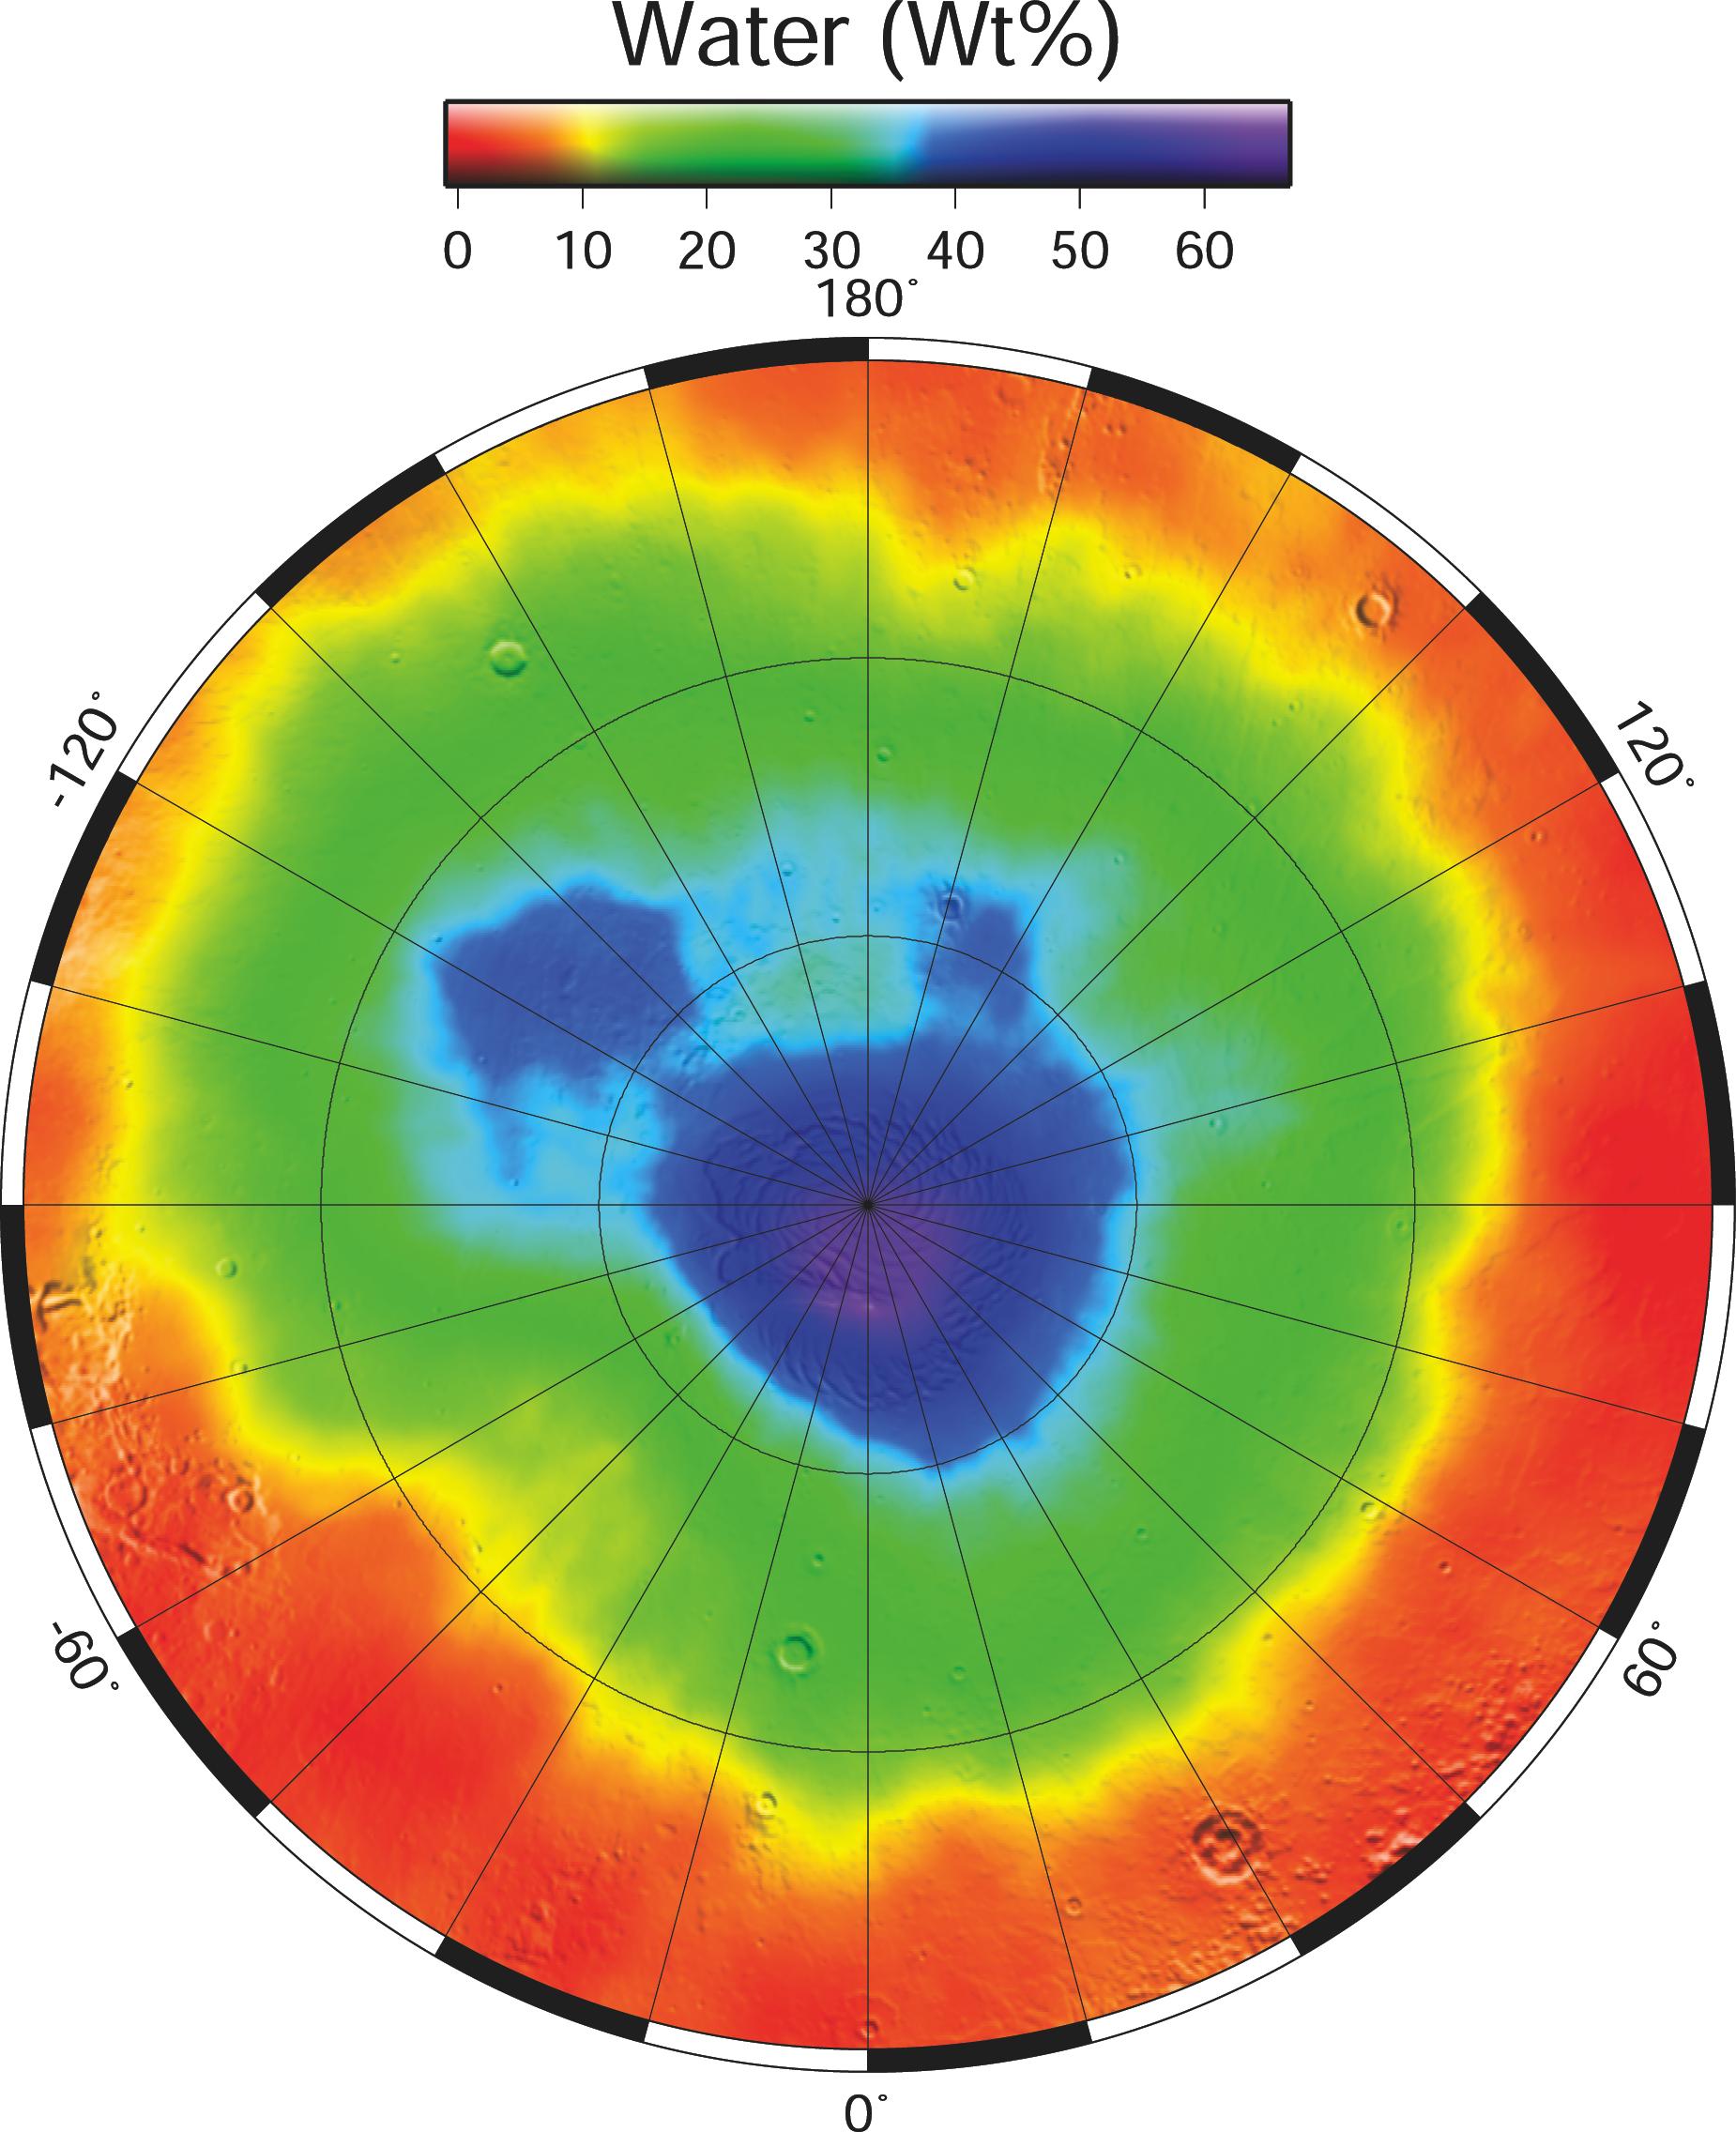
Map of Martian Polar Hydrogen
Full Resolution:
TIFF
(2.15 MB)
JPEG
(117 kB)
|
|
|
2003-03-13 |
Mars
|
2001 Mars Odyssey
|
Gamma Ray Spectrometer Suite
|
2068x1009x3 |
|
-
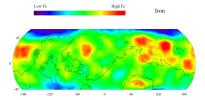
PIA04253:
-
Map of Martian Iron at Mid-Latitudes
Full Resolution:
TIFF
(2.495 MB)
JPEG
(180.7 kB)
|
|
|
2002-12-10 |
Mars
|
2001 Mars Odyssey
|
Gamma Ray Spectrometer Suite
|
663x1024x3 |
|
-
PIA03744:
-
Odyssey/NS
Full Resolution:
TIFF
(890.3 kB)
JPEG
(93.61 kB)
|
|
|
2002-05-30 |
Mars
|
2001 Mars Odyssey
|
Gamma Ray Spectrometer Suite
|
1785x2532x3 |
|
-
PIA03808:
-
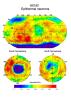
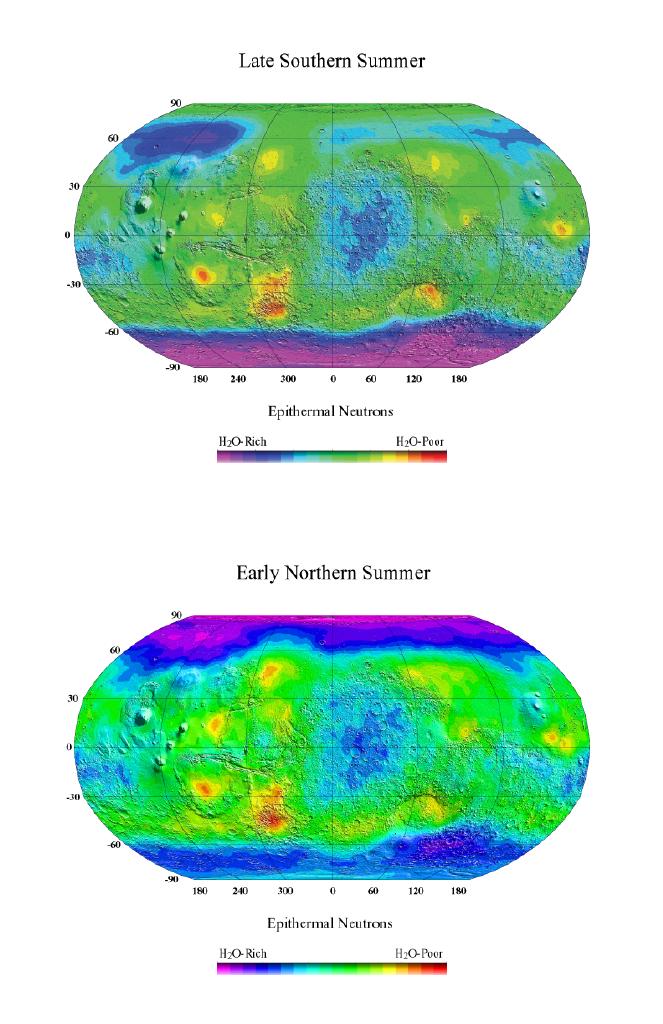
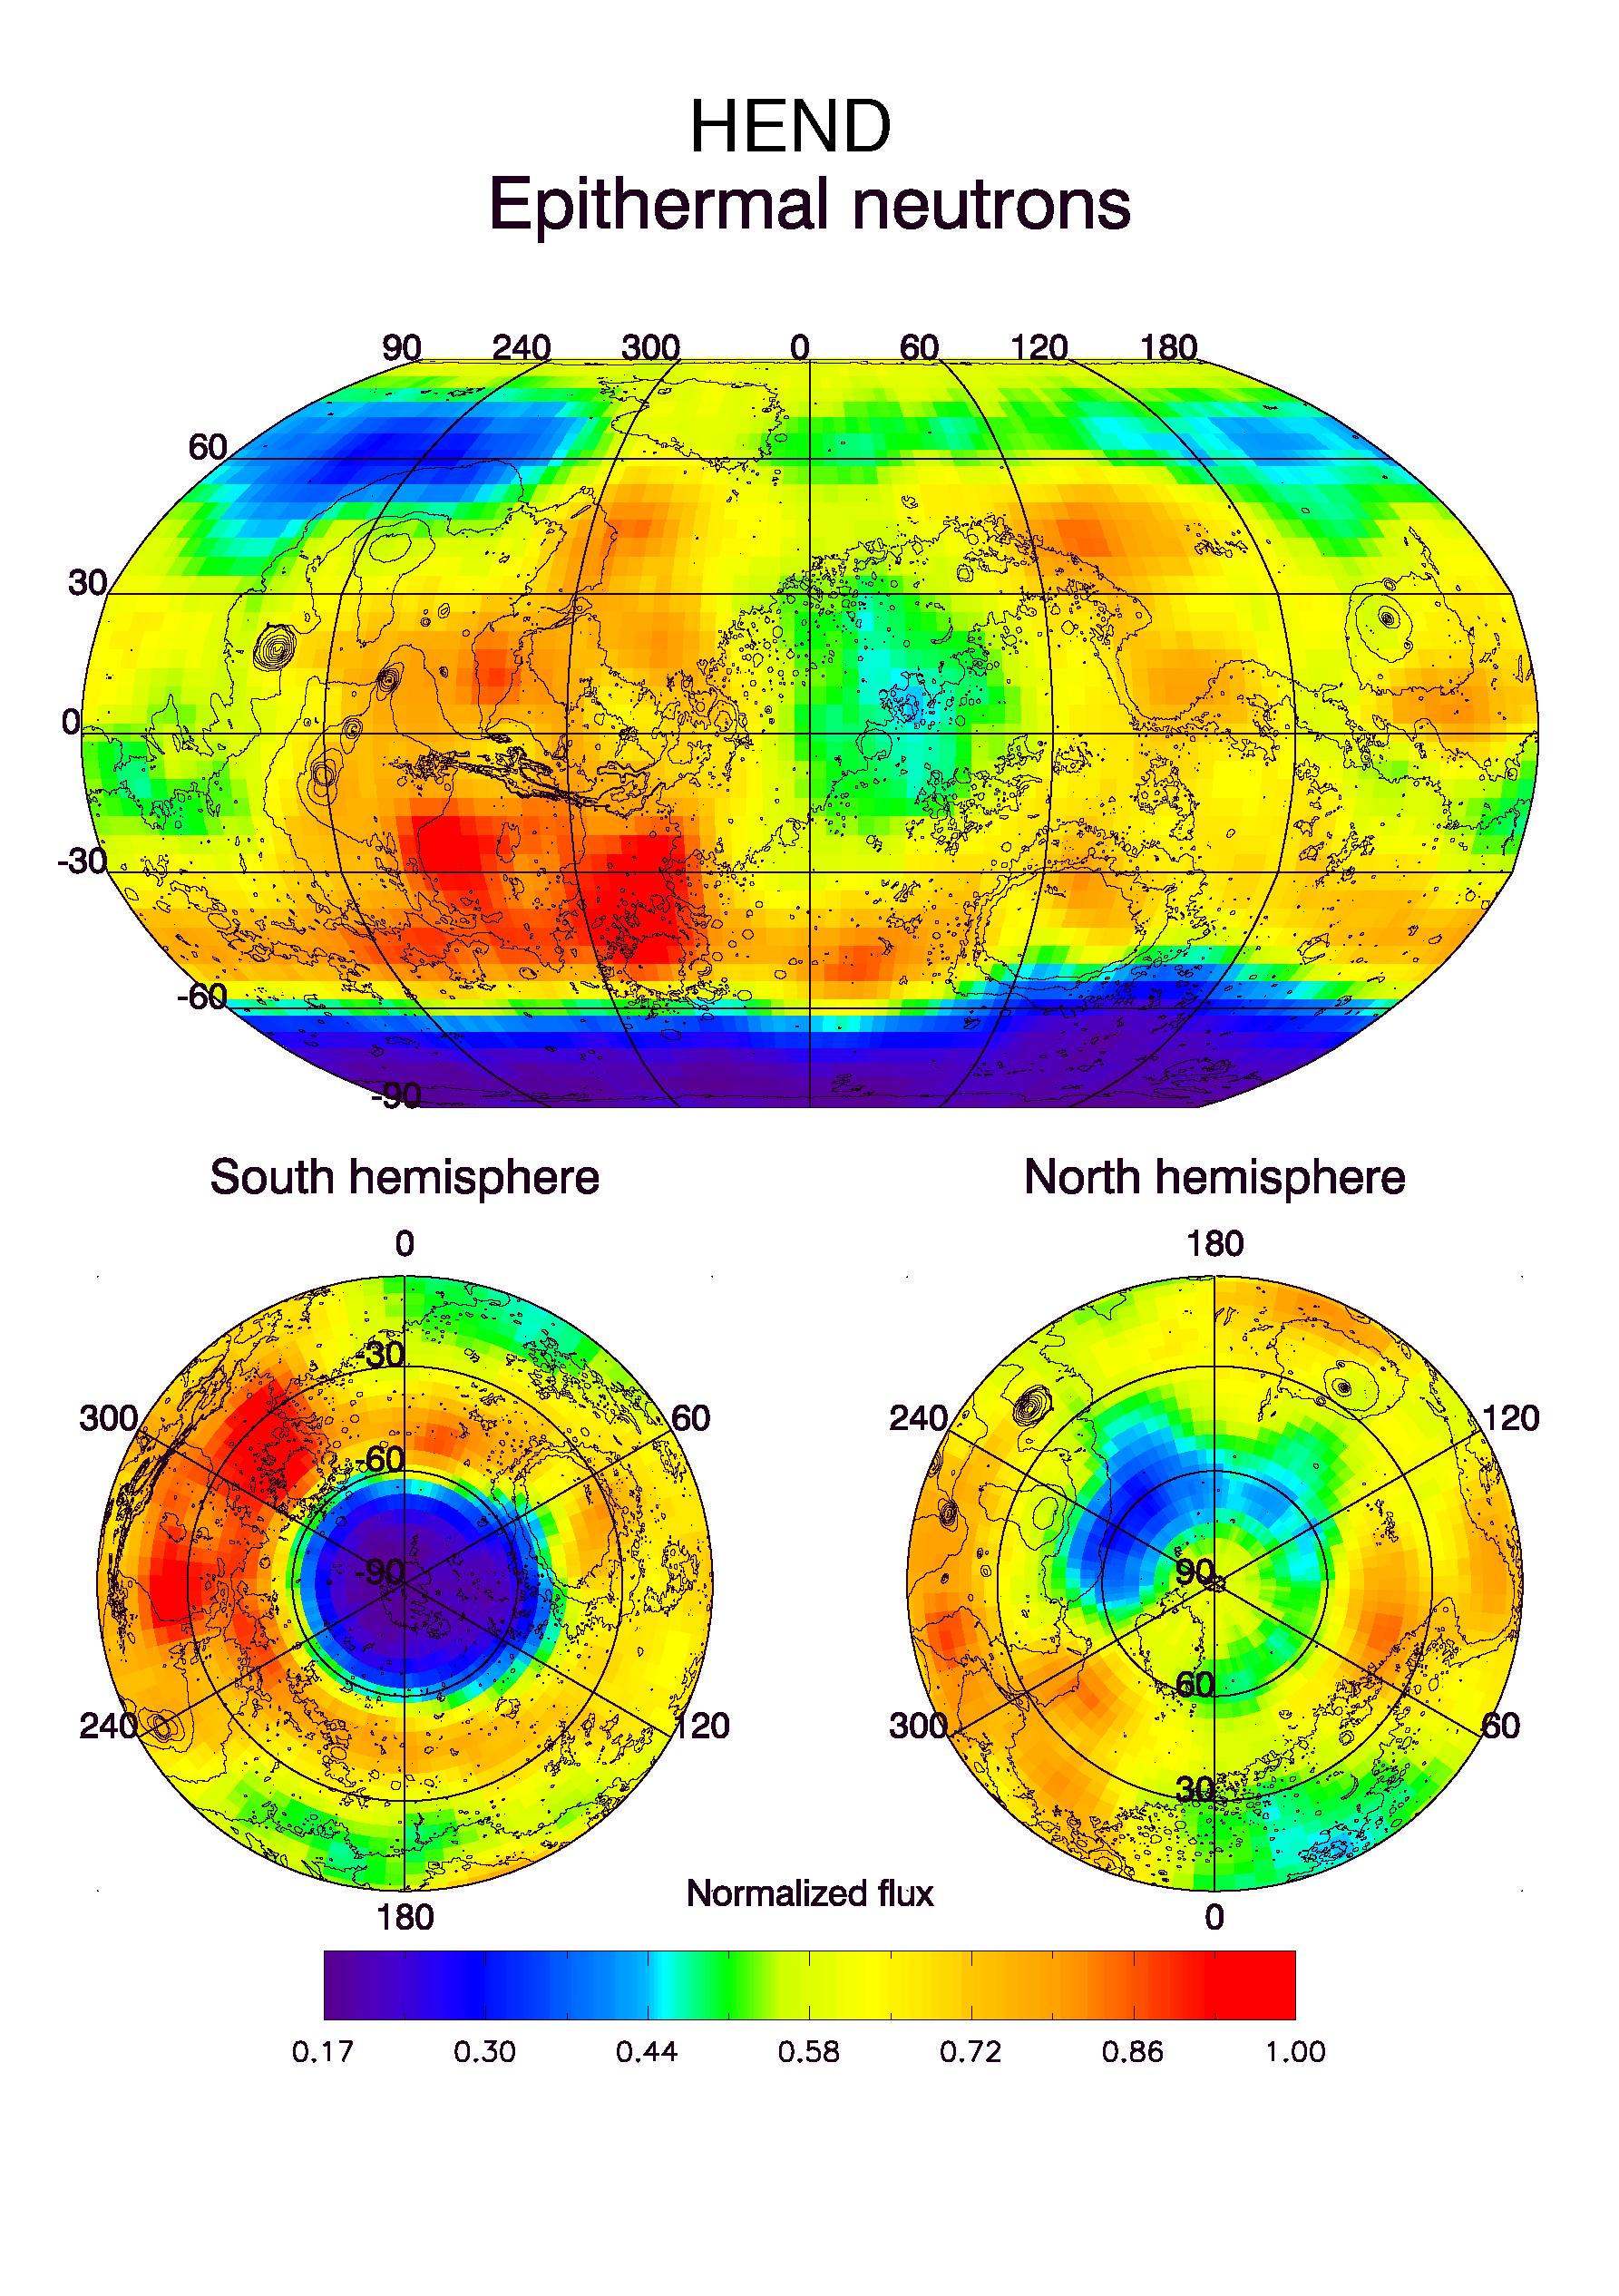
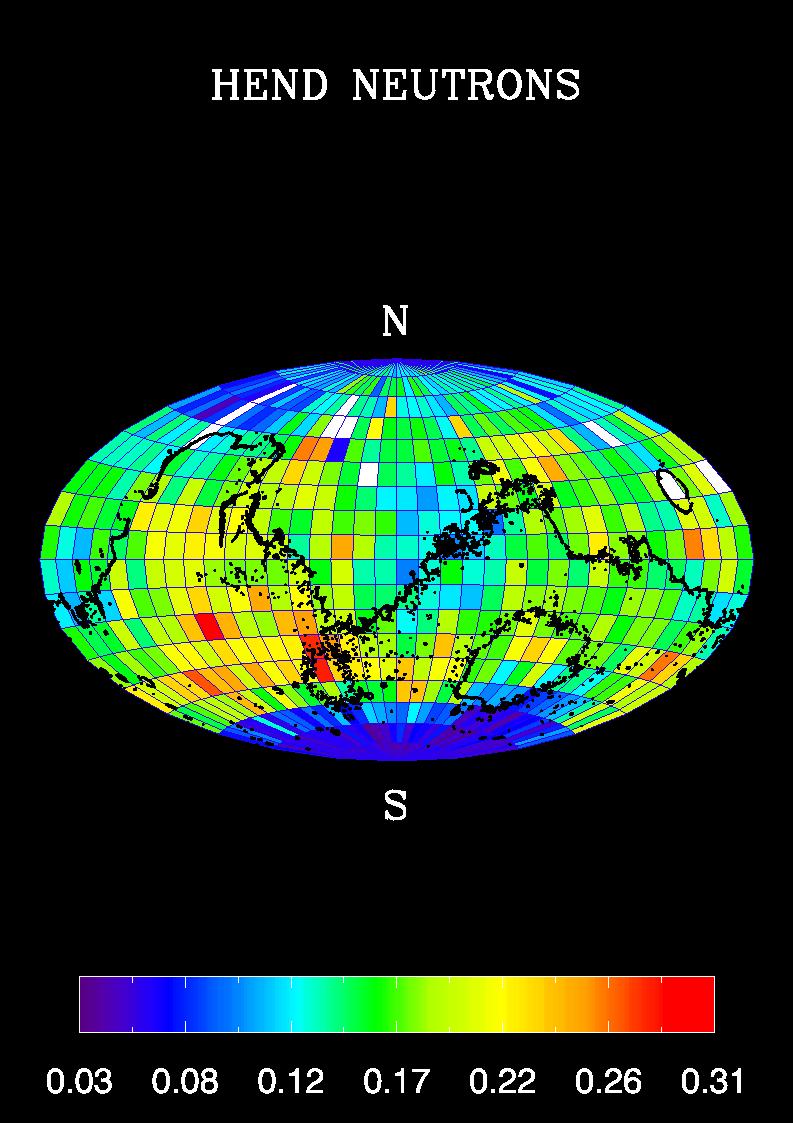
HEND Maps of Epithermal Neutrons
Full Resolution:
TIFF
(576 kB)
JPEG
(719.5 kB)
|
|
|
2002-05-30 |
Mars
|
2001 Mars Odyssey
|
Gamma Ray Spectrometer Suite
|
1785x2532x3 |
|
-
PIA03807:
-
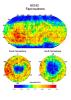
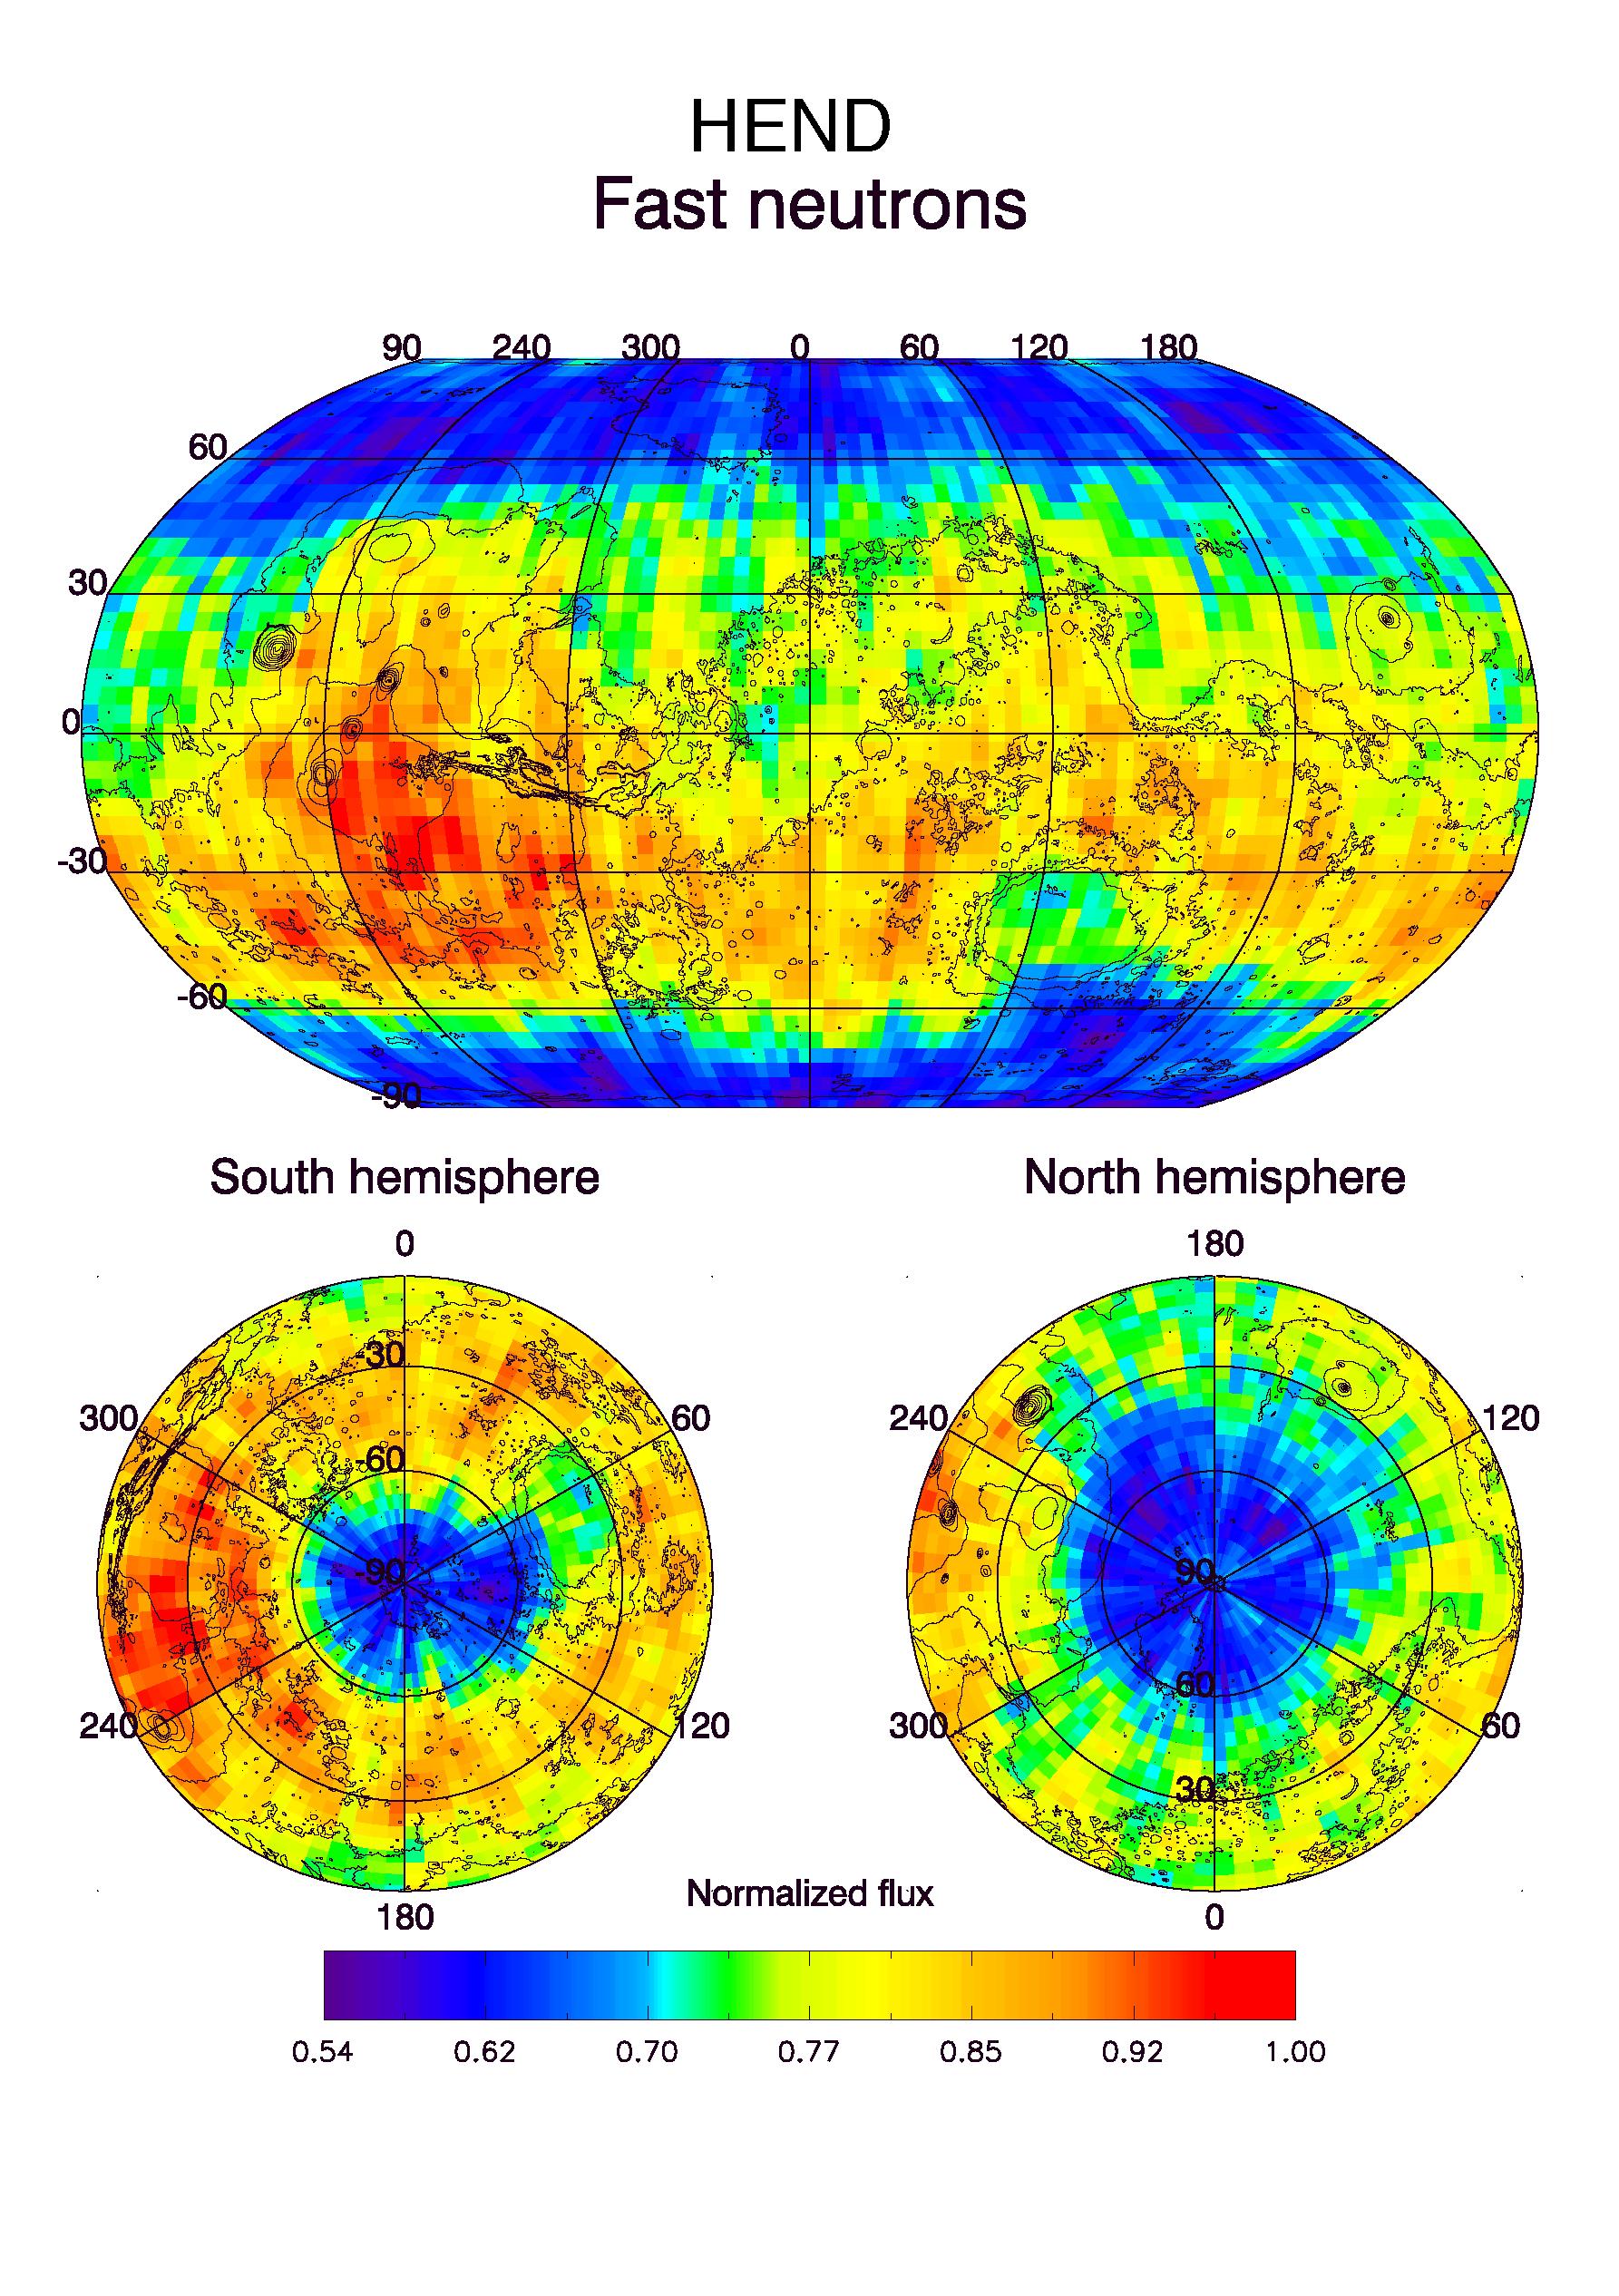
HEND Maps of Fast Neutrons
Full Resolution:
TIFF
(600.3 kB)
JPEG
(770.9 kB)
|
|
|
2002-05-28 |
Mars
|
2001 Mars Odyssey
|
Gamma Ray Spectrometer Suite
|
5300x6450x3 |
|
-
PIA03804:
-
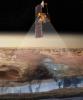
Artist's View of Odyssey Detecting Ice (Artist Concept)
Full Resolution:
TIFF
(72.28 MB)
JPEG
(3.86 MB)
|
|
|
2002-05-28 |
Mars
|
2001 Mars Odyssey
|
Gamma Ray Spectrometer Suite
|
1764x1068x3 |
|
-
PIA03803:
-
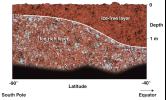
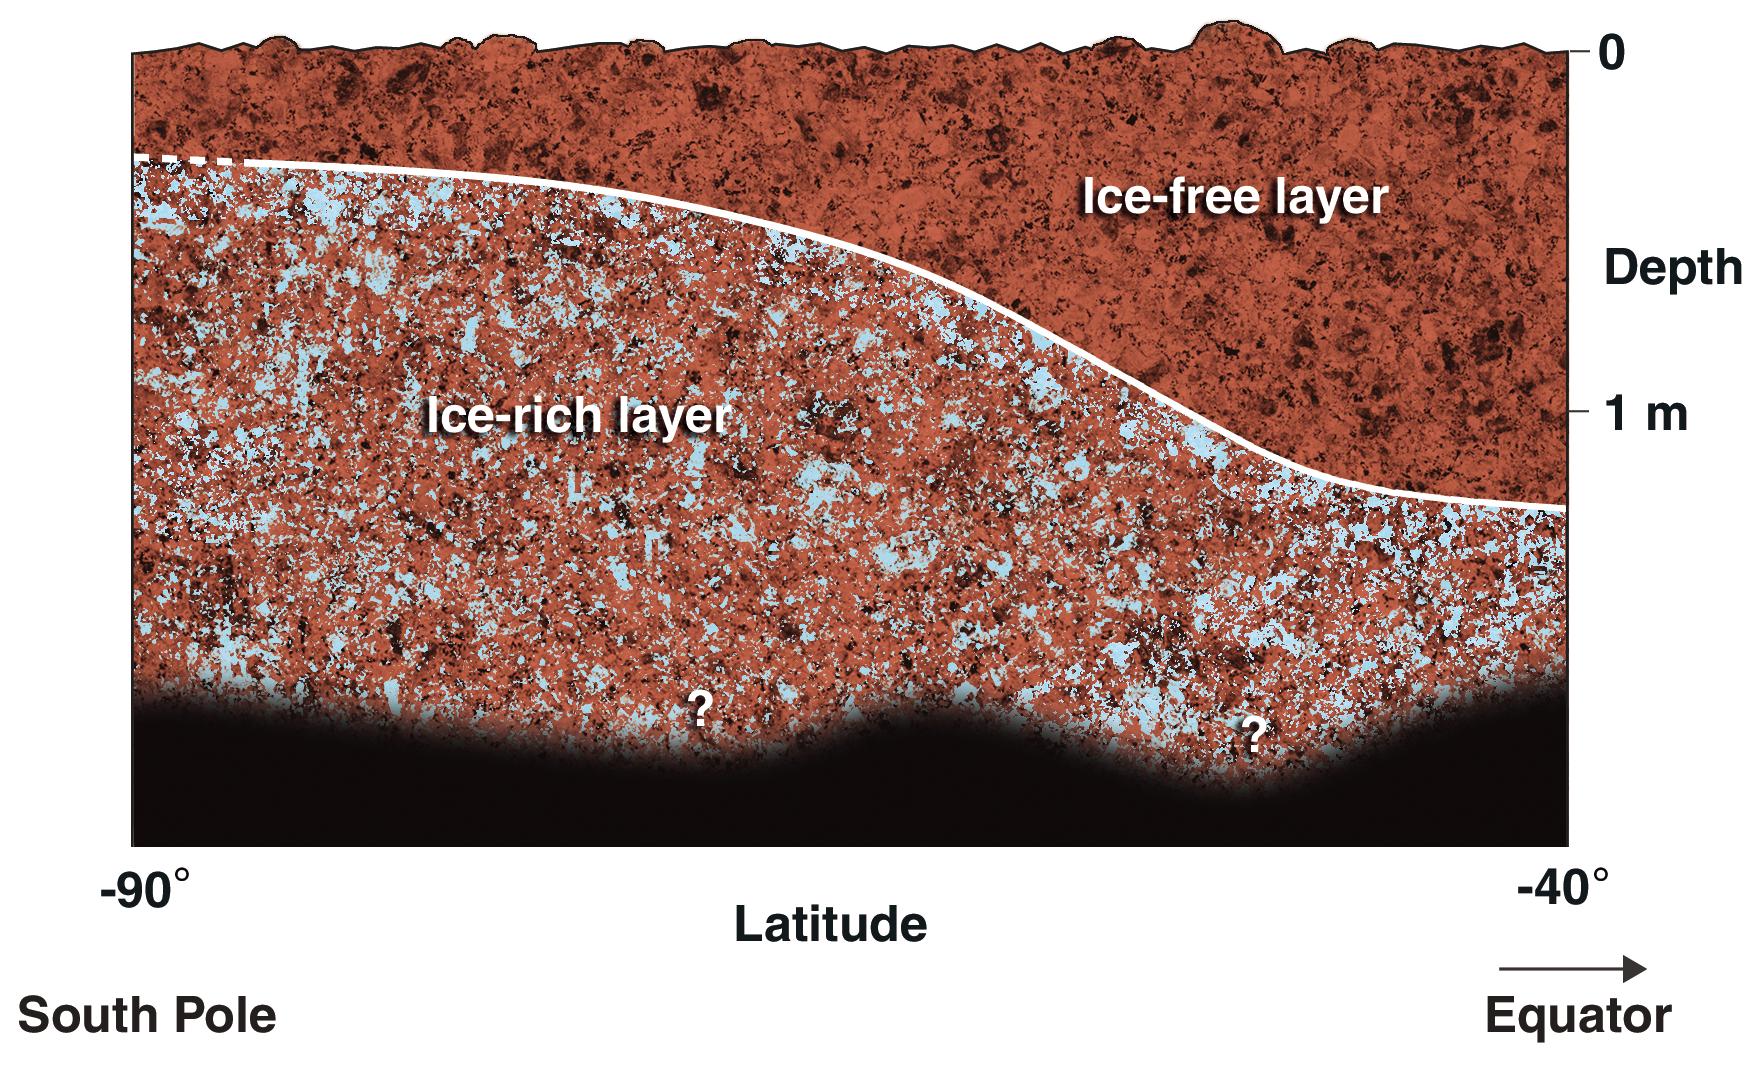
Cross-Section of Icy Soil
Full Resolution:
TIFF
(2.723 MB)
JPEG
(421.9 kB)
|
|
|
2002-05-28 |
Mars
|
2001 Mars Odyssey
|
Gamma Ray Spectrometer Suite
|
1640x1750x3 |
|
-
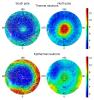
PIA03802:
-
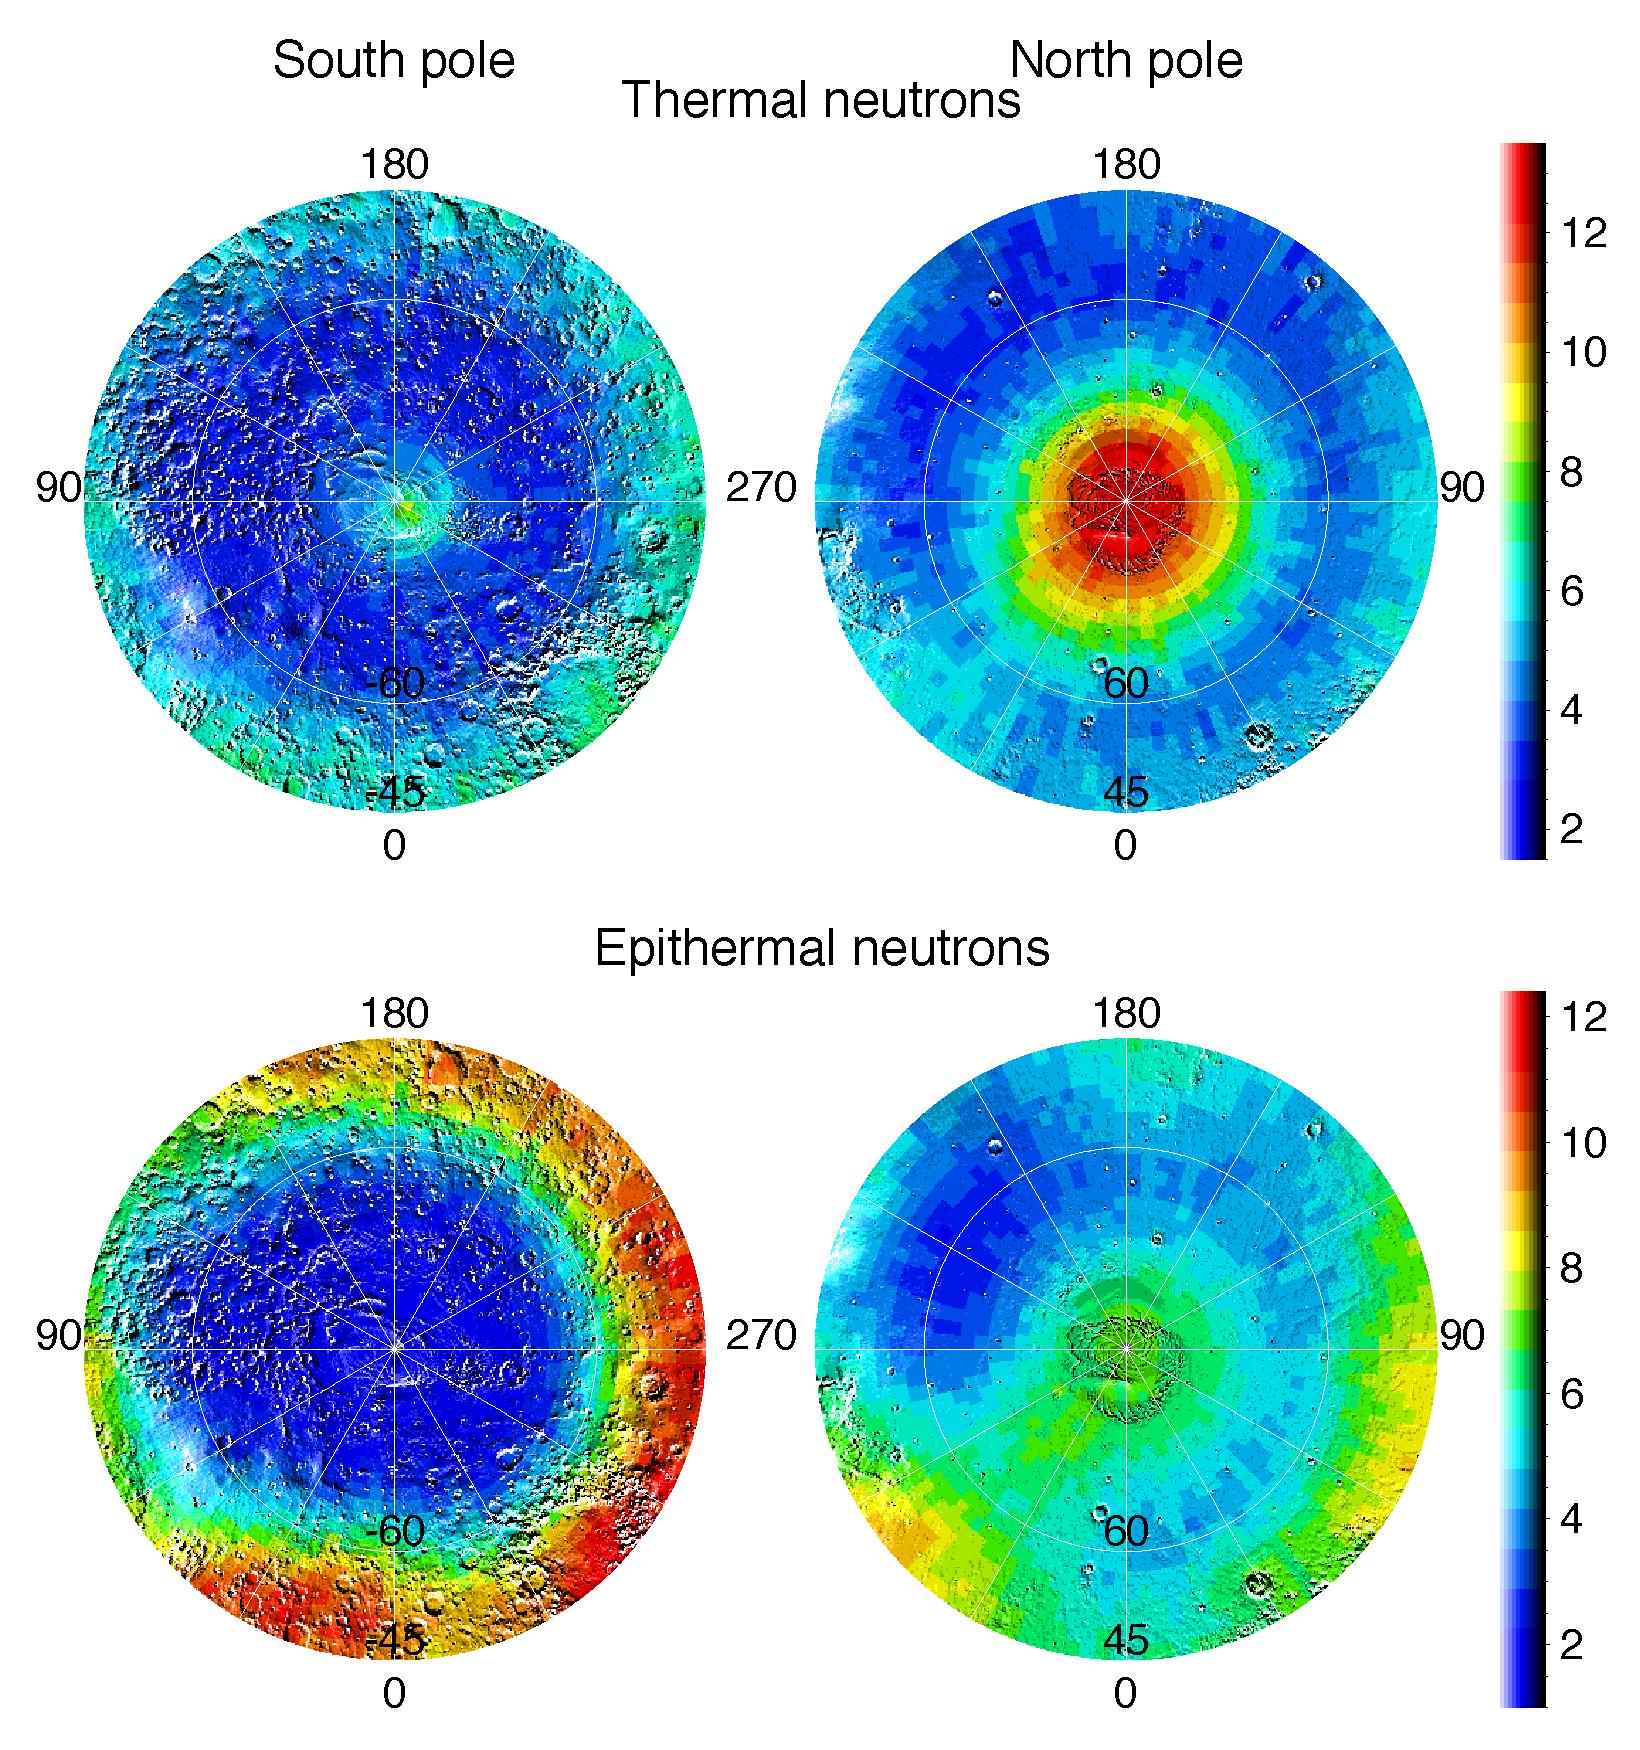
Polar Maps of Thermal and Epithermal Neutrons
Full Resolution:
TIFF
(633.3 kB)
JPEG
(586 kB)
|
|
|
2002-05-28 |
Mars
|
2001 Mars Odyssey
|
Gamma Ray Spectrometer Suite
|
2668x1371x3 |
|
-
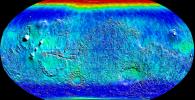
PIA03801:
-
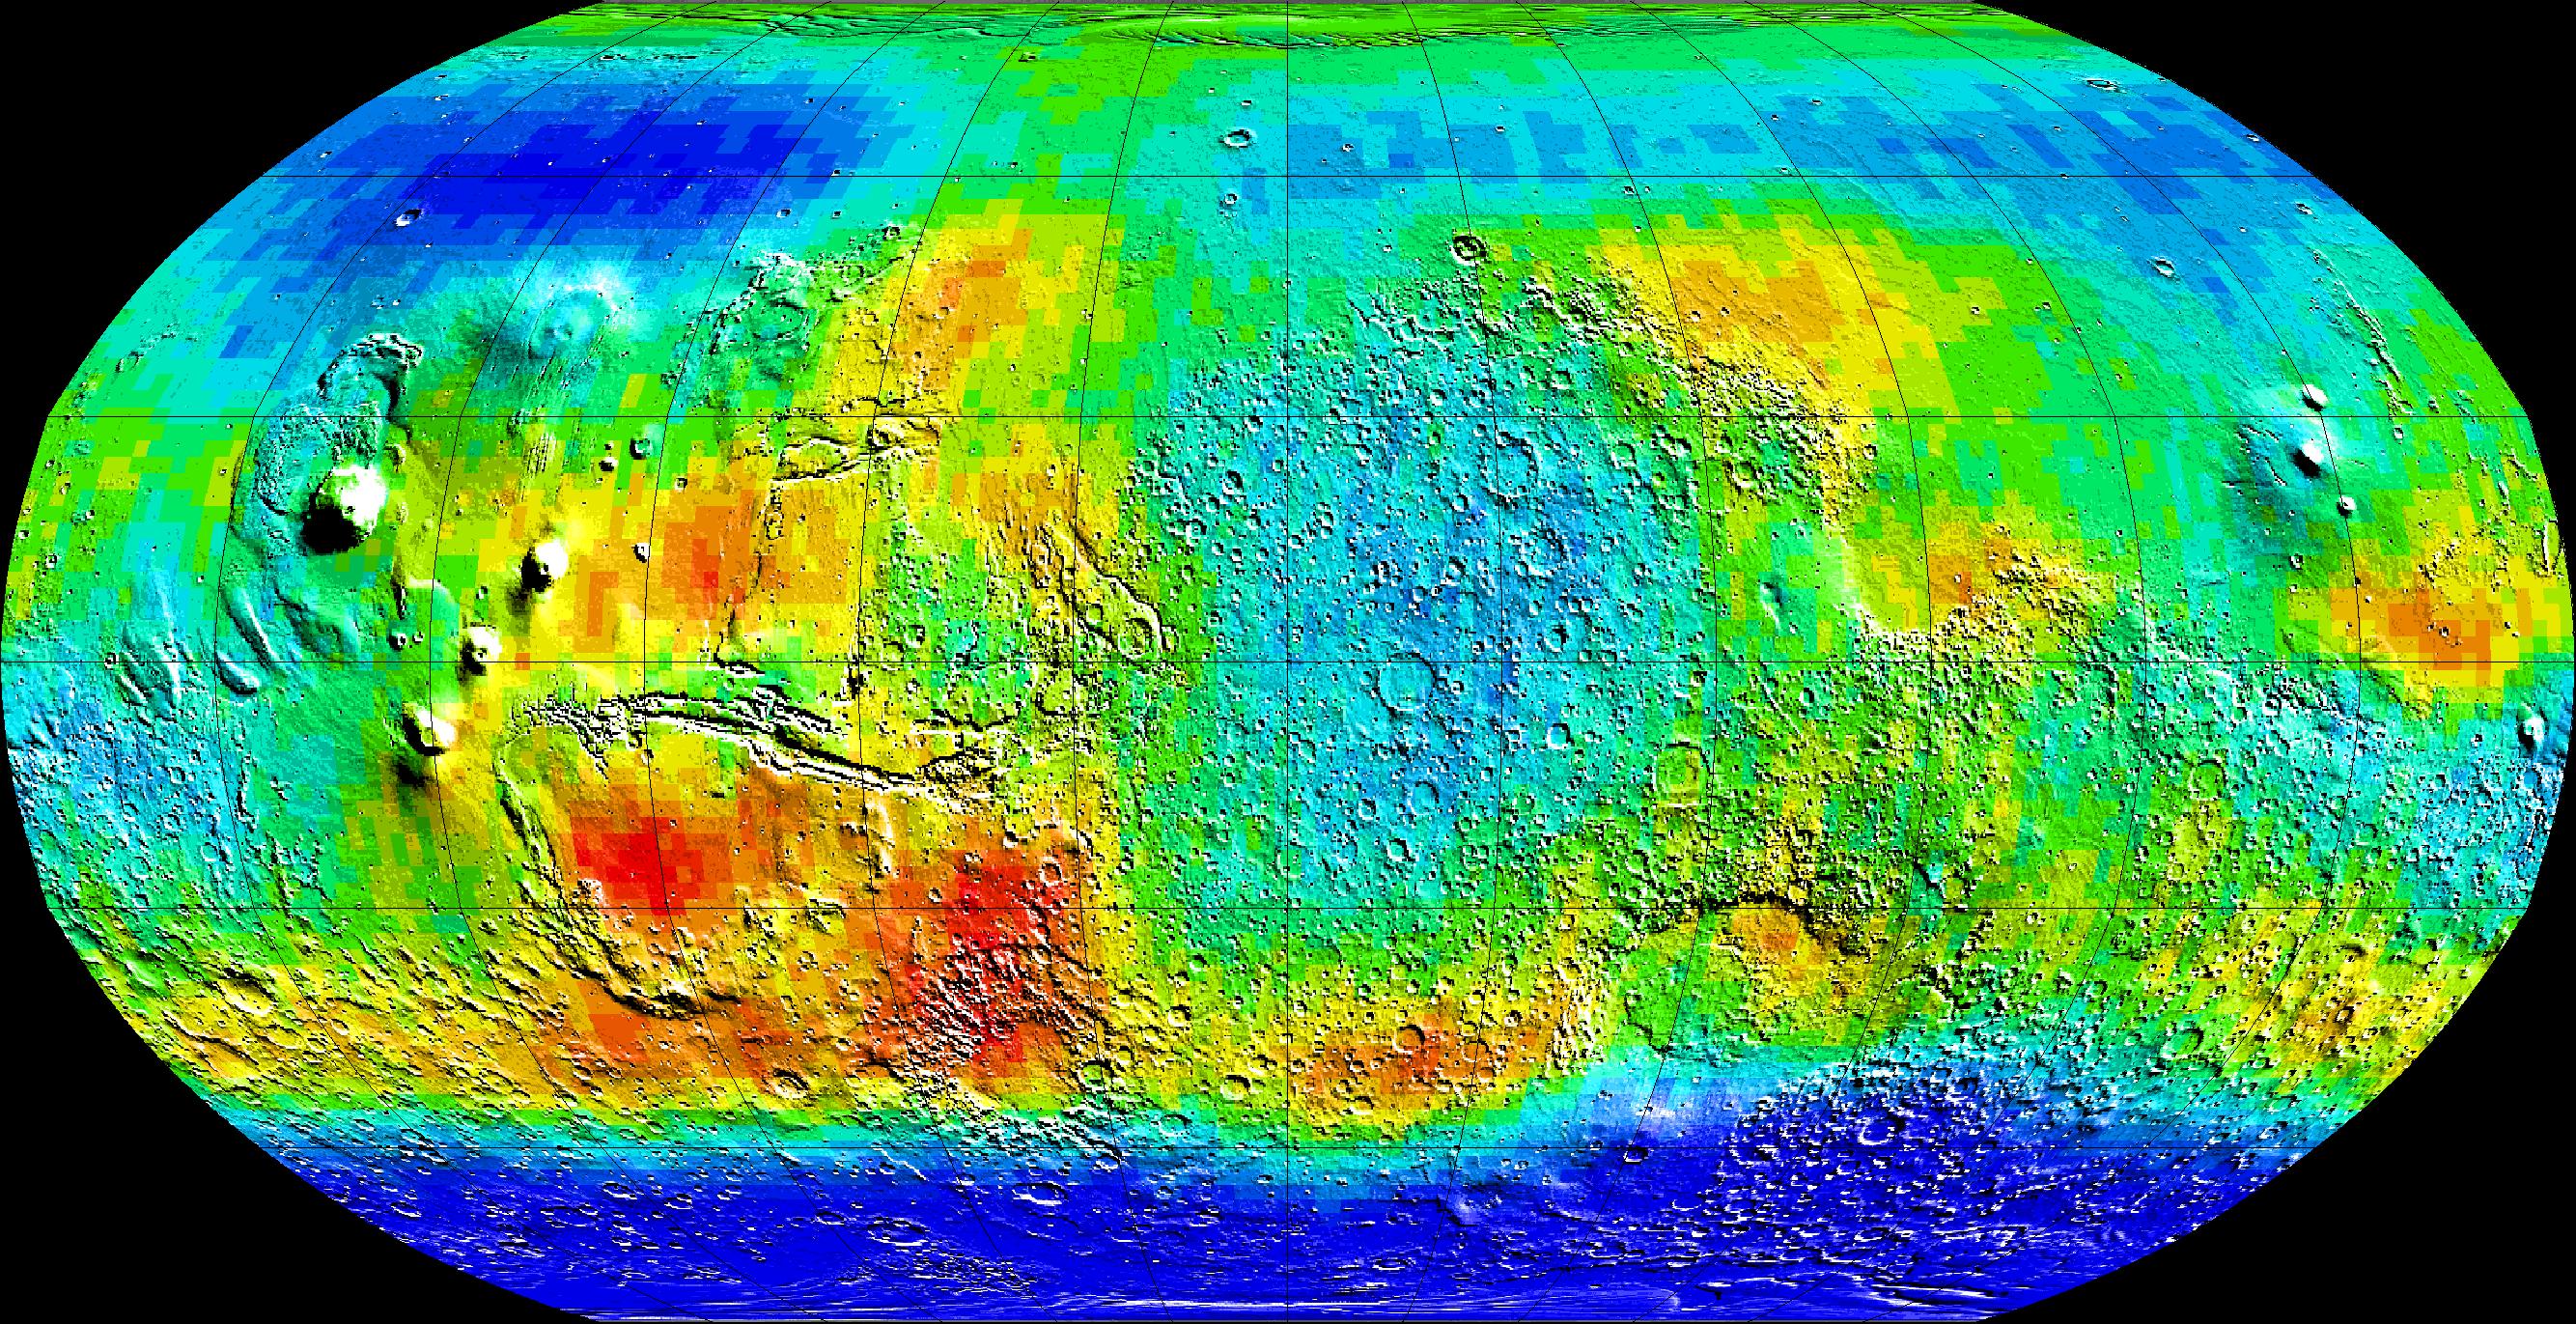
Global Map of Thermal Neutrons
Full Resolution:
TIFF
(1.161 MB)
JPEG
(1.242 MB)
|
|
|
2002-05-28 |
Mars
|
2001 Mars Odyssey
|
Gamma Ray Spectrometer Suite
|
2668x1371x3 |
|
-
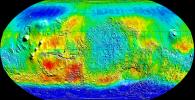
PIA03800:
-
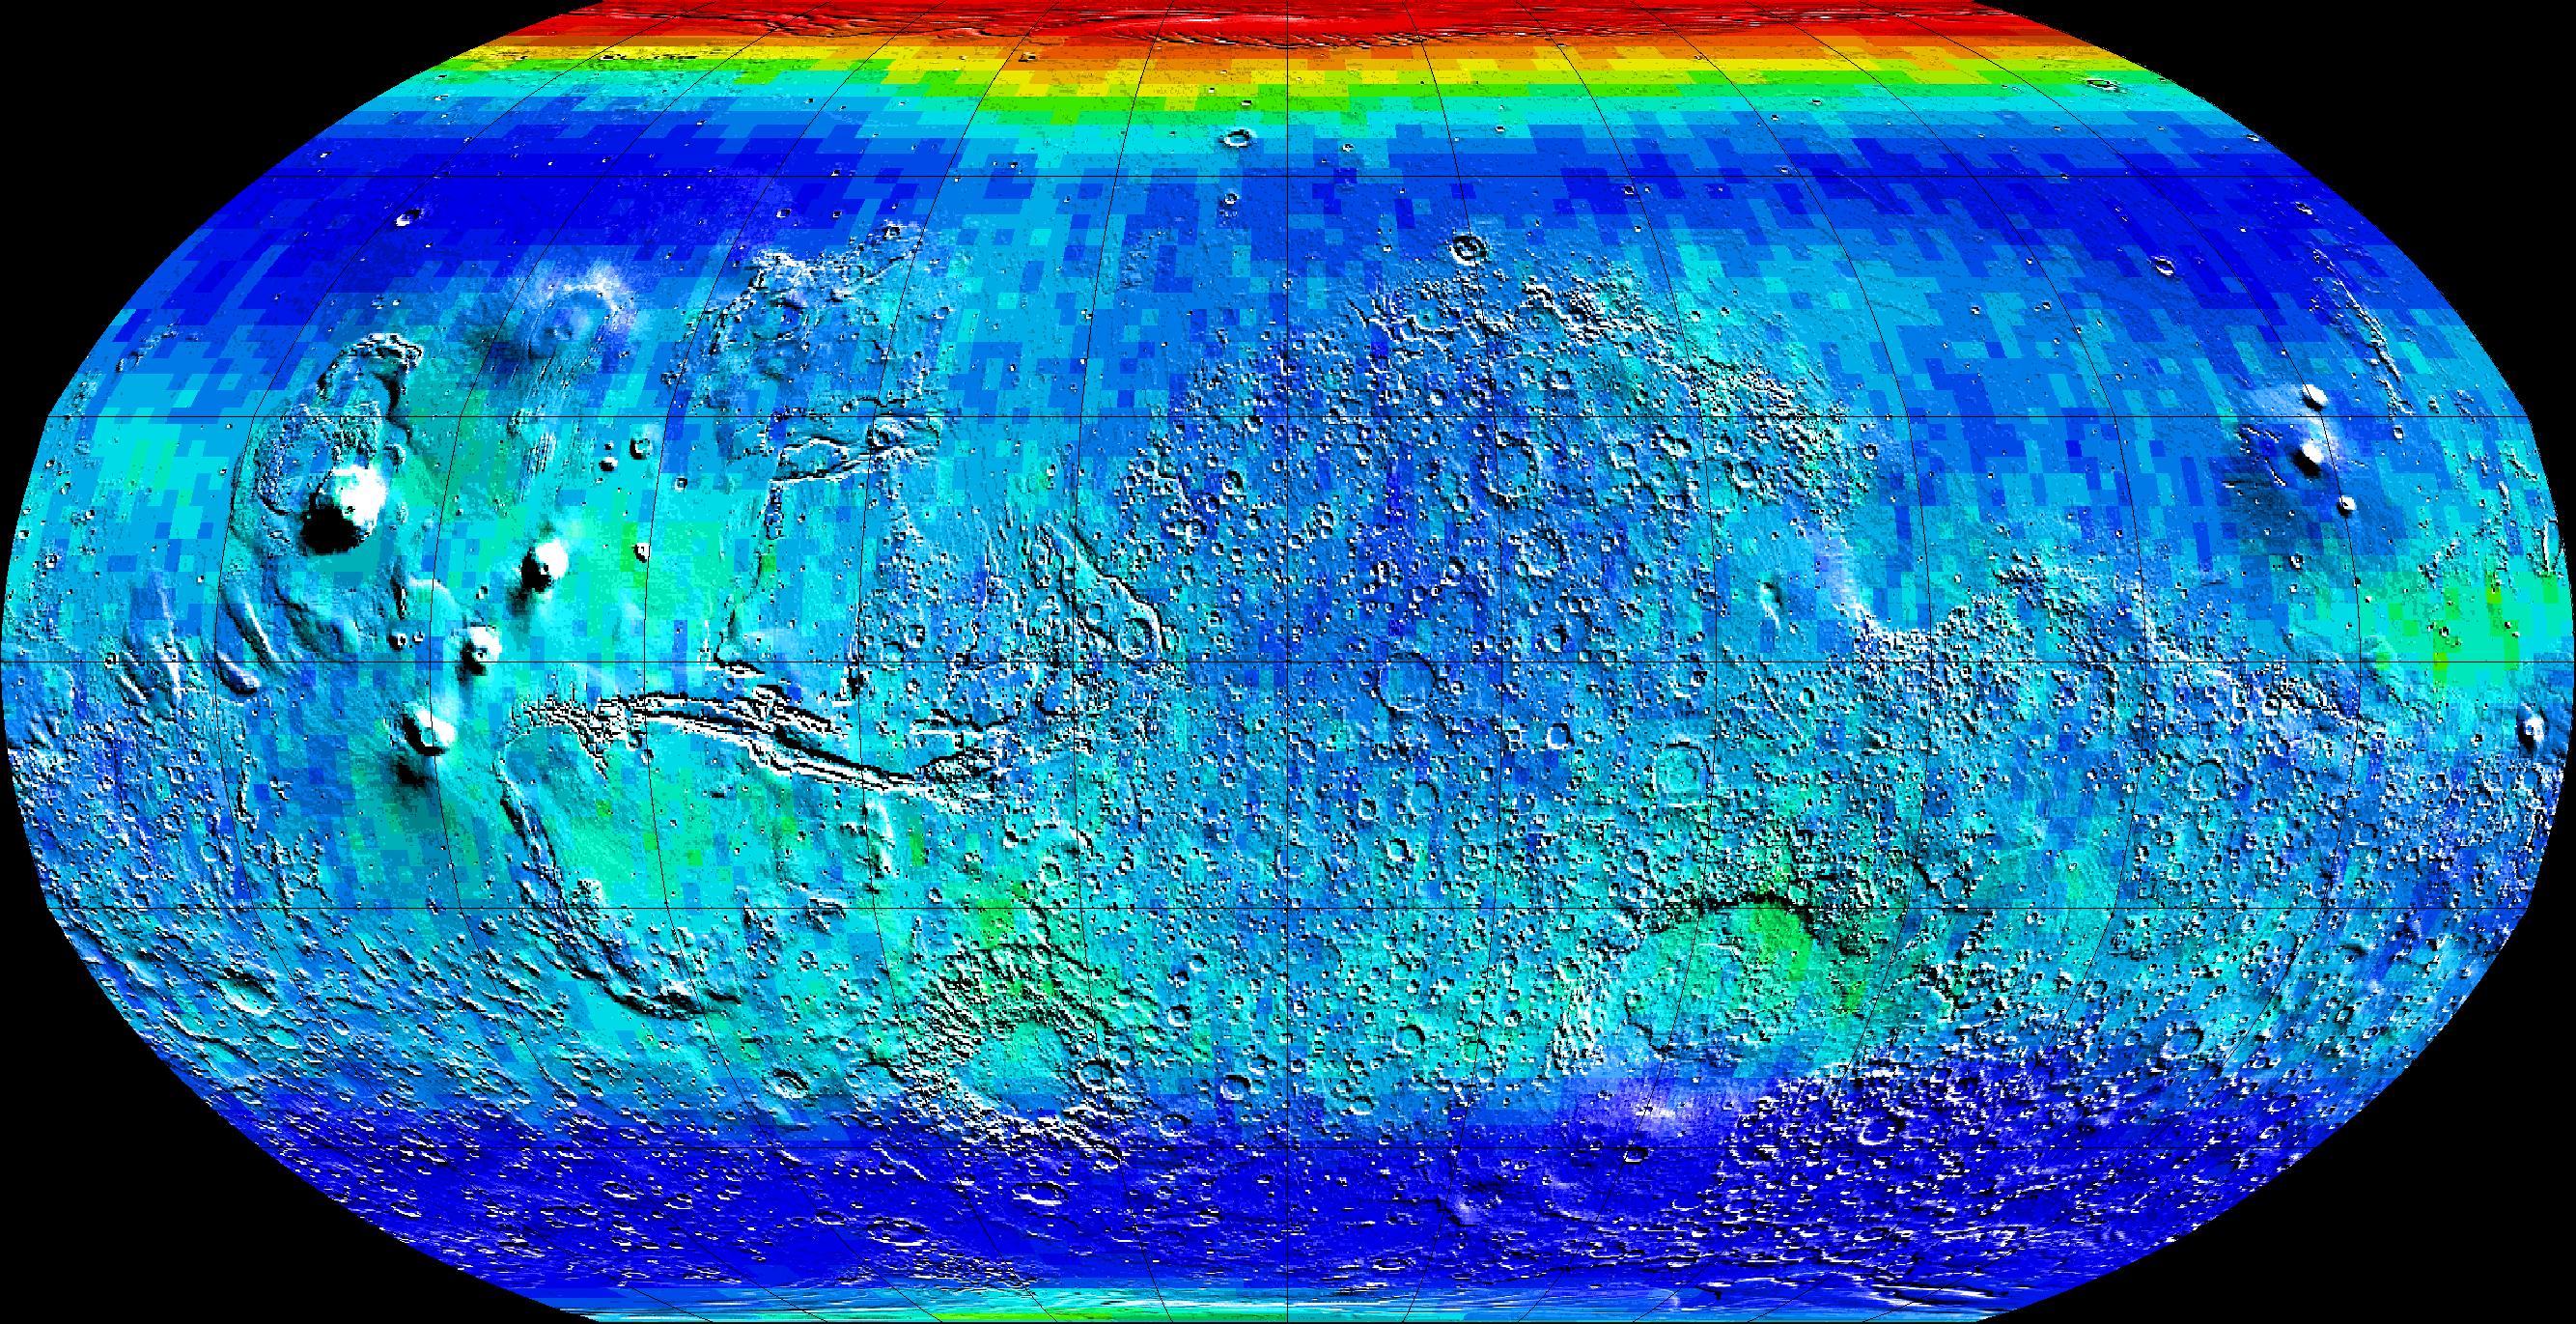
Global Map of Epithermal Neutrons
Full Resolution:
TIFF
(1.268 MB)
JPEG
(1.292 MB)
|
|
|
2002-03-06 |
Mars
|
2001 Mars Odyssey
|
Gamma Ray Spectrometer Suite
|
793x1123x3 |
|
-
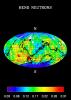
PIA03489:
-
Global Map, High-Energy Neutrons
Full Resolution:
TIFF
(88.48 kB)
JPEG
(141.2 kB)
|
|
|
2002-03-01 |
Mars
|
2001 Mars Odyssey
|
Gamma Ray Spectrometer Suite
|
793x1123x3 |
|
-
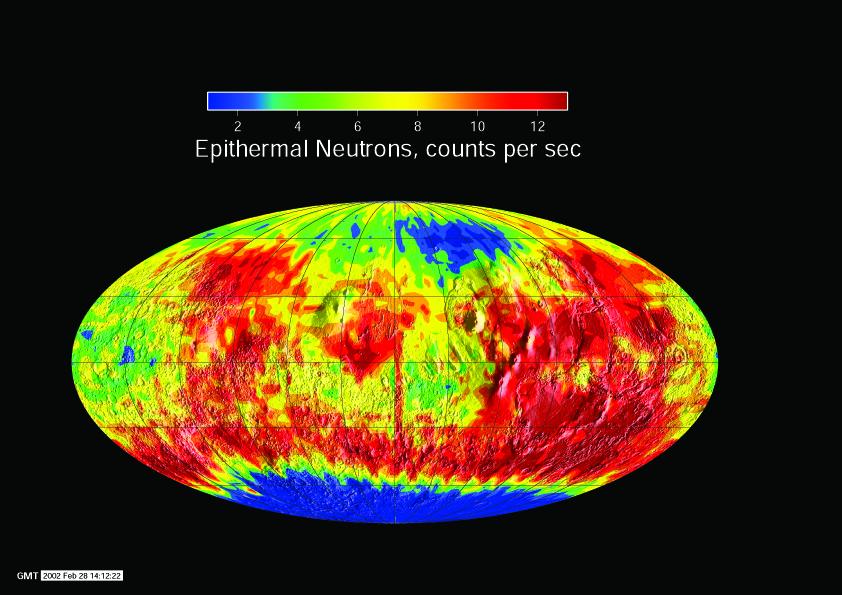
PIA03488:
-
Southern Hemisphere Neutron Map
Full Resolution:
TIFF
(90.83 kB)
JPEG
(131.3 kB)
|
|
|
2002-03-01 |
Mars
|
2001 Mars Odyssey
|
Gamma Ray Spectrometer Suite
|
842x595x3 |
|
-
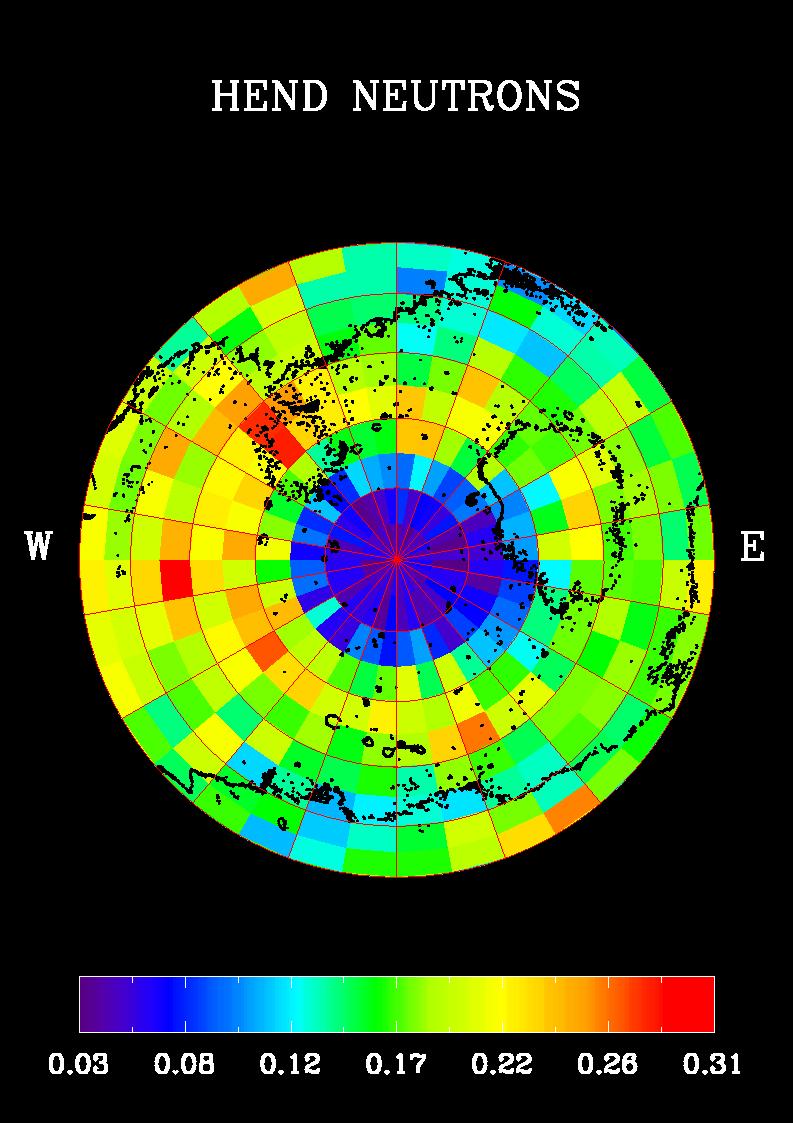
PIA03487:
-
South Pole Neutron View
Full Resolution:
TIFF
(581.8 kB)
JPEG
(80.74 kB)
|
|
|
2002-03-01 |
Mars
|
2001 Mars Odyssey
|
Gamma Ray Spectrometer Suite
|
842x595x3 |

|
-
PIA03486:
-
Global Neutron View
Full Resolution:
TIFF
(579.3 kB)
JPEG
(80.85 kB)
|
 Planetary Data System


