 |  |
| Figure 1 | Figure 2 |
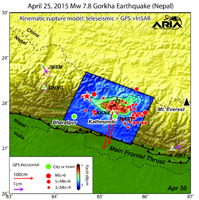
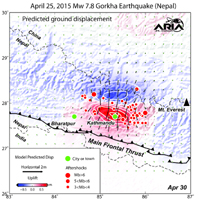
Click on an individual image for higher resolution imageUsing a combination of GPS-measured ground motion data, satellite radar data, and seismic observations from instruments distributed around the world, scientists have constructed preliminary estimates of how much the fault responsible for the April 25, 2015, magnitude 7.8 Gorkha earthquake in Nepal moved below Earth's surface (Figure 1). This information is useful for understanding not only what happened in the earthquake but also the potential for future events. It can also be used to infer a map of how Earth's surface moved due to the earthquake over a broader region (Figure 2).
The maps created from these data can be viewed at PIA19384.
In the first figure, the modeled slip on the fault is shown as viewed from above and indicated by the colors and contours within the rectangle. The peak slip in the fault exceeds 19.7 feet (6 meters). The ground motion measured with GPS is shown by the red and purple arrows and was used to develop the fault slip model. In the second figure, color represents vertical movement and the scaled arrows indicate direction and magnitude of horizontal movement. In both figures, aftershocks are indicated by red dots. Background color and shaded relief reflect regional variations in topography. The barbed lines show where the main fault reaches Earth's surface. The main fault dives northward into the Earth below the Himalaya.
The fault slip model, predictions of surface movement, and the measurements of ground motion were produced by the Advanced Rapid Imaging and Analysis (ARIA) project, a collaboration between NASA's Jet Propulsion Laboratory, Pasadena, California, and the California Institute of Technology (Caltech) in Pasadena and their partners at the Canada Centre for Mapping and Earth Observation, Natural Resources Canada. All original GPS data are from a network installed by Caltech with support from the Gordon and Betty Moore Foundation.
For more information about ARIA, visit: http://aria.jpl.nasa.gov.

