Annotated Version
Click on the image for larger versionNASA and its partners are contributing important observations and expertise to the ongoing response to the April 25, 2015, magnitude 7.8 Gorkha earthquake in Nepal. This earthquake was the strongest to occur in that area since the 1934 Nepal-Bihar magnitude 8.0 event. It has caused a significant humanitarian crisis with widespread building damage and triggered landslides throughout the region.
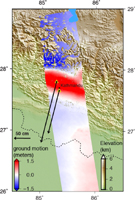
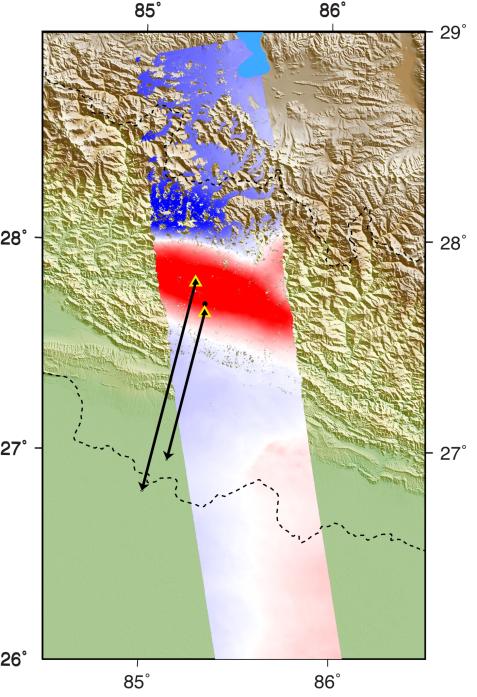
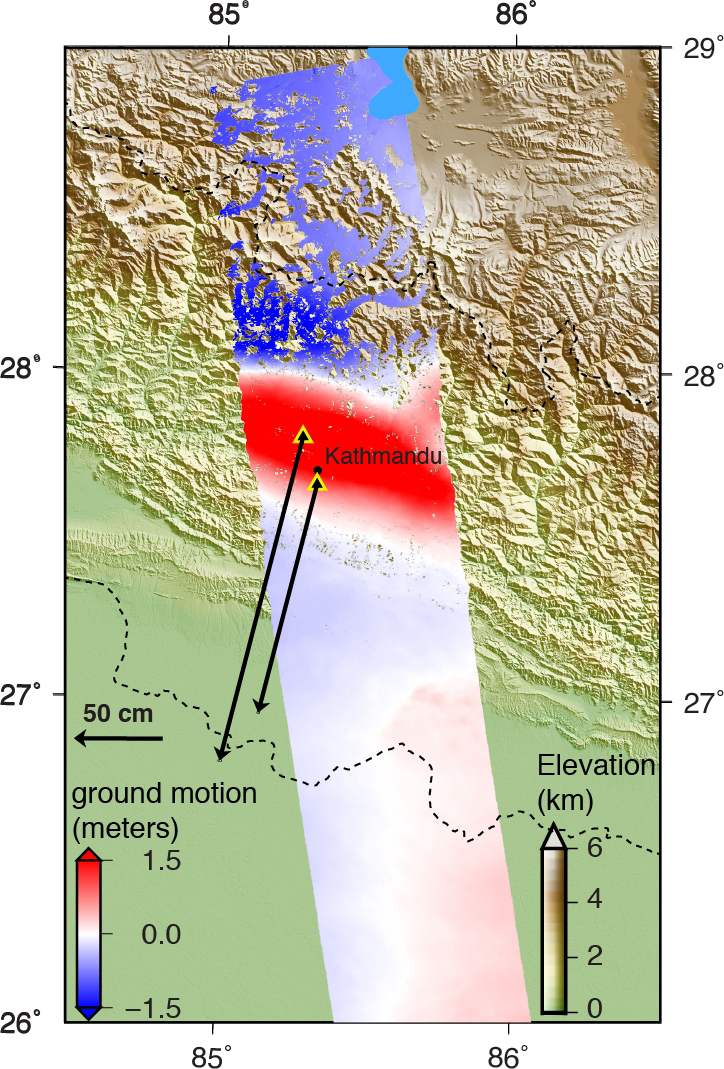
Scientists with the Advanced Rapid Imaging and Analysis project (ARIA), a collaboration between NASA's Jet Propulsion Laboratory, Pasadena, California, and the California Institute of Technology in Pasadena, analyzed interferometric synthetic aperture radar images from the PALSAR-2 instrument on the ALOS-2 satellite operated by the Japan Aerospace Exploration Agency (JAXA) to calculate a map of the deformation of Earth's surface caused by the quake. This false-color map shows the amount of permanent surface movement caused almost entirely by the earthquake, as viewed by the satellite, during a 70-day interval between two ALOS-2 images acquired on February 21 and May 2, 2015.
In this new map, the colors of the surface displacements are proportional to the surface motion. The red tones show the areas where the land around Kathmandu has moved toward the satellite by up to 4.6 feet (1.4 meter), or 5.2 feet (1.6 meters) if purely vertical motion is assumed. The area farther north with various shades of blue moved away from the satellite, mostly downward, by as much as 3.9 feet (1.2 meters). Areas without color have snow, heavy vegetation or open water that prevents the radar measurements from measuring change between satellite images. The background image shows the shaded relief and colored elevation from the NASA Shuttle Radar Topography Mission (SRTM). Black arrows show the horizontal motion measured by continuously operating Global Positioning System (GPS) sites (yellow and black triangles). Scientists use these maps to build detailed models of the fault slip at depth and associated land movements to better understand the impact on future earthquake activity. These data have been integrated into the U.S. Geological Survey ShakeMap (available at: http://earthquake.usgs.gov/earthquakes/eventpage/us20002926#impact_shakemap) to update their estimate of the intensity of ground shaking caused by the main shock of the quake. The PALSAR-2 data were provided by JAXA through the Committee on Earth Observation Satellites (CEOS) in support of the response effort. Dashed black lines show the country borders.
The map created from these data can be viewed at PIA14708.
The KMZ file for viewing the radar measurement image in Google Earth is available at http://aria-share.jpl.nasa.gov/events/20150425-Nepal_EQ/interferogram/ARIA_Coseismic_ALOS2_interferogram_PathA157_20150221_0502_1_5m.kmz.
For more information about ARIA, visit http://aria.jpl.nasa.gov.