Click here for animation (.gif)
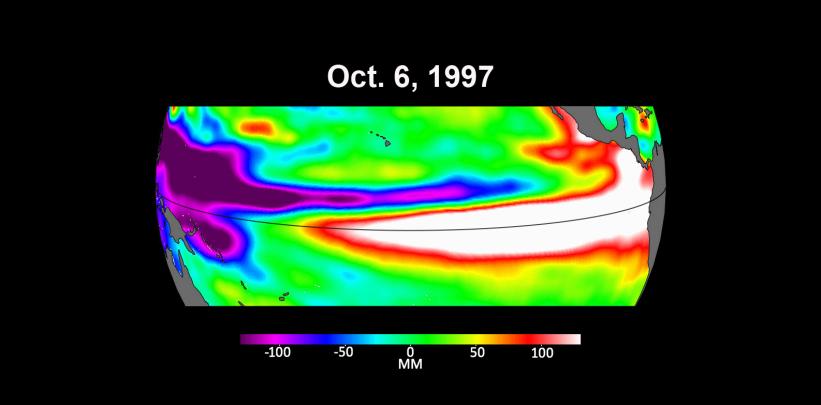
These three maps based on satellite data show sea levels in the Pacific Ocean during developing El Niño events in early October of 1997, 2015, and 2023. Higher-than-average ocean heights are shown in red and white, while lower-than-average heights are blue and purple.
The two earlier maps represent the two extreme El Niño events from the past 30 years – the first from 1997 to 1998 and the second from 2015 to 2016. Both caused shifts in global air and ocean temperatures, atmospheric wind and rainfall patterns, and sea level.
El Niños are characterized by higher-than-normal sea levels and warmer-than-average ocean temperatures along the equatorial Pacific. Water expands as it warms, so sea levels tend to be higher in places with warmer water. These temperature and sea level conditions can then propagate poleward along the western coasts of the Americas.
El Niños can bring wetter conditions to the U.S. Southwest and drought to regions in the western Pacific, including Indonesia. Not all El Niño events are created equal, however, and their impacts vary widely. Satellites like the U.S.-European Sentinel-6 Michael Freilich, which captured the 2023 data, help anticipate those impacts on a global scale by tracking changes in sea surface height in the Pacific Ocean. The TOPEX/Poseidon satellite collected the 1997 data while Jason-2 collected data for the 2015 event. This year's El Niño is still developing, but researchers are looking to the recent past for clues as to how it is shaping up.
By October 1997 and 2015, large areas of the central and eastern Pacific had sea levels more than 7 inches (18 centimeters) higher than normal. This year, sea levels are about 2 or 3 inches (5 to 8 centimeters) higher than normal and are elevated over a smaller area compared to the 1997 and 2015 events. Both of the past El Niños reached peak strength in late November or early December, so this year's event may still intensify.
Launched in November 2020, Sentinel-6 Michael Freilich is named after former NASA Earth Science Division Director Michael Freilich. The satellite is one of two that compose the Copernicus Sentinel-6/Jason-CS (Continuity of Service) mission.
Sentinel-6/Jason-CS was jointly developed by ESA (European Space Agency), the European Organisation for the Exploitation of Meteorological Satellites (EUMETSAT), NASA, and the National Oceanic and Atmospheric Administration, with funding support from the European Commission and technical support on performance from the French space agency CNES (Centre National d'Études Spatiales). Spacecraft monitoring and control, as well as the processing of all the altimeter science data, is carried out by EUMETSAT on behalf of the European Union's Copernicus programme, with the support of all partner agencies.
NASA's Jet Propulsion Laboratory, a division of Caltech in Pasadena, contributed three science instruments for each Sentinel-6 satellite: the Advanced Microwave Radiometer, the Global Navigation Satellite System - Radio Occultation, and the Laser Retroreflector Array. NASA also contributed launch services, ground systems supporting operation of the NASA science instruments, the science data processors for two of these instruments, and support for the U.S. members of the international Ocean Surface Topography Science Team.
 Planetary Data System


