On Nov. 27, 2022, Mauna Loa, Earth's largest active volcano, began erupting from the summit caldera inside Hawaii Volcanoes National Park.
Scientists with the Advanced Rapid Imaging and Analysis project (ARIA), a collaboration between NASA's Jet Propulsion Laboratory and the California Institute of Technology, which manages JPL for the agency, analyzed synthetic aperture radar images from the Copernicus Sentinel-1 satellites operated by ESA (European Space Agency) to calculate a map of the Earth's ground movement as a result of the eruption.
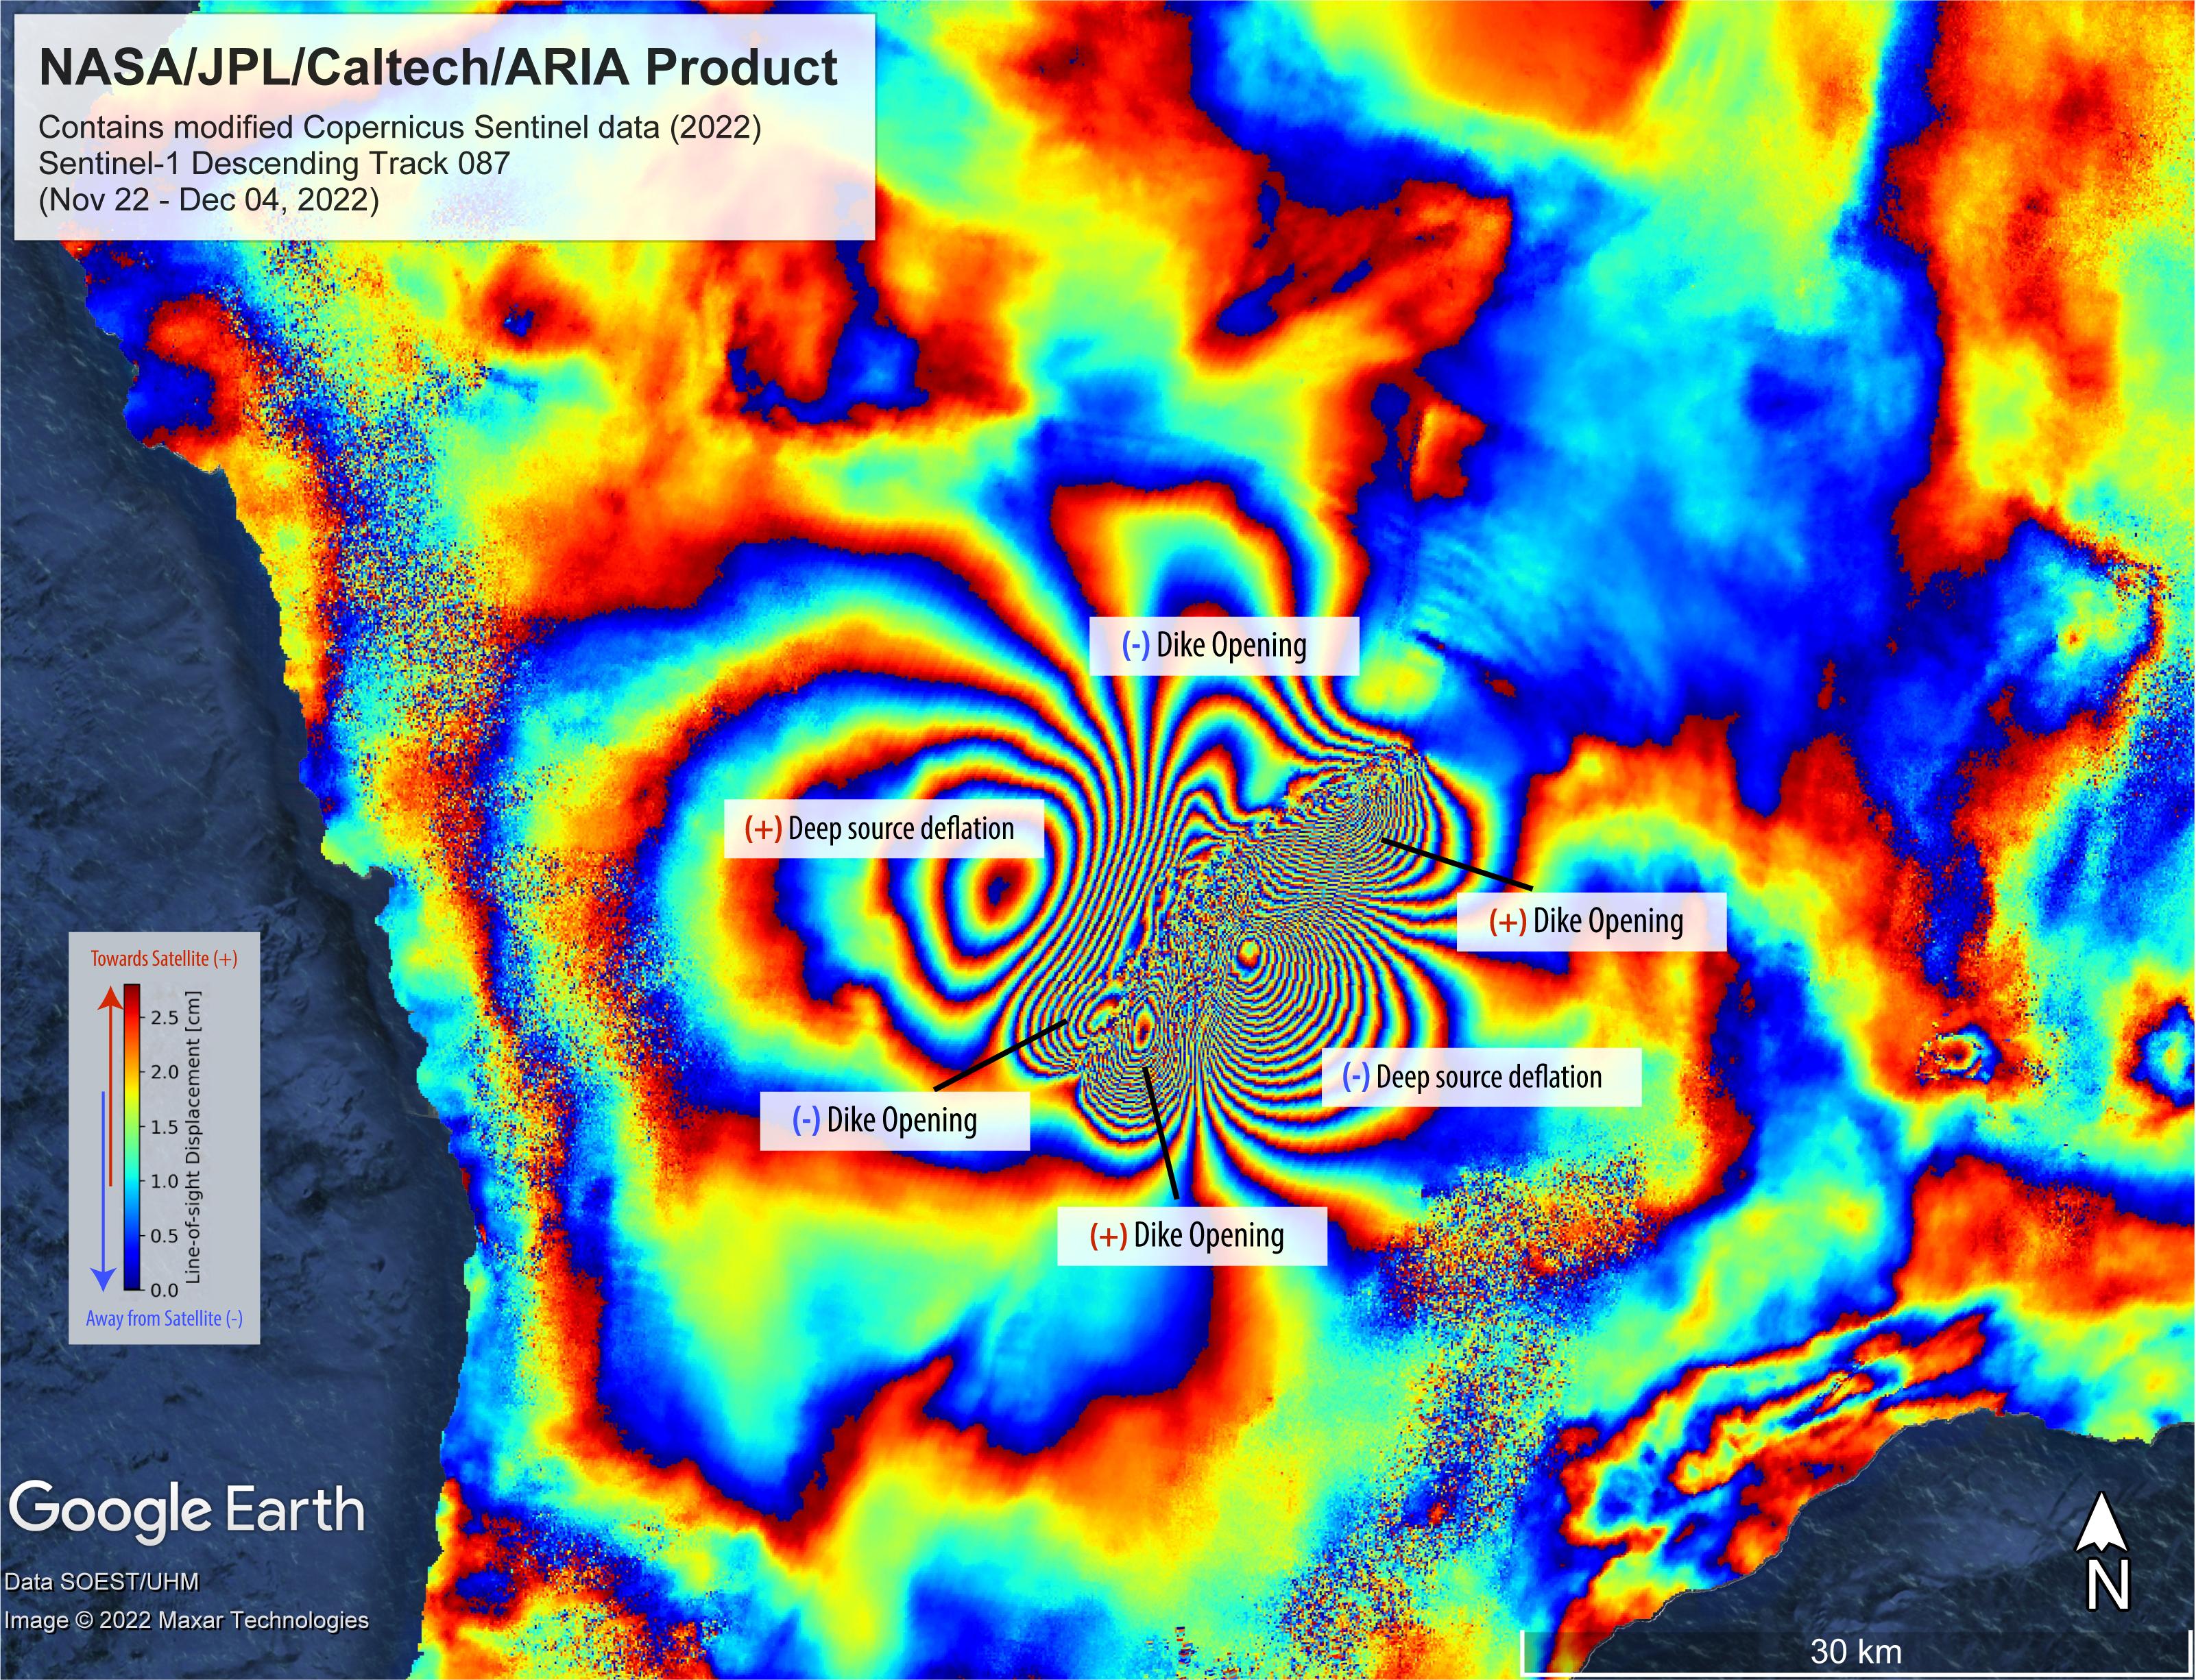
Using images acquired before and after the start of the eruption – Nov. 22 and Dec. 4, 2022, respectively – scientists produced this false-color map showing the amount of ground surface movement, or displacement, the eruption caused.
In the map, surface displacements are seen as color contours, or "fringes," where each color cycle represents about 2.8 centimeters of surface motion. The direction of the ground movement (whether toward or away from the satellite) is indicated by the color cycle (from outer to inner direction). A positive (+) indication, meaning "ground moved towards satellite," has a color cycle of blue-green-yellow-orange-red. A negative (-) indication, meaning "ground moved away from the satellite," has a color cycle of red-orange-yellow-green-blue.
The broader fringes are representative of deep source processes within the volcano. In this case, a broad tabular source of magma deflated and fed the eruption as magma or lava was being supplied, somewhat like a deflating balloon (only tabular in shape) that shrank because pressure was relieved. The dense fringes marked as "dike opening" are a signature of the ground rupturing (or opening) as the magma made its way towards the Earth's surface.
Scientists use these maps to build detailed models of subsurface volcanic processes to better forecast and understand the impact of future volcanic activity.
The Sentinel-1 data were provided by ESA. The image contains modified Copernicus 2022 data, processed by ESA and analyzed by NASA-JPL.
More information on ARIA can be found here: https://aria.jpl.nasa.gov/.
