PDS logoPlanetary Data System
PDS Information
Find a Node - Use these links to navigate to any of the 8 publicly accessible PDS Nodes.

This bar indicates that you are within the PDS enterprise which includes 6 science discipline nodes and 2 support nodes which are overseen by the Project Management Office at NASA's Goddard Space Flight Center (GSFC). Each node is led by an expert in the subject discipline, supported by an advisory group of other practitioners of that discipline, and subject to selection and approval under a regular NASA Research Announcement.
Click here to return to the Photojournal Home Page Click here to view a list of Photojournal Image Galleries Photojournal_inner_header
Latest Images  |  Spacecraft & Technology  |  Animations  |  Space Images App  |  Feedback  |  Photojournal Search  

PIA24905: Tonga Eruption Atmospheric Wave
 Target Name:  Earth
 Mission:  Global Differential Global Positioning System (GDGPS) 
 Product Size:  3600 x 3000 pixels (w x h)
 Produced By:  JPL
 Full-Res TIFF:  PIA24905.tif (3.165 MB)
 Full-Res JPEG:  PIA24905.jpg (1.025 MB)

Click on the image above to download a moderately sized image in JPEG format (possibly reduced in size from original)

Original Caption Released with Image:

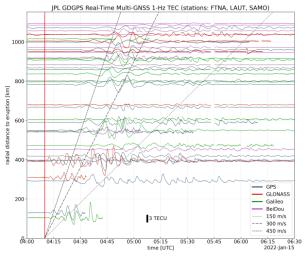
Real-time data collected by the Global Differential Global Positioning System network, operated by NASA's Jet Propulsion Laboratory, shows the atmospheric signature of the Hunga Tonga Hunga Ha'apai volcanic eruption in Tonga on Jan. 15, 2022.

The data is a measure of the density of electrons (known as total electron content units, or TECU) in the ionosphere – the outermost layer of the atmosphere, which starts between 50 and 56 miles (80 to 90 kilometers) above Earth's surface. Navigation radio signals, like those received by location sensors on smartphones, are broadcast by global navigation satellite systems (GNSS) and experience delays when passing through the ionosphere. The extent of the delay depends on the density of electrons within the path of the GNSS signal in this atmospheric layer.

When an explosive event such as a volcanic eruption or large earthquake injects energy into the atmosphere, the pressure waves from that event change the electron density in the ionosphere. These perturbations show up as tiny changes to the delays that GNSS radio signals usually experience as they pass through the atmosphere.

The vertical red line in the data plot indicates the time of the eruption. The horizontal squiggles show electron density profiles picked up in the signals of four GNSS constellations, or groups of satellites: GPS, GLONASS, Galileo, and BeiDou. The slanted dashed and dotted lines indicate the velocity of waves.

Image Credit:
NASA/JPL-Caltech/GDGPS

Image Addition Date:
2022-01-27