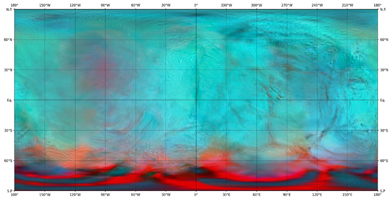
Figure 1, Annotated Image
Click on the image for larger versionThis infrared global map of Saturn's icy moon Enceladus was created using images acquired by NASA's Cassini spacecraft. It is a companion to the global views presented in PIA24023.
It combines infrared maps obtained by the spacecraft's Visual and Infrared Mapping Spectrometer (VIMS), published by Robidel et al. (2020), and the visible map from the Imaging Science Subsystem (ISS), published by Bland et al. (2018).
The colors used in this map represent infrared data collected by the VIMS instrument. The red color channel corresponds to a ratio of Enceladus' brightness observed at 3.1 microns divided by its brightness at 1.65 microns; the green channel corresponds to the brightness at 2.0 microns; and the blue channel corresponds to the brightness at 1.8 microns. These colors highlight the location of fresh crystalline ice, indicated by a red tint. Researchers also superimposed a high-resolution map of the moon's surface taken with the ISS camera (clear filter images), in order to show geologic features.
Figure 1 shows a version of the map with a latitude/longitude grid.
All seams and spurious artifacts were removed to produce a globally smooth image used in the orthographic views published in PIA24023.
This map is an equirectangular projection center at 0° longitude. The mean radius of Enceladus used for the projection of this map is 252.1 km (corresponding to a scale of 200 meters per pixel at the equator).
References:
- Robidel et al. (2020) - https://doi.org/10.1016/j.icarus.2020.113848
- Bland et al (2018) - https://doi.org/10.1029/2018EA000399
More information about Cassini can be found here: https://solarsystem.nasa.gov/cassini.

