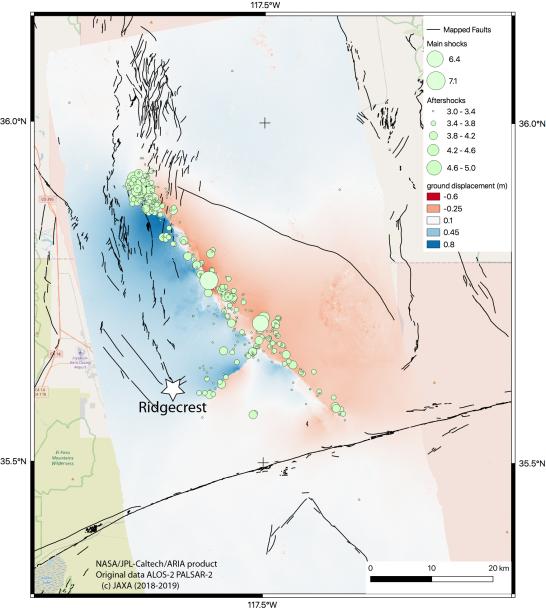
The Advanced Rapid Imaging and Analysis (ARIA) team at NASA's Jet Propulsion Laboratory in Pasadena, California, created this map of the Ridgecrest area of Southern California following two strong earthquakes — a magnitude 6.4 on July 4 and a magnitude 7.1 on July 5, 2019. The map shows how much and in what direction the ground moved in various places, displayed in meters.
The blue tones show that the ground west of the main fault rupture, which runs from the lower right to the upper left, moved toward the northwest by as much as 0.8 meters (2.7 feet) during the 7.1-magnitude quake. The ground in the red and pink areas moved southeast by as much as 0.6 meters (2 feet). Black lines show faults that were mapped before the 2019 earthquakes.
The 6.4-magnitude quake moved a shorter fault that runs perpendicular to the main fault — shown slightly down and to the left of center on the map. The colors in this area show that the north side of the fault moved to the west (blue) and the south side moved to the east (pink). The green circles correspond to aftershocks of a magnitude of 3.0 or higher, which were detected along both faults, between July 4 and July 9. The larger the circle, the stronger the aftershock.
The ARIA team used interferometric synthetic aperture radar (InSAR) analysis of data from the ALOS-2 satellite, operated by the Japan Aerospace Exploration Agency (JAXA) to create the map. They used images captured before the quakes (on April 16, 2018) and after the quakes (on July 8, 2019) for this analysis.
State and federal scientists including California Geological Survey and USGS are using this map and others like it in the field for assessing the damages and mapping the faults that broke during the two major earthquakes as well as the thousands of aftershocks.
NASA's Earth Science Disasters Program is in communication with the California Earthquake Clearinghouse, which is coordinating response efforts with the California Air National Guard, the U.S. Geological Service and the Federal Emergency Management Agency. NASA analysts are using data from satellites to produce visualizations of land deformation and potential landslides, among other earthquake impacts, and are making them available to response agencies. NASA's Disasters Program promotes the use of satellite observations in predicting, preparing for, responding to and recovering from disasters around the world.
The JAXA provided the ALOS-2 data for the production of the map. The background map is from the OpenStreetMap consortium. The ARIA team's analysis was funded by NASA's Disasters and Earth Surface and Interior Programs.
For more information about ARIA, visit http://aria.jpl.nasa.gov.
For more information about NASA's Disasters Program, visit http://disasters.nasa.gov.
 Planetary Data System


