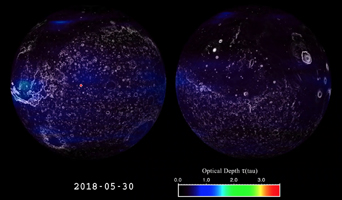
Click on the image for larger animationThis animation shows the evolution of the 2018 Mars global dust storm from late May to September. The animation shows the optical depth tau -- a measure of how much light is being blocked by atmospheric dust as measured by the Mars Climate Sounder instrument onboard NASA's Mars Reconnaissance Orbiter.
NASA's Opportunity rover is marked with a red dot. The dust is mapped to two opposite hemispheres of Mars, giving a view of the full globe. Certain features of the Martian terrain, including Olympus Mons, the three volcanoes in the equatorial region, and Vallis Marineris, are also visible.
The data shows the daily global column of dust, illustrating how the dust behaves over the course of the storm. The storm has a complex growth affecting most of Mars over the first month. It then remains near the peak for three weeks. Finally, the storm starts a multi-month decay back to regular weather.
A color scale in the lower right-hand corner of the animation explains the colors in relation to approximate tau values. A tau of three indicates that only about 5 percent of the sunlight entering the atmosphere directly reaches the surface.
NASA's Jet Propulsion Laboratory, a division of Caltech in Pasadena, California, manages the Mars Reconnaissance Orbiter Project for NASA's Science Mission Directorate, Washington, and leads the Mars Climate Sounder investigation.

