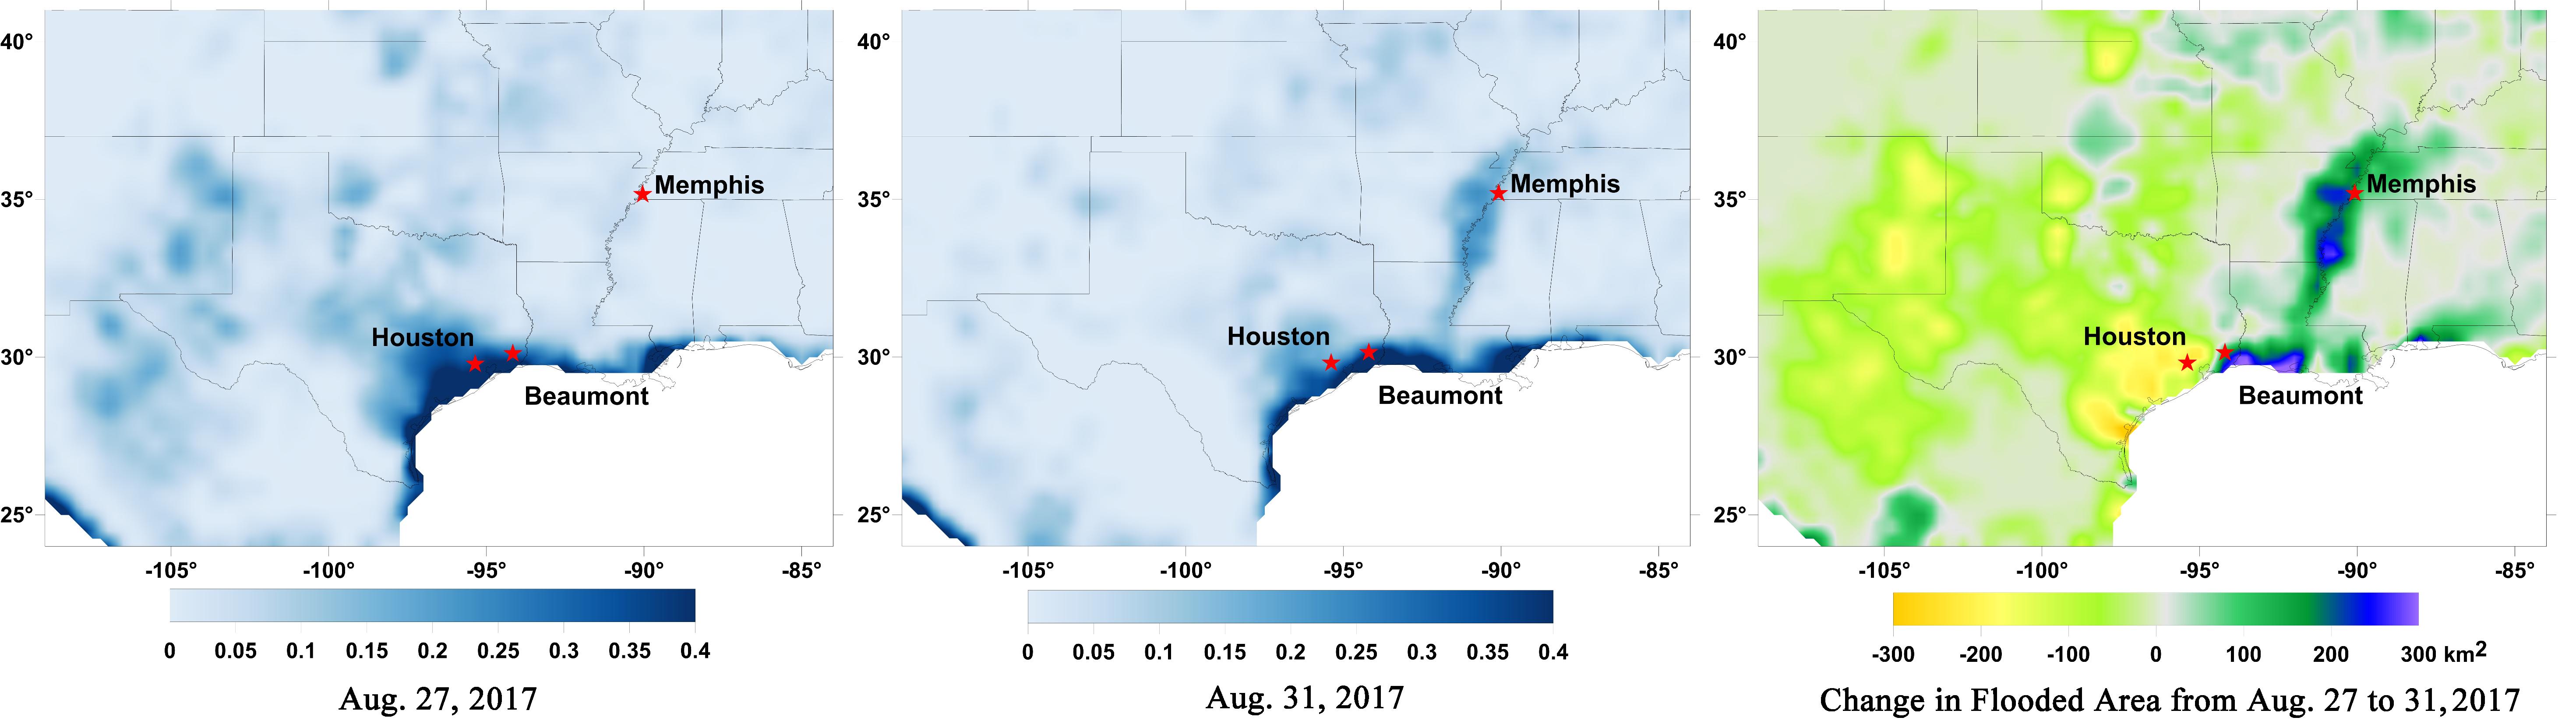
Data from NASA's Soil Moisture Active Passive (SMAP) satellite have been used to create new surface flooding maps of Southeast Texas and the Tennessee Valley following Hurricane Harvey. The SMAP observations detect the proportional cover of surface water within the satellite sensor's field of view. This sequence of images shows changes in the extent of surface flooding from successive five-day SMAP observation composite images. Widespread flooding can be seen in the Houston metropolitan area on Aug. 27 following record rainfall from the Category 4 hurricane, which made landfall on Aug. 25th, 2017 (left image). Flood waters around Houston had substantially receded by Aug. 31 (middle image), while flooding had increased across Louisiana, eastern Arkansas, and western Tennessee as then Tropical Storm Harvey passed over the area. The far right image shows the change in flooded area between Aug. 27 and Aug. 31, with regions showing the most flooding recession depicted in yellow and orange shades and those where flooding had increased depicted in blue shades. The SMAP satellite has a low-frequency (L-band) microwave radiometer with enhanced capabilities for detecting surface water changes in nearly all weather conditions and under low-to-moderate vegetation cover. SMAP provides global coverage with one-to-three-day repeat sampling that is well suited for global monitoring of inland surface water cover dynamics.
SMAP is managed for NASA's Science Mission Directorate by NASA's Jet Propulsion Laboratory in Pasadena, California, and NASA's Goddard Space Flight Center in Greenbelt, Maryland. JPL is managed for NASA by Caltech. A consortium of researchers from other universities participate on the SMAP mission science team, including the Massachusetts Institute of Technology, Princeton University and the University of Montana, which provided the SMAP surface water imagery.
For more information about SMAP, visit http://smap.jpl.nasa.gov.
 Planetary Data System


