Click on an individual image for larger viewsOn Sept. 16, 2015, a magnitude 8.3 earthquake struck near the coast of central Chile along the boundary of the Nazca and South American tectonic plates. Dubbed the Illapel earthquake, the shaking lasted at least three minutes and propelled a 15-foot (4.5-meter) tsunami that washed into Coquimbo and other coastal areas. Smaller tsunami waves raced across the Pacific and showed up on the shores of Hawaii and other islands. The earthquake and tsunami caused substantial damage in several Chilean coastal towns, and at least 13 deaths have been reported. Demanding building codes and extensive disaster preparedness helped to limit the loss of life and property.
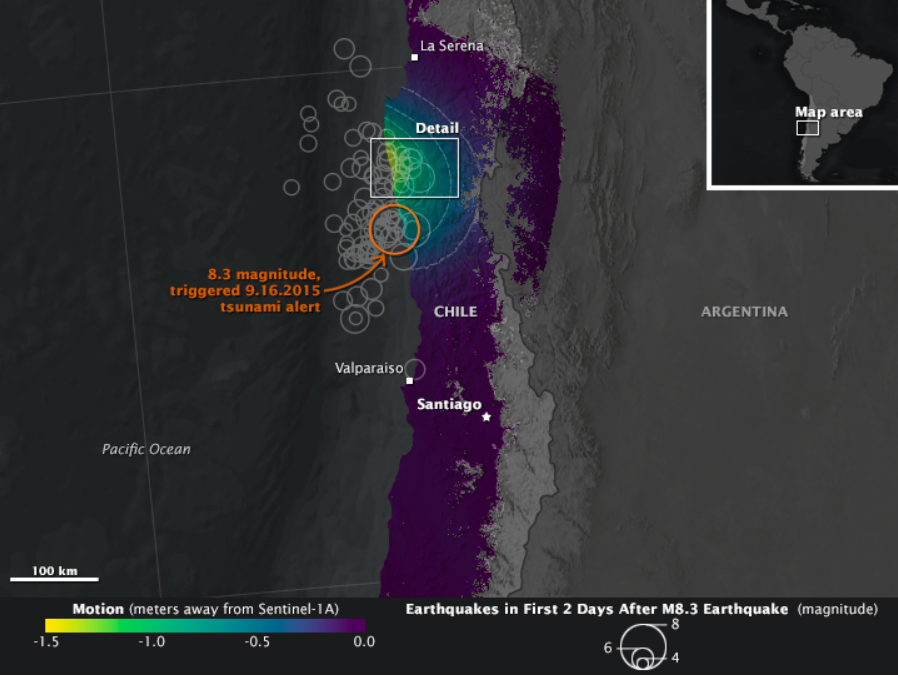
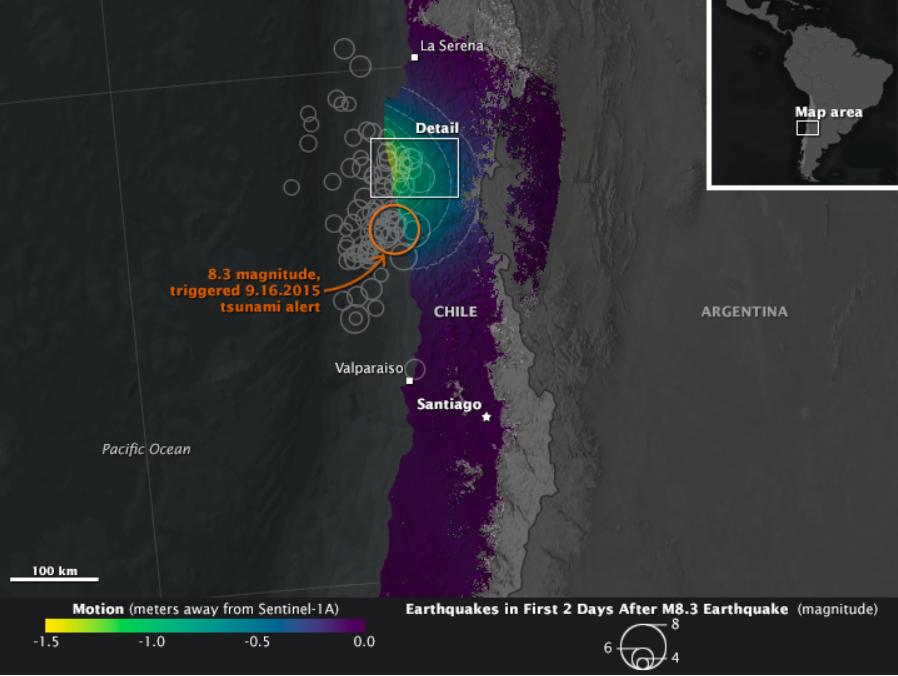
The maps above, known as interferograms, show how the quake moved the ground, as observed by the Copernicus Sentinel-1A satellite (operated by the European Space Agency) and reported by ground stations to the U.S. Geological Survey. Sentinel-1A carries a synthetic aperture radar (SAR) instrument, which beams radio signals toward the ground and measures the reflections to determine the distance between the ground and the satellite. By comparing measurements made on Aug. 24 and Sept. 17, Cunren Liang, Eric Fielding, and other researchers from NASA's Jet Propulsion Laboratory were able to determine how the land surface shifted during and after the earthquake.
Interferograms can be used to estimate where the fault moved deep in Earth and which areas have increased stress and higher likelihood of future earthquakes. The details can also provide important information to better understand the earthquake process.
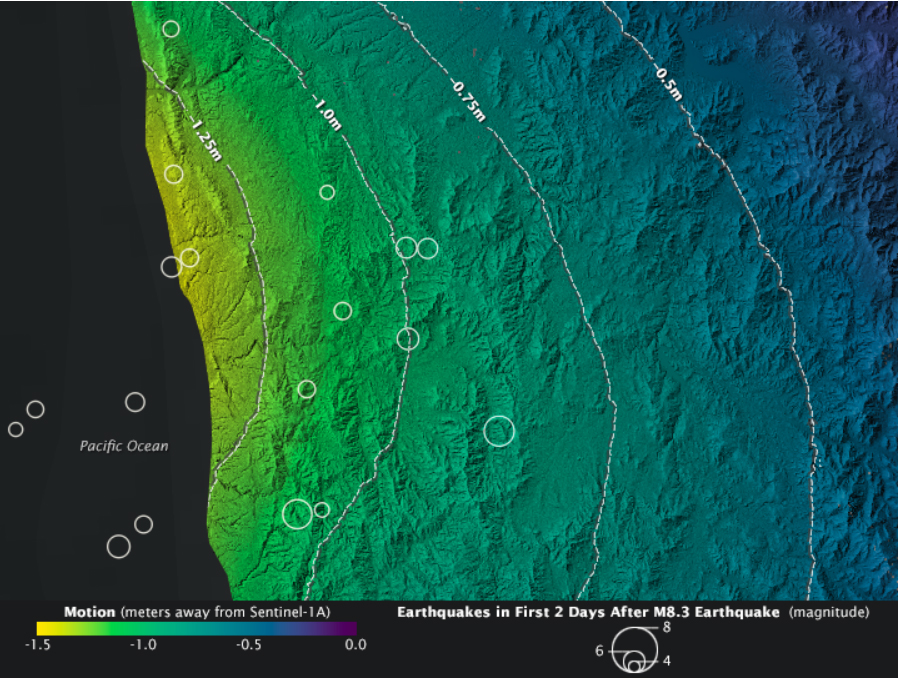
On both the close-up and the broad-view maps, the amount of land motion is represented in shades from yellow to purple. Areas where the ground shifted the most (vertically, horizontally, or both) are represented in yellow, while areas with little change are represented in purple. Circles show the location of earthquakes and aftershocks in the two days after the initial 8.3 earthquake, as reported by the USGS National Earthquake Information Center. Larger quakes are represented by larger circles. The base map layer uses a digital elevation model and a bathymetry map to show the contours of the land surface and seafloor.
The interferograms above show that land moved as much as 1.4 meters toward to satellite (generally in the vertical direction) near the coast, and early estimates of the horizontal motion suggest it was as much as 2 meters. While SAR can see through clouds and the dark of night, it cannot see much through water. It is likely that much of the ground deformation from the earthquake occurred underwater, which explains the formation of the tsunami and the location of many aftershocks.
The 2015 earthquake ruptured along almost the same part of the subduction zone as an earlier event in 1943 that was close to the same size. This means that it took only 70 years for enough stress to build up in the Chile subduction zone to produce a magnitude 8.3 earthquake on each section of the zone that runs the full length of Chile.
Map contains modified Copernicus Sentinel data 2015, processed by ESA and analyzed by the NASA/JPL-Caltech ARIA team. This research was carried out at JPL under a contract with NASA. Sentinel-1 data were accessed through the Copernicus Open Access Hub.
 Planetary Data System


