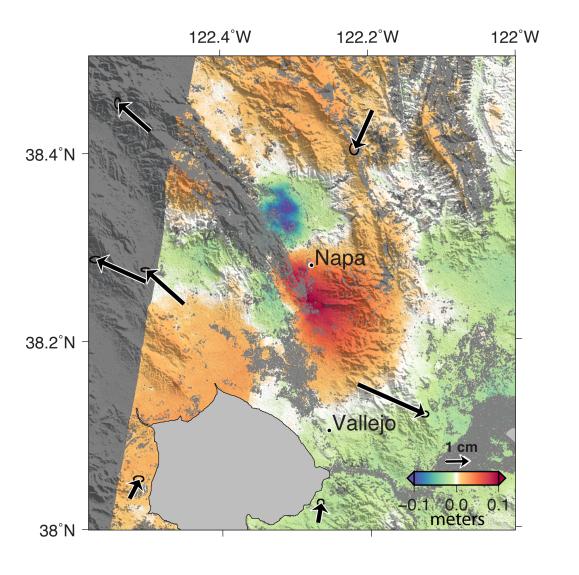
A magnitude 6.0 earthquake struck southern Napa county northeast of San Francisco, California, on Aug. 24, 2014, causing significant damage in the city of Napa and nearby areas. The earthquake deformed Earth's surface and this deformation was measured by precise analyses of data from nearby Global Positioning System (GPS) tracking stations of the Plate Boundary Observatory (operated by UNAVCO for the National Science Foundation) and the Bay Area Rapid Deformation network (operated by Berkeley Seismological Laboratory). Black arrows on this map show the measured permanent horizontal movement, with black ellipses showing the uncertainty of the measurement. The scale is shown by the black arrow in the lower right corner. The GPS data were analyzed by scientists at NASA's Jet Propulsion Laboratory in Pasadena, California.
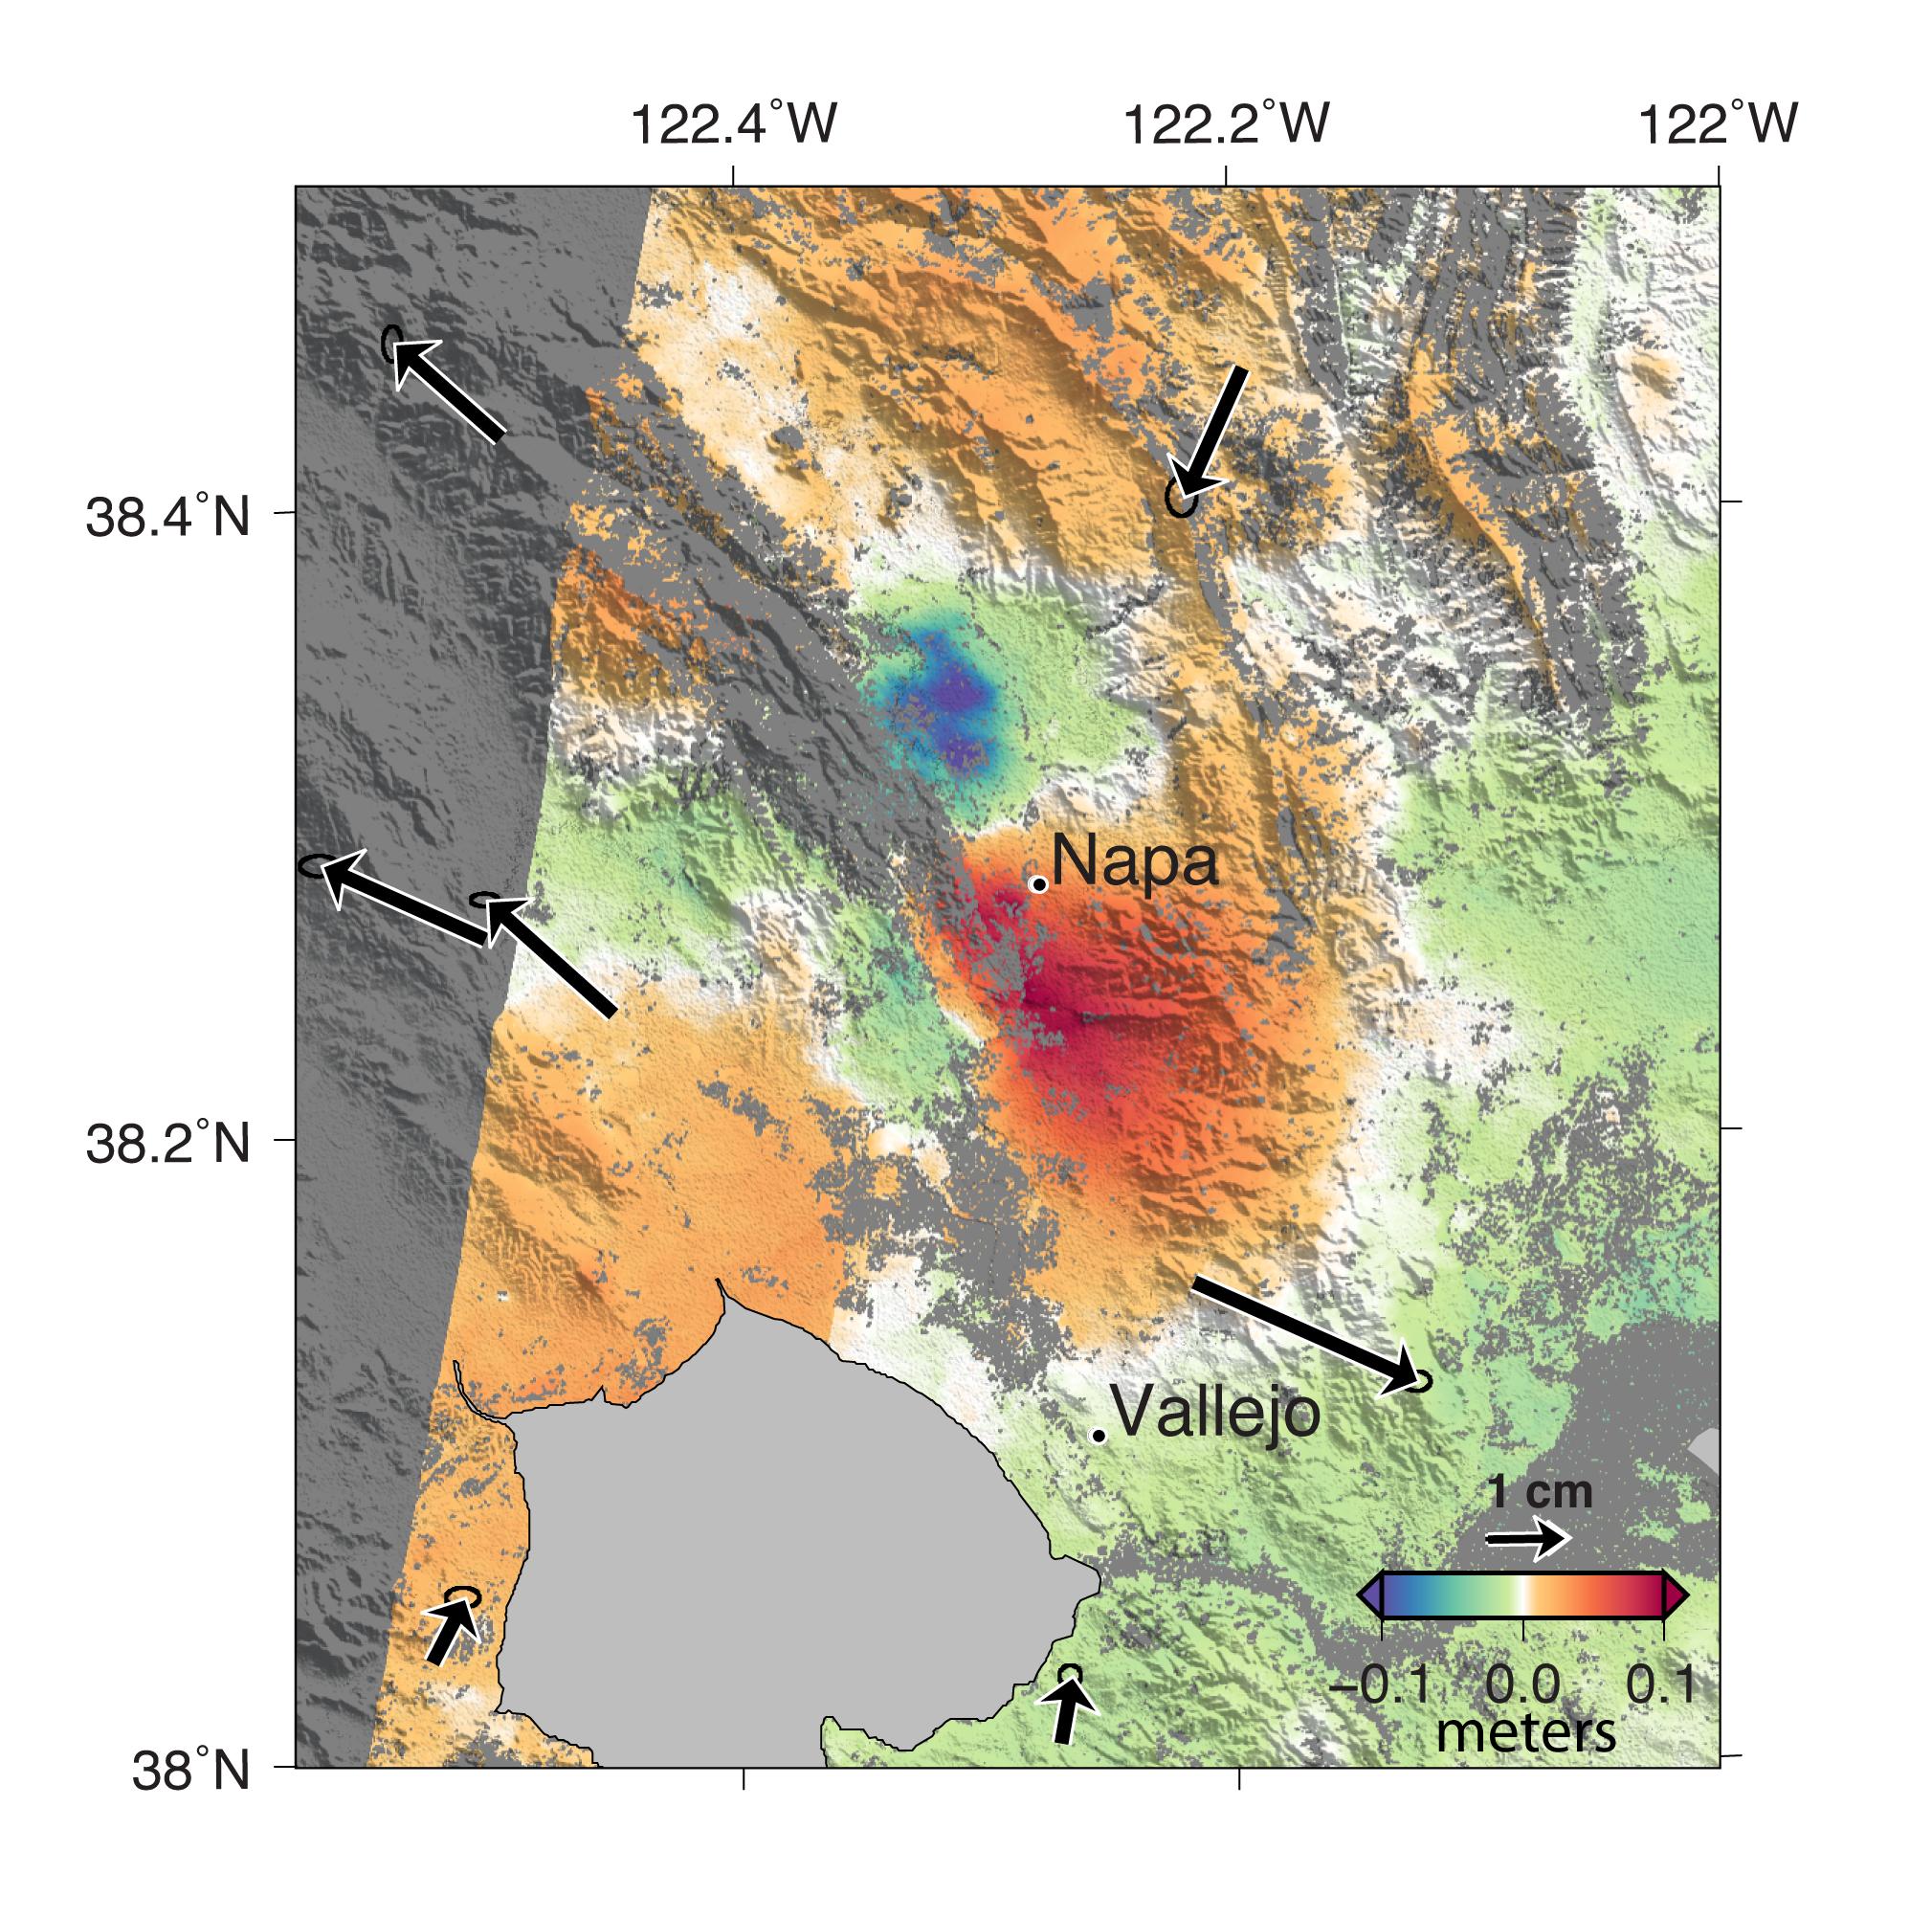
NASA JPL scientists, in collaboration with the Italian Space Agency's (ASI) Center for the Interpretation of Earth Observation Data and the Università degli studi della Basilicata, also analyzed radar images from ASI's COSMO-SkyMed satellites to calculate a map of the deformation of Earth's surface caused by the earthquake, as shown in this false-color map that has been combined with shaded relief topography in gray. The colors indicate the amount of permanent surface movement that occurred almost entirely due to the earthquake, as viewed by the satellite, during the one-month interval between two COSMO-SkyMed images, one before and one after the earthquake.
The red areas south of Napa moved about 4 inches (0.1 meters) to the east and upward during the earthquake. The dark green and blue areas north of Napa moved about 4 inches (0.1 meters) to the west and downward due to the earthquake. Scientists use these maps to build detailed models of the fault and associated land movements so that they can better understand the impact on future earthquake activity.

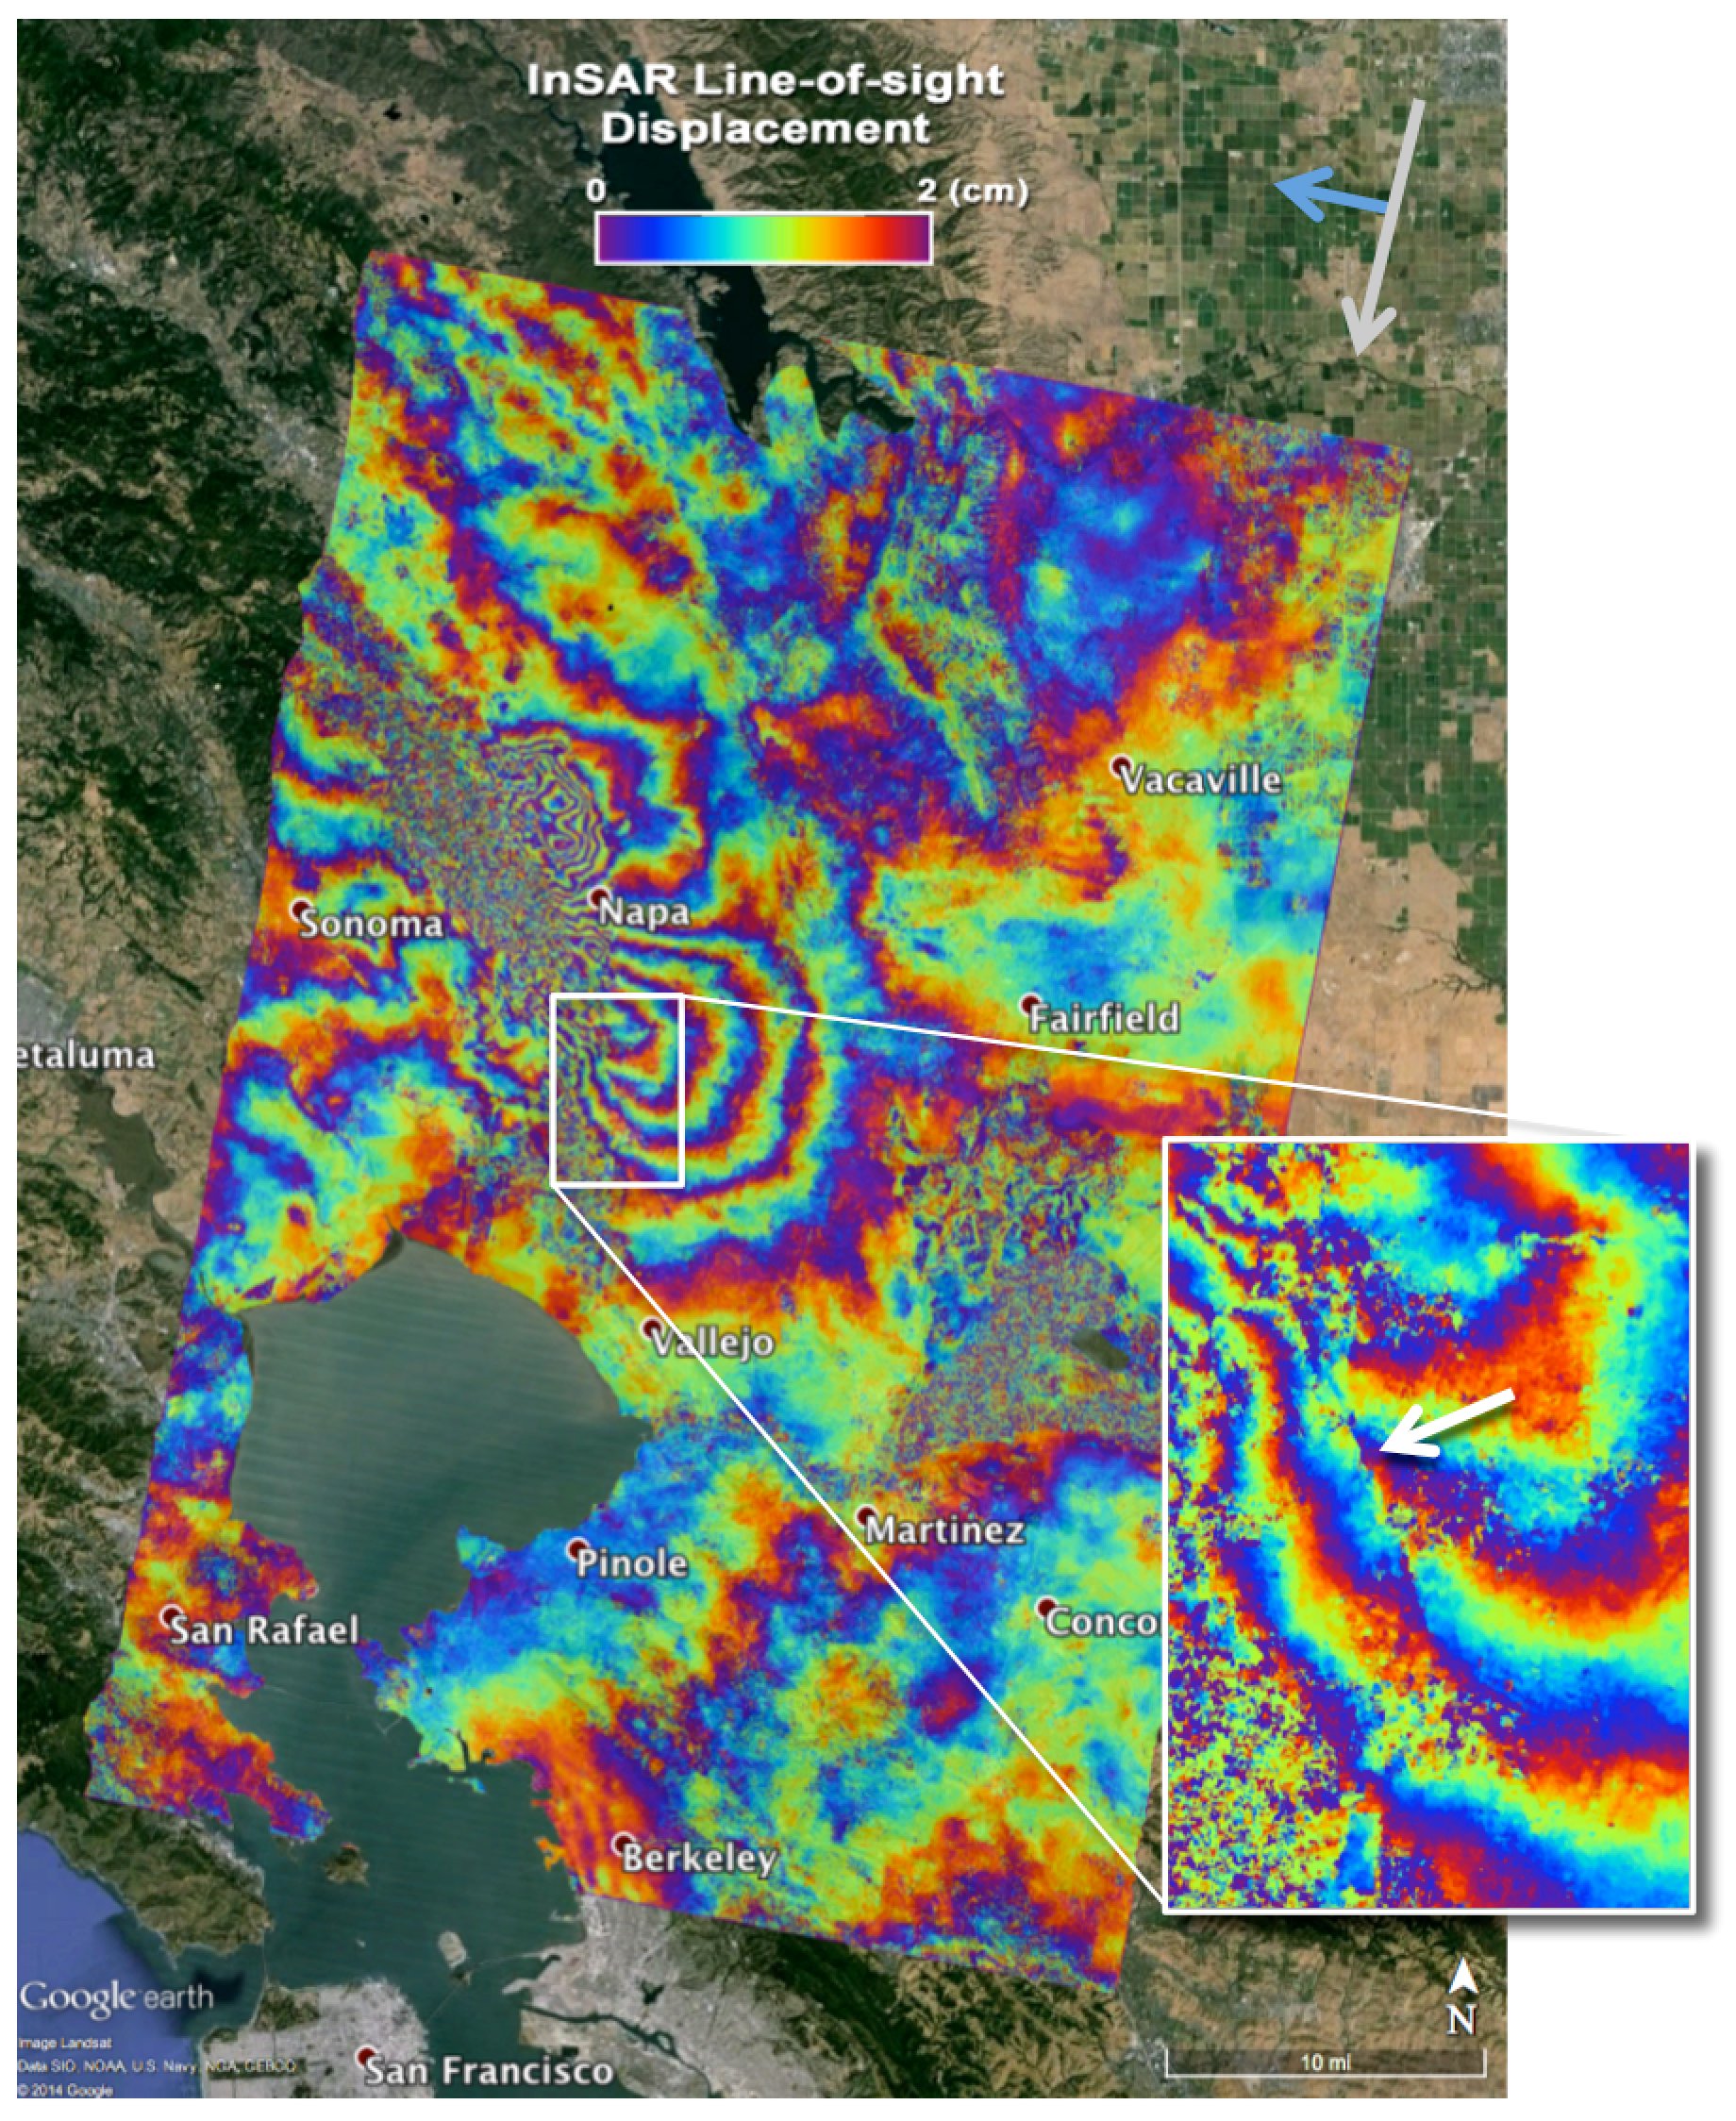
Click on the image for larger version The second radar map is based on the same data as the first map, but is shown in a way that highlights very small-scale ground deformation and evidence of the fault rupture visible on Earth's surface. In this map, one color cycle in the map (from purple to purple) represents 0.8 inches (2 centimeters) of ground motion. For instance, in moving from one region that is purple through one color cycle to another region that is purple, the ground position changed 0.8 inches relative the starting purple region. The inset map shows a close up of the color cycles, revealing a discontinuity in the color cycles that identifies a potential fault rupture cutting through the Napa County Airport. USGS and California Geological Survey field crews investigated this feature and were able to verify that the fault did in fact break Earth's surface at this location, along a previously unidentified fault rupture.
Both of these data sets were derived using a technique called synthetic aperture radar interferometry (InSAR) that detects minute changes in the distance between the satellite and the ground. The technique combined data from images on July 26, 2014, and Aug. 27, 2014 to generate these maps of how the Earth moved during the earthquake. In the upper right corner of the map the satellite's heading direction is indicated with the gray arrow, and the radar's line of sight direction is indicated with the blue arrow -- looking down at 61 degrees from horizontal. The ground deformation is measured from this viewing angle, and so it observes Earth displacement only in this direction, either toward or away from the satellite.
These maps cover only a portion of the full COSMO-SkyMed imagery, measuring approximately 34 by 31 miles (55 by 50 kilometers), processed by the NASA JPL-Caltech Advanced Rapid Imaging and Analysis (ARIA) team using X-band interferometric synthetic aperture radar data from the Italian Space Agency's COSMO-SkyMed satellite constellation. It was processed as part of a joint collaboration between JPL, Caltech, the Italian Space Agency (ASI) Centro Interpretazione Dati di Osservazione della Terra (CIDOT) and the Università degli Studi della Basilicata. Image processing was implemented using the JPL Interferometric Synthetic Aperture Radar Scientific Computing Environment (ISCE) software package. The full-resolution map has a pixel size of about 100 feet (30 meters) on the ground. The gray shaded relief topography is calculated from the NASA Shuttle Radar Topography Mission digital elevation model, which was also used in the radar processing.
The interferogram as a .kmz file for display in Google Earth is available at http://aria-share.jpl.nasa.gov/events/20140824-south_napa/interferogram/.
 Planetary Data System


