Click on the image for the animation
NASA's CloudSat spacecraft overpassed Hurricane Sandy on Oct. 29, 2012 at approximately 11:25 a.m. PDT (2:25 p.m. EDT) just as Sandy was approaching the Atlantic coastline. Sandy contained estimated maximum sustained winds of 90 miles per hour (78 knots).
CloudSat, flying in formation with the A-TRAIN constellation of satellites, provides detailed radar observations of clouds including the vertical distribution of precipitation and cloud structure. At the expense of horizontal resolution, CloudSat observations produce detailed vertical resolution of clouds and precipitation starting at the surface through 19 miles (30 kilometers) in the atmosphere. CloudSat profiles the clouds and distinguishes the amount and type of water, liquid or ice, found throughout these storm systems.
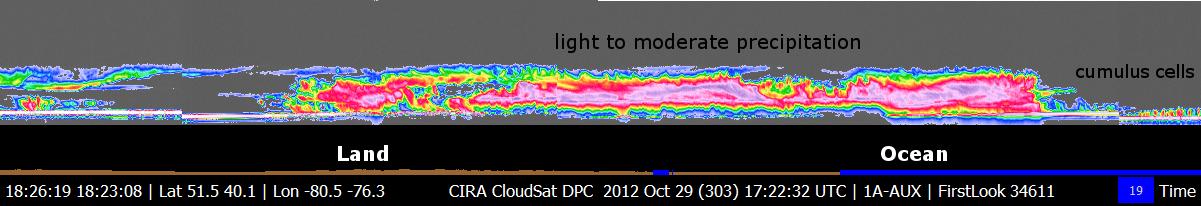
CloudSat overpassed an estimated 137 miles (220 kilometers) to the west of Sandy's storm center, which at the time of the overpass was still over the Atlantic Ocean. The satellite overpassed a wide area of moderate precipitation stretching across New York to coastal North Carolina. Maximum cloud top heights from the CloudSat overpass are estimated at 7.5 to 8 miles (12 to 13 kilometers) in height. The brighter colors (orange, red and light pinks) represent greater intensity of the backscattered radar signal from the satellite. These brighter colors correlate to larger raindrops, heavier precipitation and ice or hail depending on the vertical level. The shades of blues and greens represent smaller amounts water and ice particles that correspond to thinner clouds type (cirrus and anvil tops). A nearly continuous area of light and moderate precipitation stretches across the mid-Atlantic region. Near the surface of these areas of light to moderate precipitation, the radar signal measured by CloudSat isn't as strong due to larger sized water droplets that tend to weaken the strength of the signal. The CloudSat observations are an excellent tool for determining cloud layers and heights, precipitating cloud structures and other cloud properties.
Part of the CloudSat overpass over the ocean just off the coast of Virginia and North Carolina (denoted by blue line) reveals small pockets of shallow "closed cell" cumulus clouds less than 1.2 miles (2 kilometers) in height. Closed cell cumulus clouds generally represent more stable atmospheric conditions and occur on the back side of mid-latitude cyclones as is the case with Sandy moving onshore.
Quicklook Images can viewed at the CloudSat Data Processing Center.
 Planetary Data System


