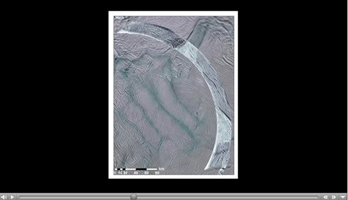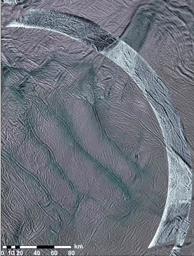
Click on the image for the videoNASA's Cassini spacecraft obtained these views of the south polar area of Saturn's moon Enceladus in visible and near-visible (ultraviolet and infrared) light and synthetic-aperture radar (SAR). The region is south of 45 degrees south latitude. The SAR image, acquired November 6, 2011, is shown as an arc running from upper left to lower right, accented in light blue. Bright and dark edges of this arc are artifacts of the radar imaging process. The background image was taken with visible-light (PIA08342), with color added for emphasis (see below). Visible-light images, like we normally see in photographs, are mostly bright or dark depending on their target's chemical composition, while brightness in SAR images usually depends on how rough or smooth the surface is. The SAR swath is about 15 miles (25 kilometers) wide and is centered at 65 south latitude, 295 west longitude.
The color in the background image is used to separate different materials using ultraviolet, visible and infrared images taken from 2004 to 2009 (see PIA13423). Blue colors represent icy material that originated in the plumes and fell back to the surface. Since these images were taken using illumination by sunlight, they sense ice particles and other roughness in the wavelength range of 50 to 100 microns. The SAR swath uses microwaves 2 centimeters long in wavelength to "light" the surface, so it senses roughness in that range. In addition, the SAR may be seeing that roughness slightly under the surface.
From east-to-west (bottom right to top left), the SAR image crosses near-south-polar terrain close to many of the active sulci, which are long fissures. Throughout the scene, the surface is covered with a network of linear and near-linear grooves and fractures, interpreted to be due to extension, or pulling apart, of Enceladus' crust. These are dominated by a set of larger grooves, about a mile (kilometer) wide, running many tens of miles (kilometers) in length, and smaller grooves about 700 feet (200 meters) wide. A v-shaped region near the lower (eastern) end of the SAR swath, bounded by large faults, appears brighter to radar than most other areas, most likely the result of a rougher surface in the 2-centimeter-wavelength scale. Within, the terrain appears to be slightly more broken up, possibly the result of more dynamic tectonic forces disrupting the surface. The few-miles-wide (few-kilometers-wide) fault bounding the westernmost edge (top) edge of this area looks similar to the four active sulci that run parallel to it, suggesting that it is formed by the same processes; this feature is discussed in PIA15171. A similar fault about 1 to 2 miles (2 to 3 kilometers) wide runs along the center of much of the SAR swath for at least 47 miles (75 kilometers). Farther west still, the swath crosses another v-shaped, SAR-bright region bounded by large faults, including part of the Mosul Sulci system (see PIA15170). Once again, the network of fractures within the bright region appears to be rougher and more broken up. It also coincides with unusually colored terrain surrounding the active sulci (seen in the background images), and so possibly indicates a relatively young or active surface.
The Cassini orbiter was designed, developed and assembled at JPL. The radar instrument was built by JPL and the Italian Space Agency (ASI), working with team members from the U.S. and several European countries. JPL is a division of the California Institute of Technology in Pasadena.
For more information about the Cassini-Huygens mission visit http://saturn.jpl.nasa.gov and http://www.nasa.gov/cassini. The Cassini imaging team homepage is at http://ciclops.org.

 Planetary Data System


