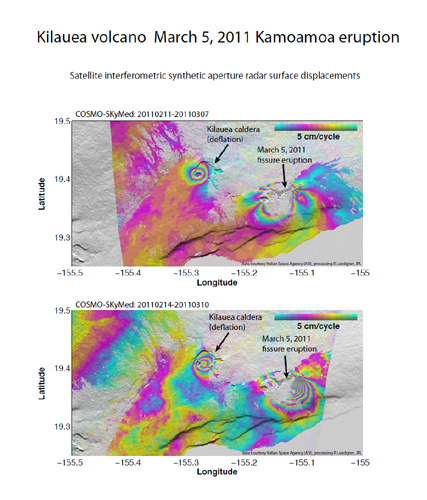
On March 5, 2011, a large fissure eruption began on the east rift zone of Hawaii's Kilauea volcano. This satellite interferometric synthetic aperture radar image-pair was created by Paul Lundgren of NASA's Jet Propulsion Laboratory in Pasadena, Calif., using data acquired from the Italian Space Agency's (ASI) constellation of COSMO-SkyMed radar satellites. This image depicts the relative deformation of Earth's surface at Kilauea between Feb. 11, 2011 and March 7, 2011, (left-hand image) two days following the start of the current eruption. The second (right-hand) image displays the relative deformation between February 14, 2011 and March 10, 2011. This image is from the opposite viewing geometry. In the plot, surface displacements are seen as contours (or 'fringes'), where each color cycle represents 1.5 centimeters (0.6 inches) of surface motion. The circular pattern of concentric fringes toward the left represent deflation of the magma source beneath Kilauea caldera. The complex pattern toward the right represents the deformation caused by the volcanic dike intrusion and subsequent fissure eruption that is taking place along the east rift zone. The greater intensity of fringes adjacent the eruptive fissure on the image to the right partially reflects the increased deformation that took place as the eruption continued through March 10, 2011.
The image below shows both interferograms at a larger fringe interval (5 cm/color-cycle) with the geographic coordinates and features labeled.

Click on the image for larger version

