Click on the image for the larger versionIn late July 2010, flooding caused by heavy monsoon rains began in several regions of Pakistan, including the Khyber Pakhtunkhwa, Sindh, Punjab and parts of Baluchistan. According to the Associated Press, the floods have affected about one-fifth of the country. Tens of thousands of villages have been flooded, more than 1,500 people have been killed, and millions have been left homeless. The floodwaters are not expected to fully recede before late August. NASA's CloudSat satellite flew over the region affected by the floods on July 28, 2010, at the beginning of the flooding event. At that time, a large area of intense thunderstorms covered much of Pakistan. Between July 28 and 29, as much as 400 millimeters (16 inches) of rain fell from these cells, triggering flooding along the Indus and Kabul rivers.
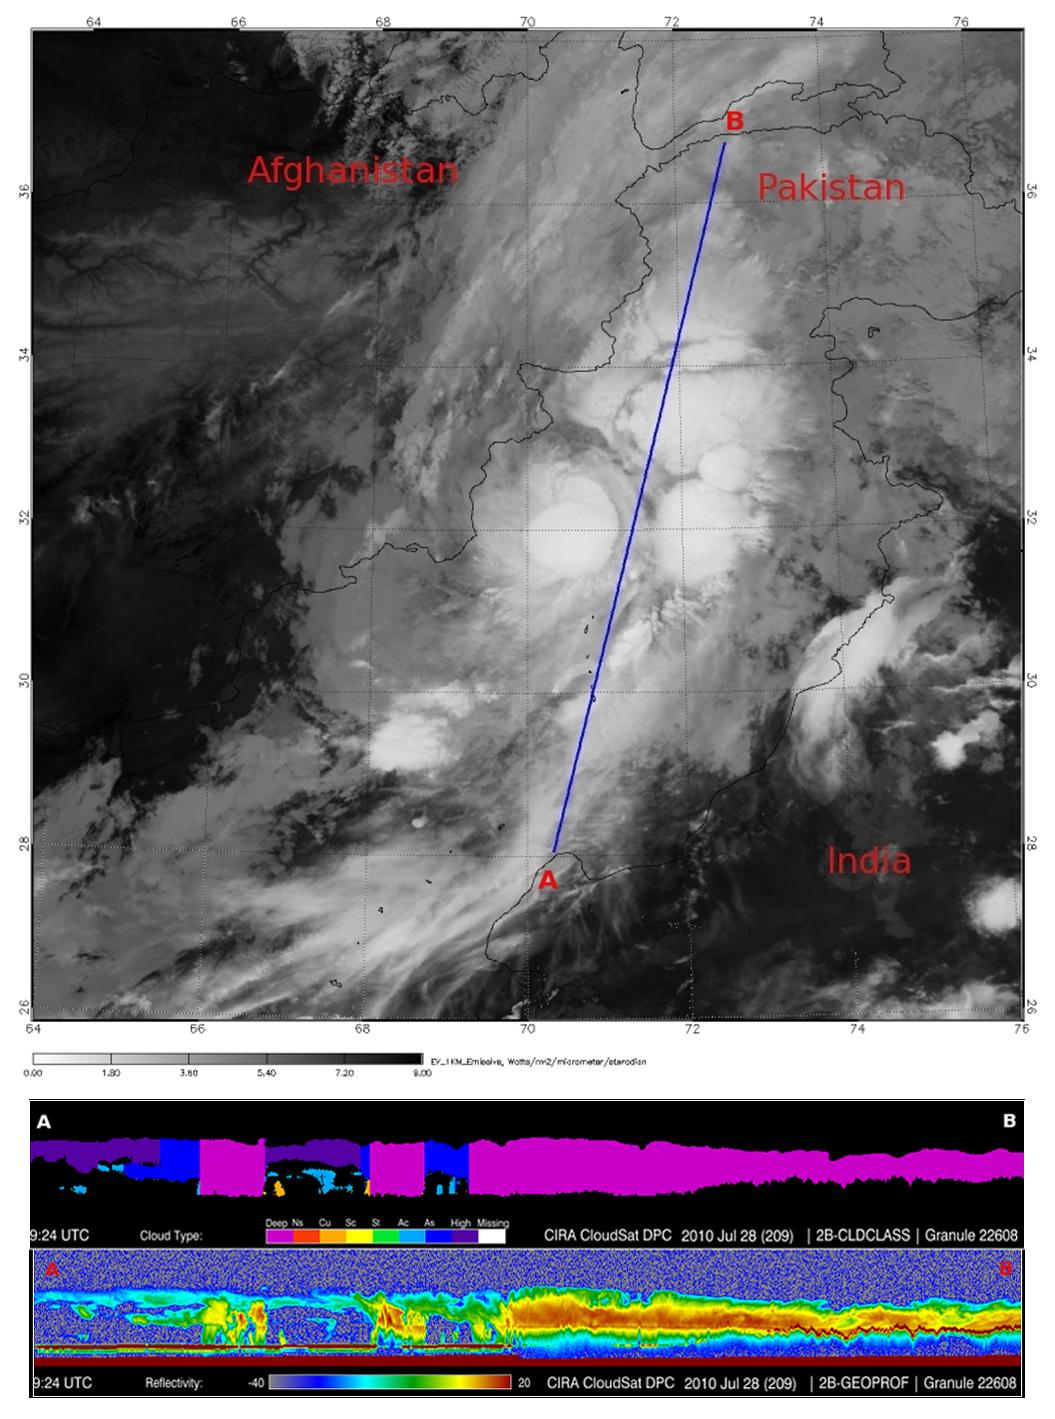
The top image, from NASA's Moderate Resolution Imaging Spectroradiometer instrument on NASA's Aqua spacecraft, reveals the bright white cloud tops from the cluster of thunderstorms. The blue vertical line across the image represents the path of CloudSat at the time the MODIS image was acquired. CloudSat cut through a large thunderstorm cell in the northern section of the country.
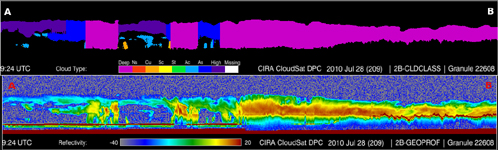
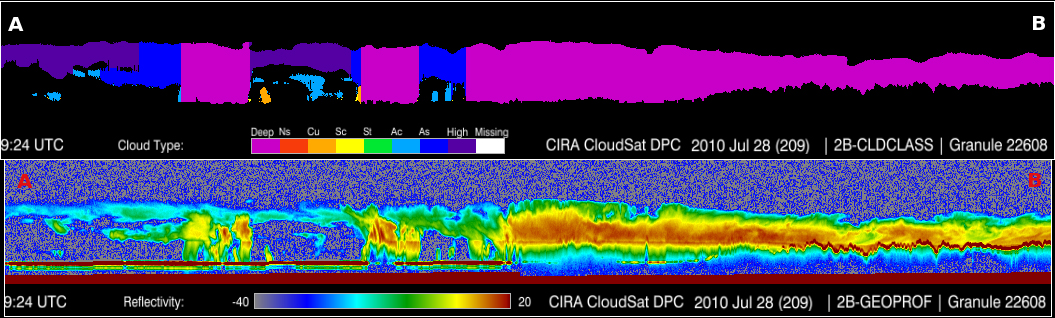
As seen in the top half of the bottom image, CloudSat classified the majority of the clouds present at the time as deep convective (cumulonimbus) clouds, which are typical of thunderstorms. The bottom half of the lower image shows the 3-D vertical structure of the storm along the satellite's flight path, revealing its heavy precipitation. As CloudSat's Cloud Profiling Radar passed over the area of heaviest precipitation, its signal thinned significantly. By the middle of the image, the ground echo (horizontal red line), which represents the topography of the area, completely disappears. The thinning of the radar's signal occurs because larger-sized particles and heavy rains decrease radar reflectivity and become indistinguishable to the radar. As the satellite continued traveling north, rainfall rates decreased and the signal increased, allowing the ground echo (topography) to once again become visible, at the far right of the image. CloudSat measured the height of the clouds along the radar's flight path at around 15 kilometers (9.3 miles) in the areas of deepest convection.
Storms with similar structure to this one have become common this summer as tropical monsoon moisture, coupled with a strengthening La Nina, dominate this region's weather patterns.
Quicklook Images can viewed at the CloudSat Data Processing Center.
