
Figure 1
Click on the image for the larger version
New NASA airborne radar images show the continuing deformation in Earth's surface resulting from the magnitude 7.2 temblor that rocked Mexico's state of Baja California and parts of the American Southwest on April 4, 2010, along with its thousands of subsequent aftershocks.
The data reveal that some faults in the area to the west of Calexico, Calif., have continued to move at the surface, most likely in the many aftershocks that have occurred in this region. This fault motion is likely what is known as "triggered slip" on the faults, caused by stress changes in Earth's crust resulting from the large 7.2 quake rupture. The new maps follow the radar maps previously released on June 23, 2010 at http://www.nasa.gov/topics/earth/features/UAVSARimage20100623.html.
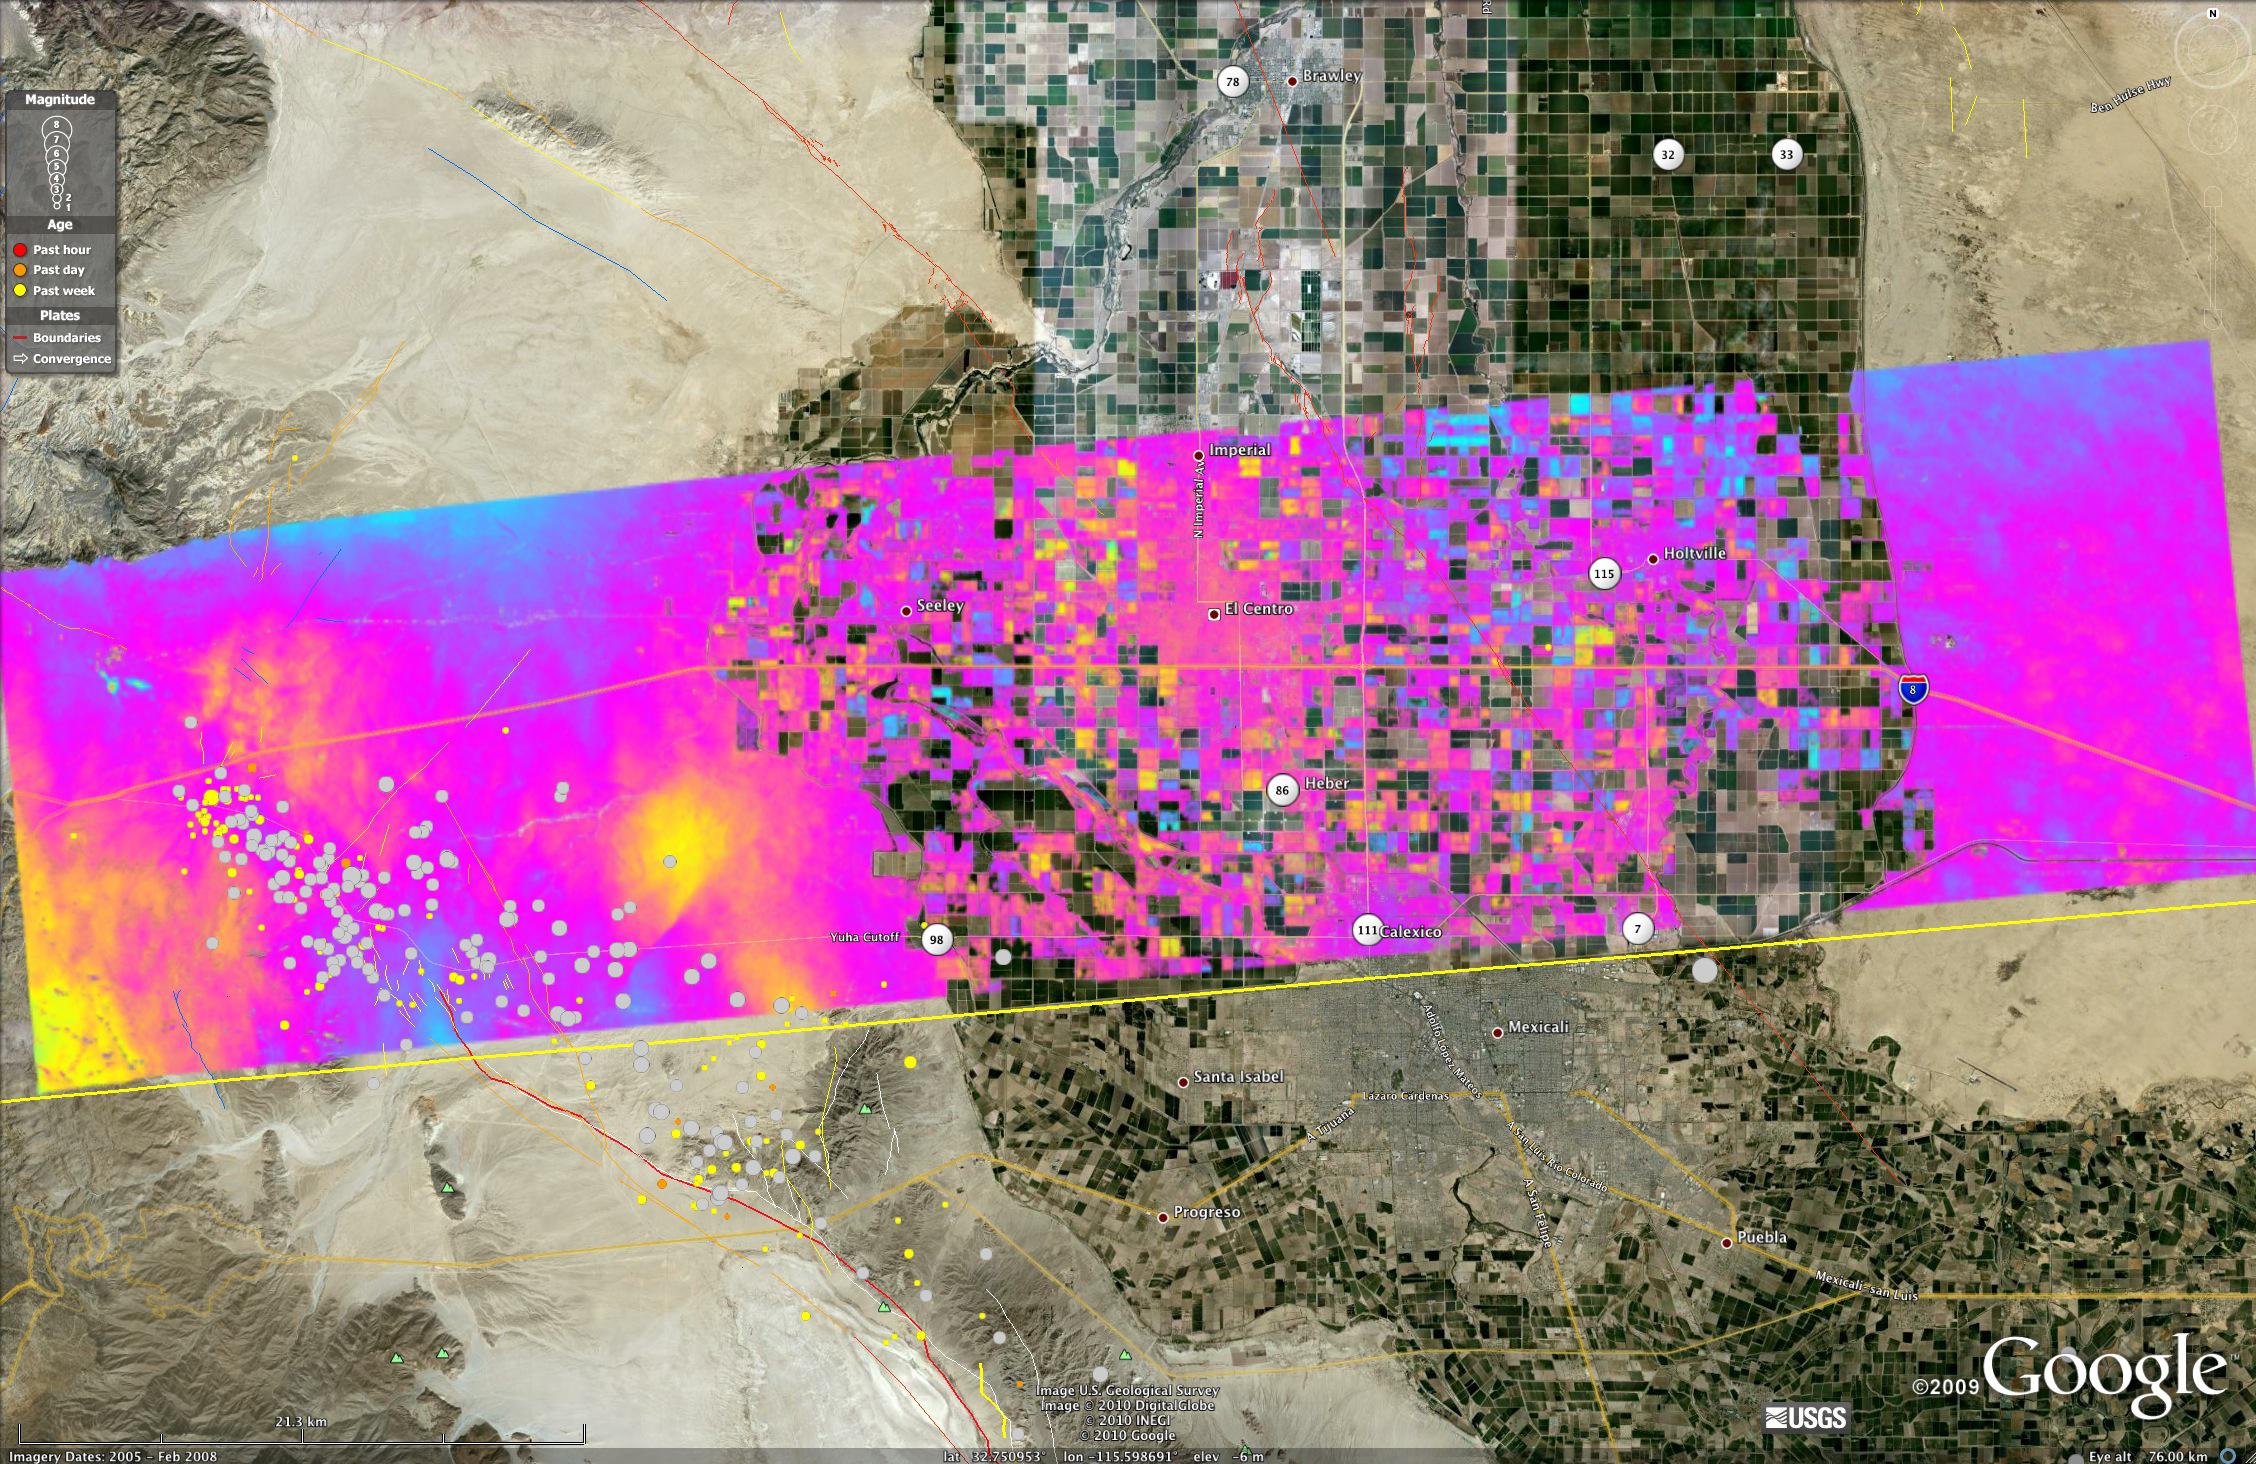
This image shows a UAVSAR interferogram swath measuring 87 by 20 kilometers (54 by 12.5 miles) overlaid atop a Google Earth image. Each colored contour, or fringe, of the interferogram represents 11.9 centimeters (4.7 inches) of surface displacement. Major fault lines are marked in red, and recent aftershocks are denoted by yellow, orange and red dots, with older earthquakes shown as gray dots.
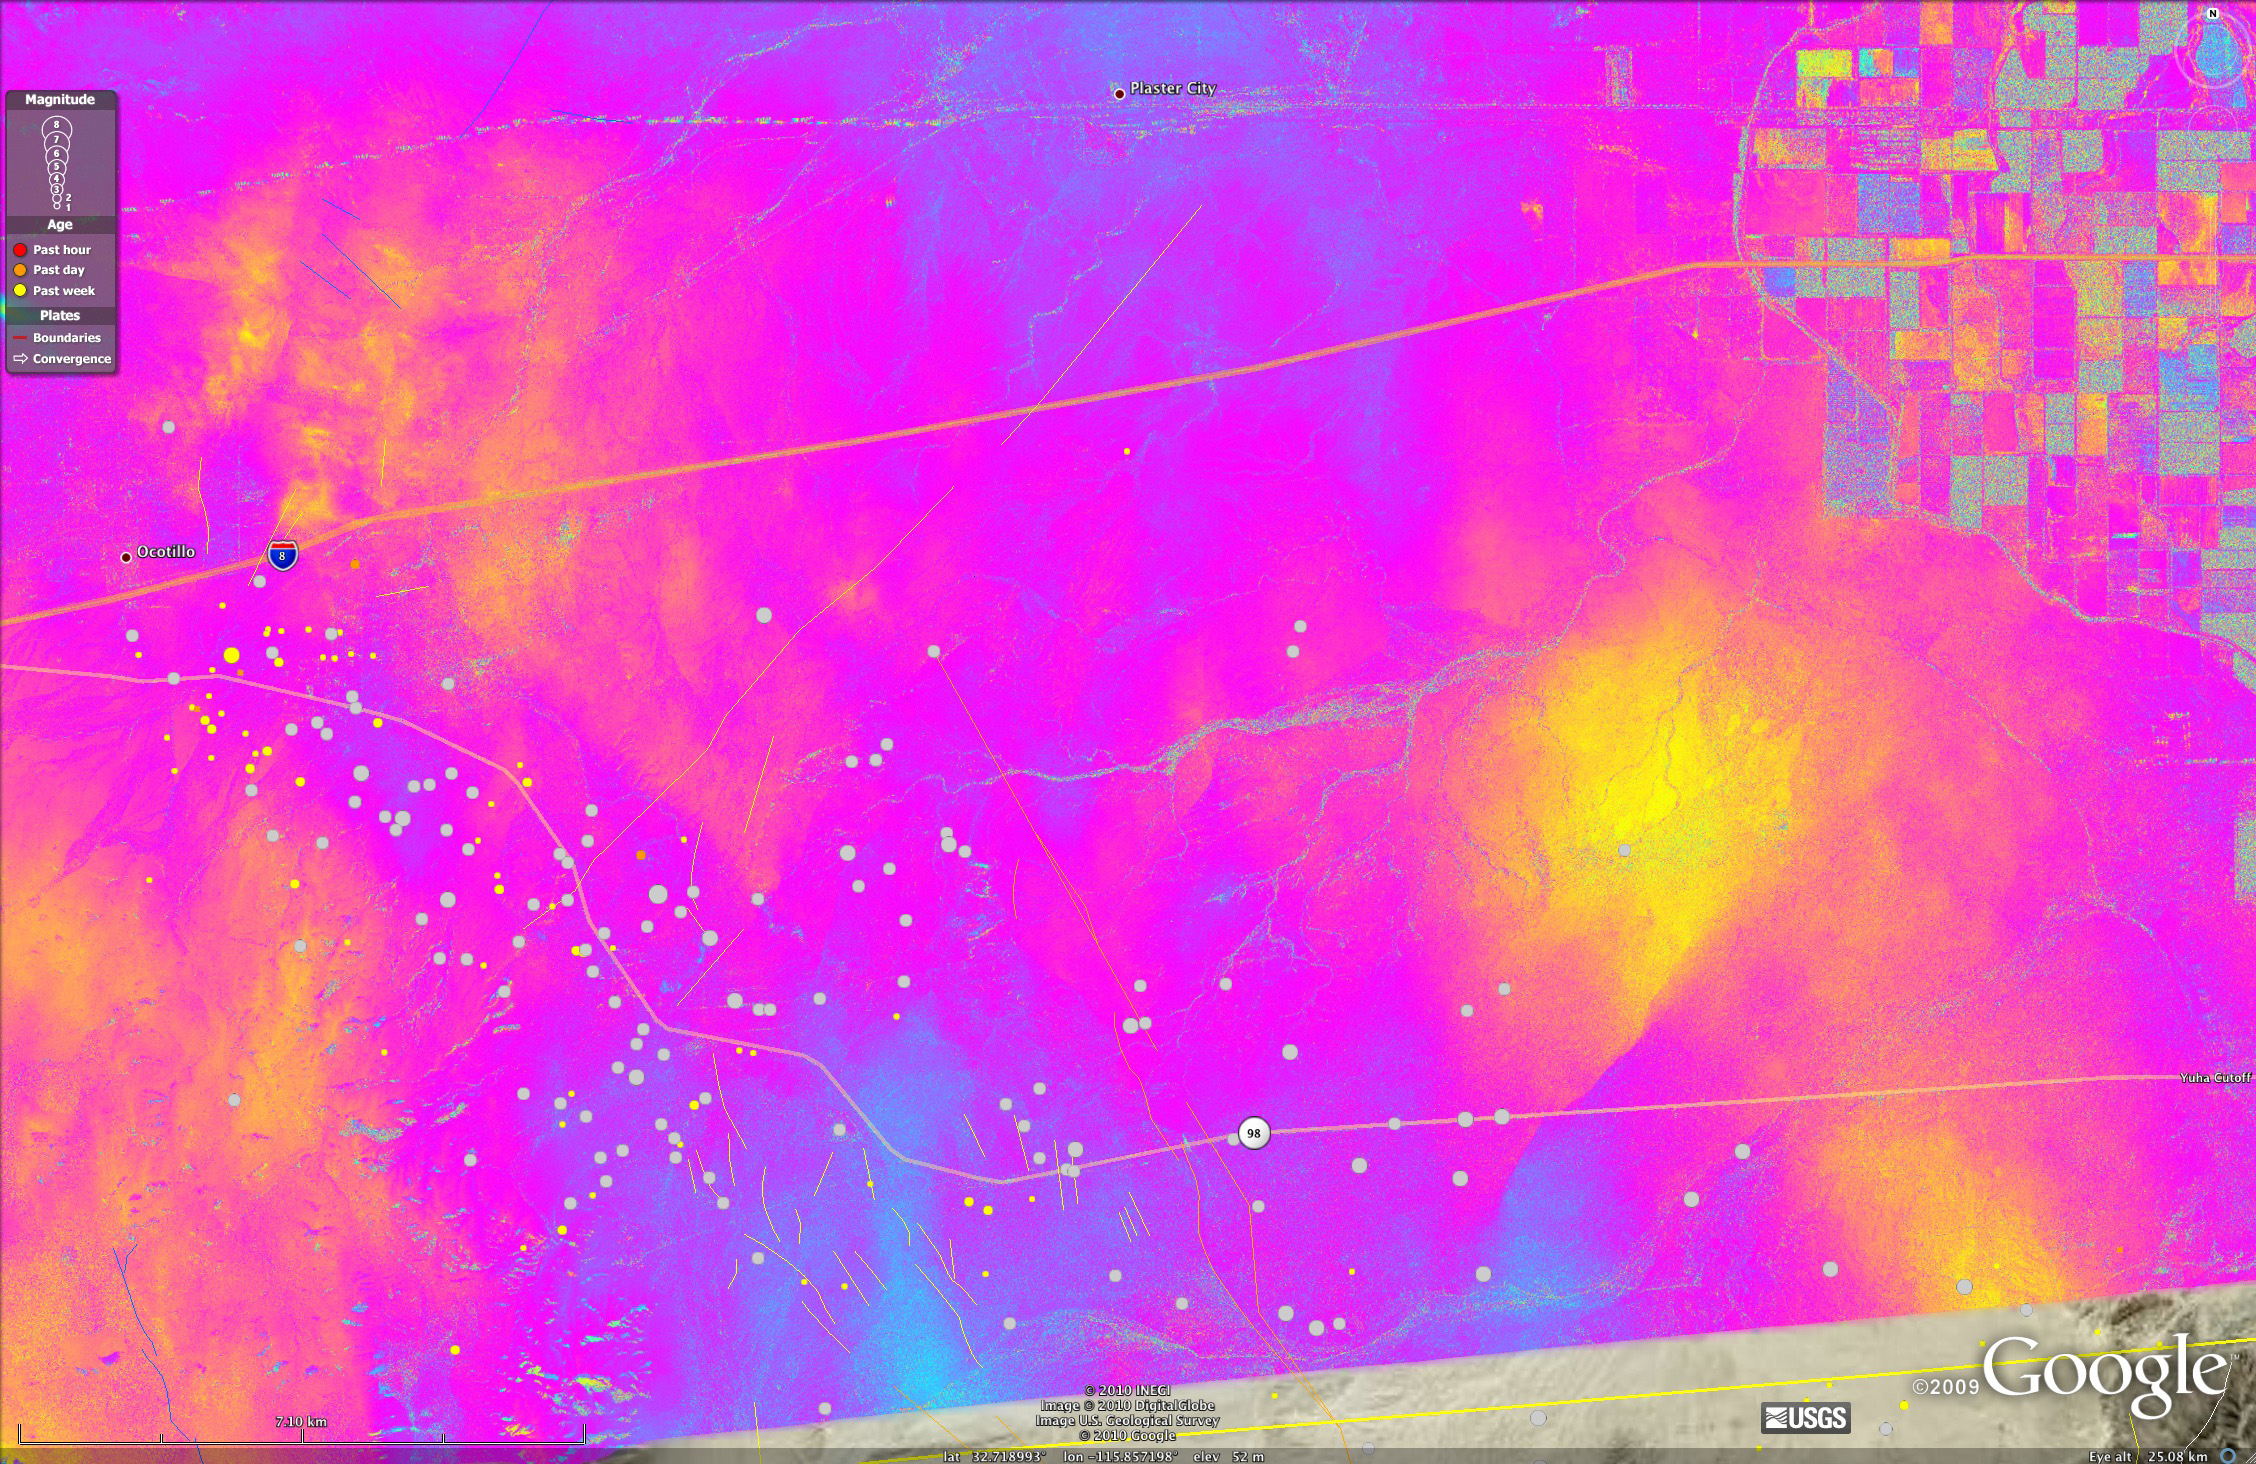
An enlargement of the interferogram is shown in another figure (Figure 1), focusing on the area where most of the aftershocks have been located west of Calexico. The enlargement, which covers an area measuring about 28 by 18 kilometers (18 by 11.5 miles), reveals many small "cuts," or discontinuities, in the interferogram color. These are caused by ground motions on small faults that occurred since April 13, ranging from less than a centimeter to a few centimeters (half an inch to a few inches). Faults that have been previously mapped by the U.S. and California Geological Surveys through 2009 are depicted by thin colored lines.
A science team at NASA's Jet Propulsion Laboratory, Pasadena, Calif., used the JPL-developed Uninhabited Aerial Vehicle Synthetic Aperture Radar (UAVSAR) to measure surface deformation from the quake. The radar flies at an altitude of 12.5 kilometers (41,000 feet) on a Gulfstream-III aircraft from NASA's Dryden Flight Research Center, Edwards, Calif.
The team used a technique that detects minute changes in the distance between the aircraft and the ground over repeated, GPS-guided flights. To create these latest images, the team combined data from flights on April 13, 2010, and July 1, 2010. The resulting maps are called interferograms.
JPL geophysicist Andrea Donnellan, principal investigator of the UAVSAR project to map and assess seismic hazard in Southern California, said the latest flight provides valuable new data that researchers can use to monitor the continued readjustment of Earth's crust following April's major quake. "The region was reflown with UAVSAR to monitor continued activity, including quiet motions (movements of faults that do not result in earthquakes) as Earth's crust readjusts, as well as large aftershocks, such as the magnitude 5.7 one observed on June 14," she said.
The April 4, 2010, El Mayor-Cucapah quake was centered 52 kilometers (32 miles) south-southeast of Calexico, Calif., in northern Baja California. The quake, the region's largest in nearly 120 years, was also felt in southern California and parts of Nevada and Arizona. There have been thousands of aftershocks, extending from near the northern tip of the Gulf of California to a few miles northwest of the U.S. border. The area northwest of the main rupture, along the trend of California's Elsinore fault, has been especially active, and was the site of a large, magnitude 5.7 aftershock on June 14. The new UAVSAR interferogram shows that some of these aftershocks have caused fault slip at the surface during the 79 days spanned by the two images.
"Geologists used the first UAVSAR interferogram, which included the April 4th quake, to map many new small fault ruptures in the field," said JPL geophysicist Eric Fielding. "This new interferogram shows that some of the faults have continued to slip since our overflight on April 13th. Such mapping is important for understanding the fault structure in this area between the main fault ruptures on April 4th further south in Baja California and the faults further to the north in Southern California, including the Elsinore and San Jacinto faults."
Studies of interferograms from Japanese and European Space Agency satellites by Fielding indicate that the largest fault movement visible in the new UAVSAR interferogram occurred between May 21 and June 6 along a northeast-southwest trending fault known as the Yuha fault, which is visible to the right of the center of the interferogram. This fault previously had slipped about 2 to 4 centimeters (1 to 2 inches) in the first days after the April 4th earthquake, as was shown in the earlier UAVSAR and satellite interferograms. Since April 13, the fault has slipped about another 2 centimeters (1 inch).
The full-resolution data for this interferogram in original binary files and as .kmz files for display in Google Earth are available at:
http://uavsar.jpl.nasa.gov/kml/RPI/SanAnd_26501_10028-000_10057-100_0079d_s01_L090_01.htm.
UAVSAR is part of NASA's ongoing effort to apply space-based technologies, ground-based techniques and complex computer models to advance our understanding of quakes and quake processes. The radar flew over Hispaniola earlier this year to study geologic processes following January's devastating Haiti quake. The data are giving scientists a baseline set of imagery in the event of future quakes. These images can then be combined with post-quake imagery to measure ground deformation, determine how slip on faults is distributed, and learn more about fault zone properties.
UAVSAR is also serving as a flying test bed to evaluate the tools and technologies for future space-based radars, such as those planned for a NASA mission currently in formulation called the Deformation, Ecosystem Structure and Dynamics of Ice, or DESDynI. That mission will study hazards such as earthquakes, volcanoes and landslides, as well as global environmental change.
For more information on UAVSAR, visit: http://uavsar.jpl.nasa.gov/.
