 | 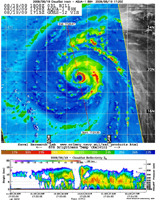 |
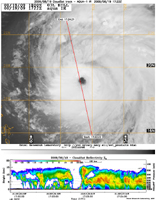
| MODIS Infrared Imagery (IR) | 89 GHz AMSR-E |
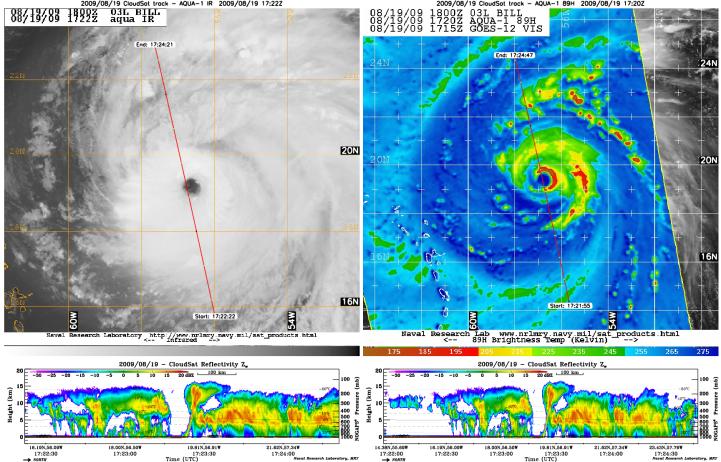
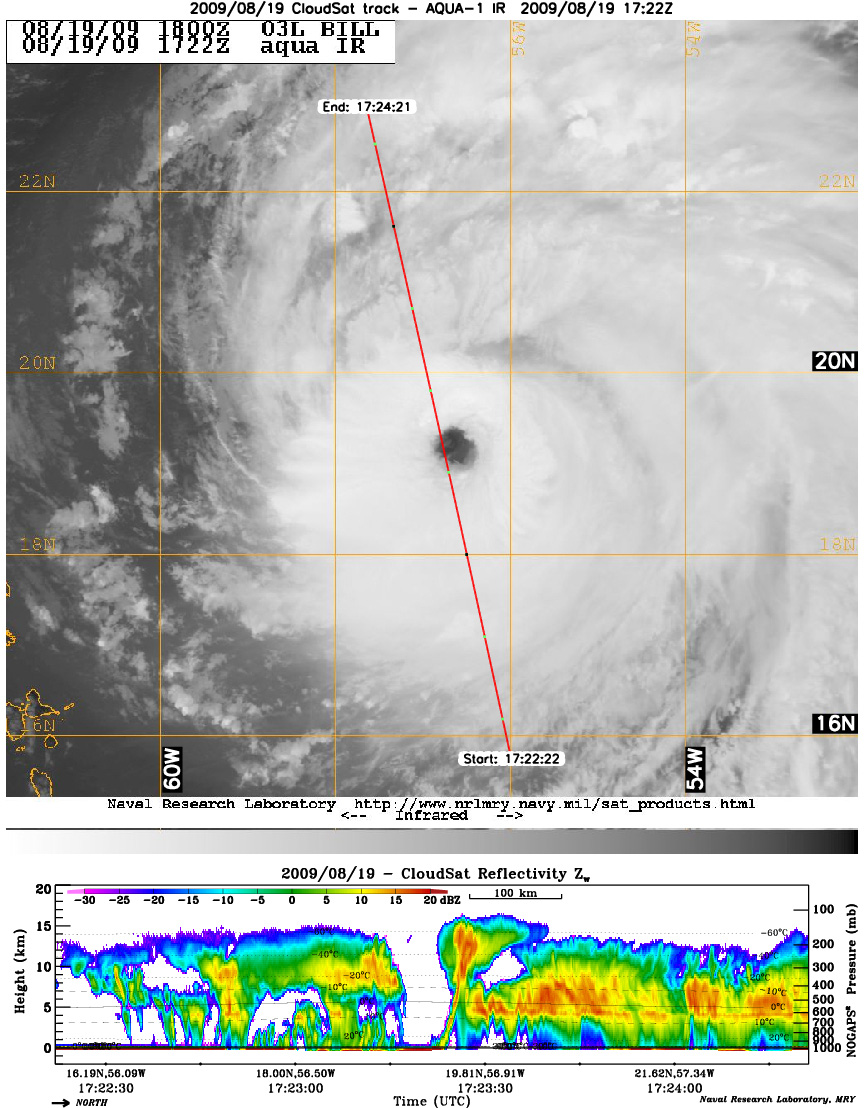
NASA's satellite CloudSat captured an extraordinary eye overpass of a category 4 Hurricane Bill on August 19, 2009 at 1720 UTC (1220 EDT). Bill's maximum sustained winds are 132 mph (115 knots) with a central pressure of 947 mb.
The 89 GHz AMSR-E onboard the Aqua spacecraft (full color image) reveals deep convection and low brightness temperatures ( < -117 F) as shown by the bright red and deep brown colors. The half red circle surrounding the eye center on the AMSR-E image depicts the eye wall undergoing a replacement cycle. Hurricane Bill has undergone several eye wall replacement cycles (EWRC) causing the hurricane to intensify and weaken. One of the key advantages of 89GHz imagery is to help identify areas of strong convection by looking at the brightness temperatures, colder brightness temperatures revel deeper areas of convection. 89GHz imagery is also used to help clearly identify storms centers by penetrating thin cirrus shields.
The CloudSat overpass (shown by the red line on the AMSR-E image) reveals the cirrus free eye (~50 km wide), surrounded by an intense eyewall (orange and red reflectivities) with cloud tops on the northwestern edge extending almost 16 km into the atmosphere. The eyewall bends backward and then inward likely from northerly shear along the top of the storm.
The tallest thunderstorm cloud top in the northwestern eyewall edge is a "hot tower," a cumulonimbus cloud penetrating the TTL (Tropical troposphere layer). The hot tower extends all the way from the surface along the inner eyewall edge to > 15 km. Hot towers form as a result of large amounts of latent heat released as water vapor condenses into liquid. The release of this energy provides fuel for the storm to further intensity and strengthen as Bill was experiencing during the CloudSat overpass.
The purple and blue colors in the cirrus regions of the CloudSat overpass show small ice crystals. Ice crystals are found in the upper portion of cumlonumibus cloud tops and cirrus canopies as atmospheric conditions remain quite cold. The sensitivity of the CloudSat CPR (Cloud Profiling Radar) helps detect these features.
The infrared imagery (IR) from the Moderate Resolution Imaging Spectroradiometer (MODIS) onboard Aqua reveals white cloud tops indicating strong thunderstorms and intense convection. By comparing the IR imagery with the CloudSat overpass, multiple cloud layering is shown throughout the storm, a feature not apparent from IR imagery alone. The CloudSat overpass reveals convection free areas between the heavier rain bands called moats. IR imagery indicates strong convection is found throughout the storm, on the north and south edges but the CloudSat track shows the strongest area of convection on the northern edge of system, verified by the AMSR-E image. The southern edge of the storm contains drier air at the lower eye wall levels and less convection not easily detected from either AMSR-E or IR imagery. The cloud layering is indistinguishable from the IR imagery as all of the cloud layer tops appear to be at the same height.
Quicklook Images can viewed at the CloudSat Data Processing Center.
