PDS logoPlanetary Data System
PDS Information
Find a Node - Use these links to navigate to any of the 8 publicly accessible PDS Nodes.

This bar indicates that you are within the PDS enterprise which includes 6 science discipline nodes and 2 support nodes which are overseen by the Project Management Office at NASA's Goddard Space Flight Center (GSFC). Each node is led by an expert in the subject discipline, supported by an advisory group of other practitioners of that discipline, and subject to selection and approval under a regular NASA Research Announcement.
Click here to return to the Photojournal Home Page Click here to view a list of Photojournal Image Galleries Photojournal_inner_header
Latest Images  |  Spacecraft & Technology  |  Animations  |  Space Images App  |  Feedback  |  Photojournal Search  

PIA12001: Why Are Galaxies So Smooth?
 Mission:  Spitzer Space Telescope
 Instrument:  IRAC
 Product Size:  1750 x 940 pixels (w x h)
 Produced By:  California Institute of Technology 
 Full-Res TIFF:  PIA12001.tif (4.943 MB)
 Full-Res JPEG:  PIA12001.jpg (117.7 kB)

Click on the image above to download a moderately sized image in JPEG format (possibly reduced in size from original)

Original Caption Released with Image:

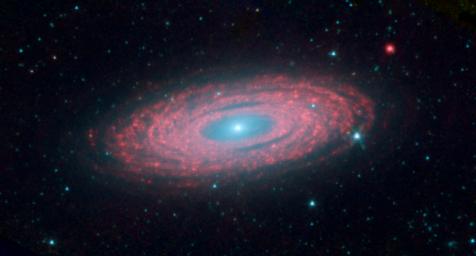
This image from NASA's Spitzer Space Telescope shows the spiral galaxy NGC 2841, located about 46 million light-years from Earth in the constellation Ursa Major. The galaxy is helping astronomers solve one of the oldest puzzles in astronomy: Why do galaxies look so smooth, with stars sprinkled evenly throughout? An international team of astronomers has discovered that rivers of young stars flow from their hot, dense stellar nurseries, dispersing out to form large, smooth distributions.

This image is a composite of three different wavelengths from Spitzer's infrared array camera. The shortest wavelengths are displayed inblue, and mostly show the older stars in NGC 2841, as well as foreground stars in our own Milky Way galaxy. The cooler areas are highlighted in red, and show the dusty, gaseous regions of the galaxy.

Blue shows infrared light of 3.6 microns, green represents 4.5-micron light and red, 8.0-micron light. The contribution from starlight measured at 3.6 microns has been subtracted from the 8.0-micron data to enhance the visibility of the dust features.The shortest wavelengths are displayed inblue, and mostly show the older stars in NGC 2841, as well as foreground stars in our own Milky Way galaxy.

Image Credit:
NASA/JPL-Caltech

Image Addition Date:
2009-04-30