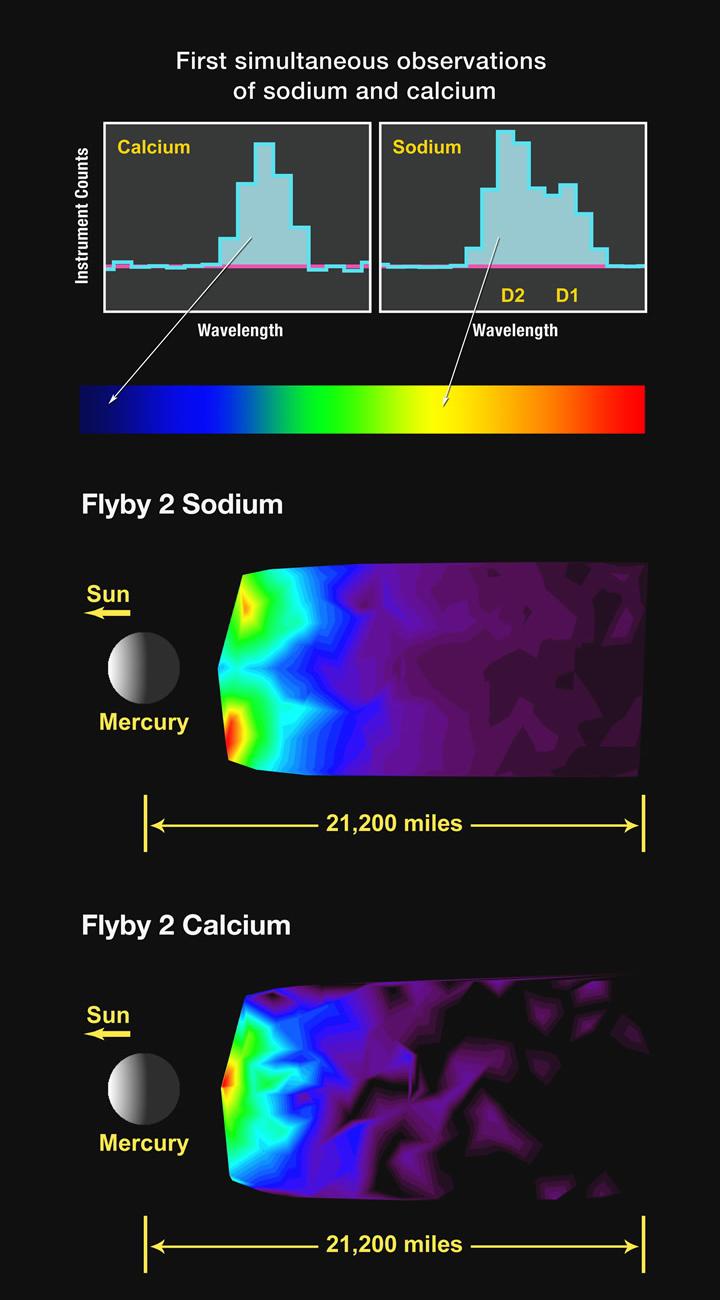
In the upper part of this figure, two histograms represent typical observations in the tail region of Mercury’s exosphere from calcium (left) and sodium (right) atoms. Known as “spectral lines,” these emissions have been scaled to approximately the same peak level for ease of comparison; however, the sodium emission is much brighter than that of calcium. Each emission occurs at a unique wavelength, with that of sodium in the “yellow” part of the visible spectrum and that of calcium in the “blue” part. The sodium emission is actually two very closely spaced emissions that are usually termed the D lines of sodium. The peaks of the two emissions are just separated (indicated by the D2 and D1 labels) in the figure. These are the same emissions that produce the yellow glow in sodium vapor lamps often used in street lighting. Although both sodium and calcium in Mercury’s exosphere have been observed with ground-based telescopes on Earth, this is the first time that measurements of the two species have been obtained simultaneously. Atoms in the exosphere heavier than hydrogen and helium predominantly originate from the surface of Mercury, and a number of processes contribute to their release from the surface material. Differences in the spatial and temporal distributions of the exospheric constituents therefore provide insight into the relative importance of the processes that generate and maintain Mercury’s exosphere.
The middle image of this figure shows the spatial distribution of sodium emission during MESSENGER’s second flyby in the tail region of Mercury, which extends away from the planet in the anti-sunward direction. In the image, north is up and the Sun is to the left. The color scale represents the relative brightness of the sodium emission in the tail. Because the observed emission intensity is related to the number of atoms along the line of sight, images such as this one are a measure of the density of the emitting species. The small-scale structures in these images may be artifacts of the viewing geometry and should not be given too much weight. More important are the broad-scale features that are composed of numerous observations and are therefore a better representation of the overall emission structure. The sodium emission shows two broad peaks that are located close to the planet to the north and south, and there is less emission near the equatorial region.
The bottom image shows the spatial distribution of calcium emission in the tail region of Mercury during the second flyby. In contrast to the sodium emission, the calcium emission is mostly symmetric about the equatorial region and less bright near polar regions. The spatial variations between the calcium and sodium distributions indicate that the processes controlling these two species are likely different.
Date Acquired: October 6, 2008
Instrument: Mercury Atmospheric and Surface Composition Spectrometer (MASCS)
These images are from MESSENGER, a NASA Discovery mission to conduct the first orbital study of the innermost planet, Mercury. For information regarding the use of images, see the MESSENGER image use policy.
 Planetary Data System


