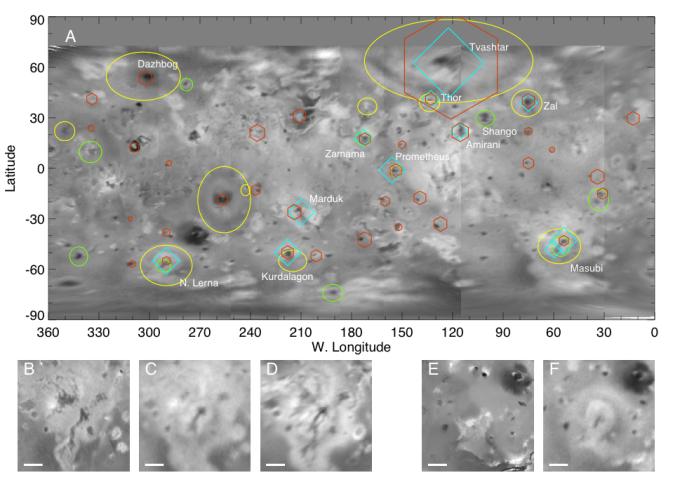
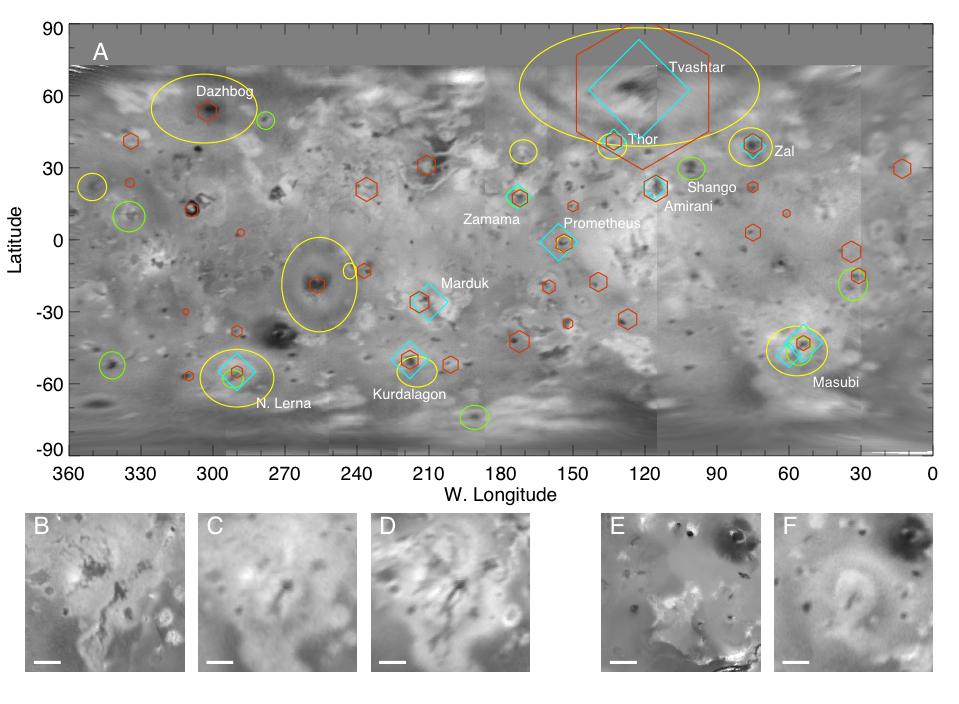
A: A global map of Jupiter's moon Io derived from eight images taken by the Long Range Reconnaissance Imager (LORRI) on the New Horizons spacecraft, as it passed Jupiter on its way to Pluto in late February 2007. Details as small as 12 kilometers (7 miles) are visible. The map shows the comprehensive picture of Io's volcanism obtained by New Horizons. Yellow ovals denote areas with new, faded or shifted plume deposits since the last images taken by the Galileo spacecraft in 2001. Green circles denote areas where probable new lava flows have occurred. Cyan diamonds indicate locations of active volcanic plumes, and orange hexagons are volcanic hot spots detected by the Linear Etalon Imaging Spectral Array (LEISA) instrument. For plumes and hot spots, symbol size indicates the approximate relative size and brightness of the features.
B-F: Comparison of New Horizons (NH) and earlier images of major surface changes discovered by New Horizons at Io's volcanoes Masubi (45 degrees S, 57 degrees West) and North Lerna (55 degrees S, 290 degrees W). The scale bars are 200 kilometers long, and a is the solar phase angle. At Masubi, old lava flows seen by Voyager and Galileo (B) have been obscured at low phase angles (C) by deposits from two active plumes associated with a new 240-kilometer (150-mile) long dark lava flow, which is the longest lava flow known to have been erupted in the solar system since the discovery of Io volcanism in 1979. At North Lerna, a recent eruption has generated a 130-km long lava flow (F), as well as an active plume that has produced a concentric pattern of deposits.