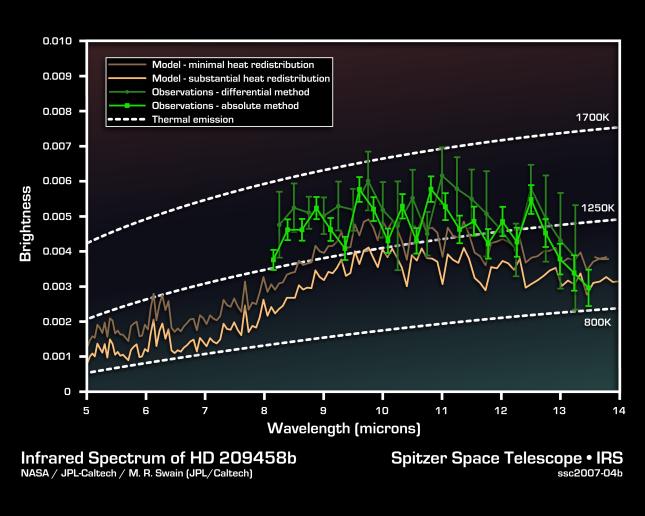
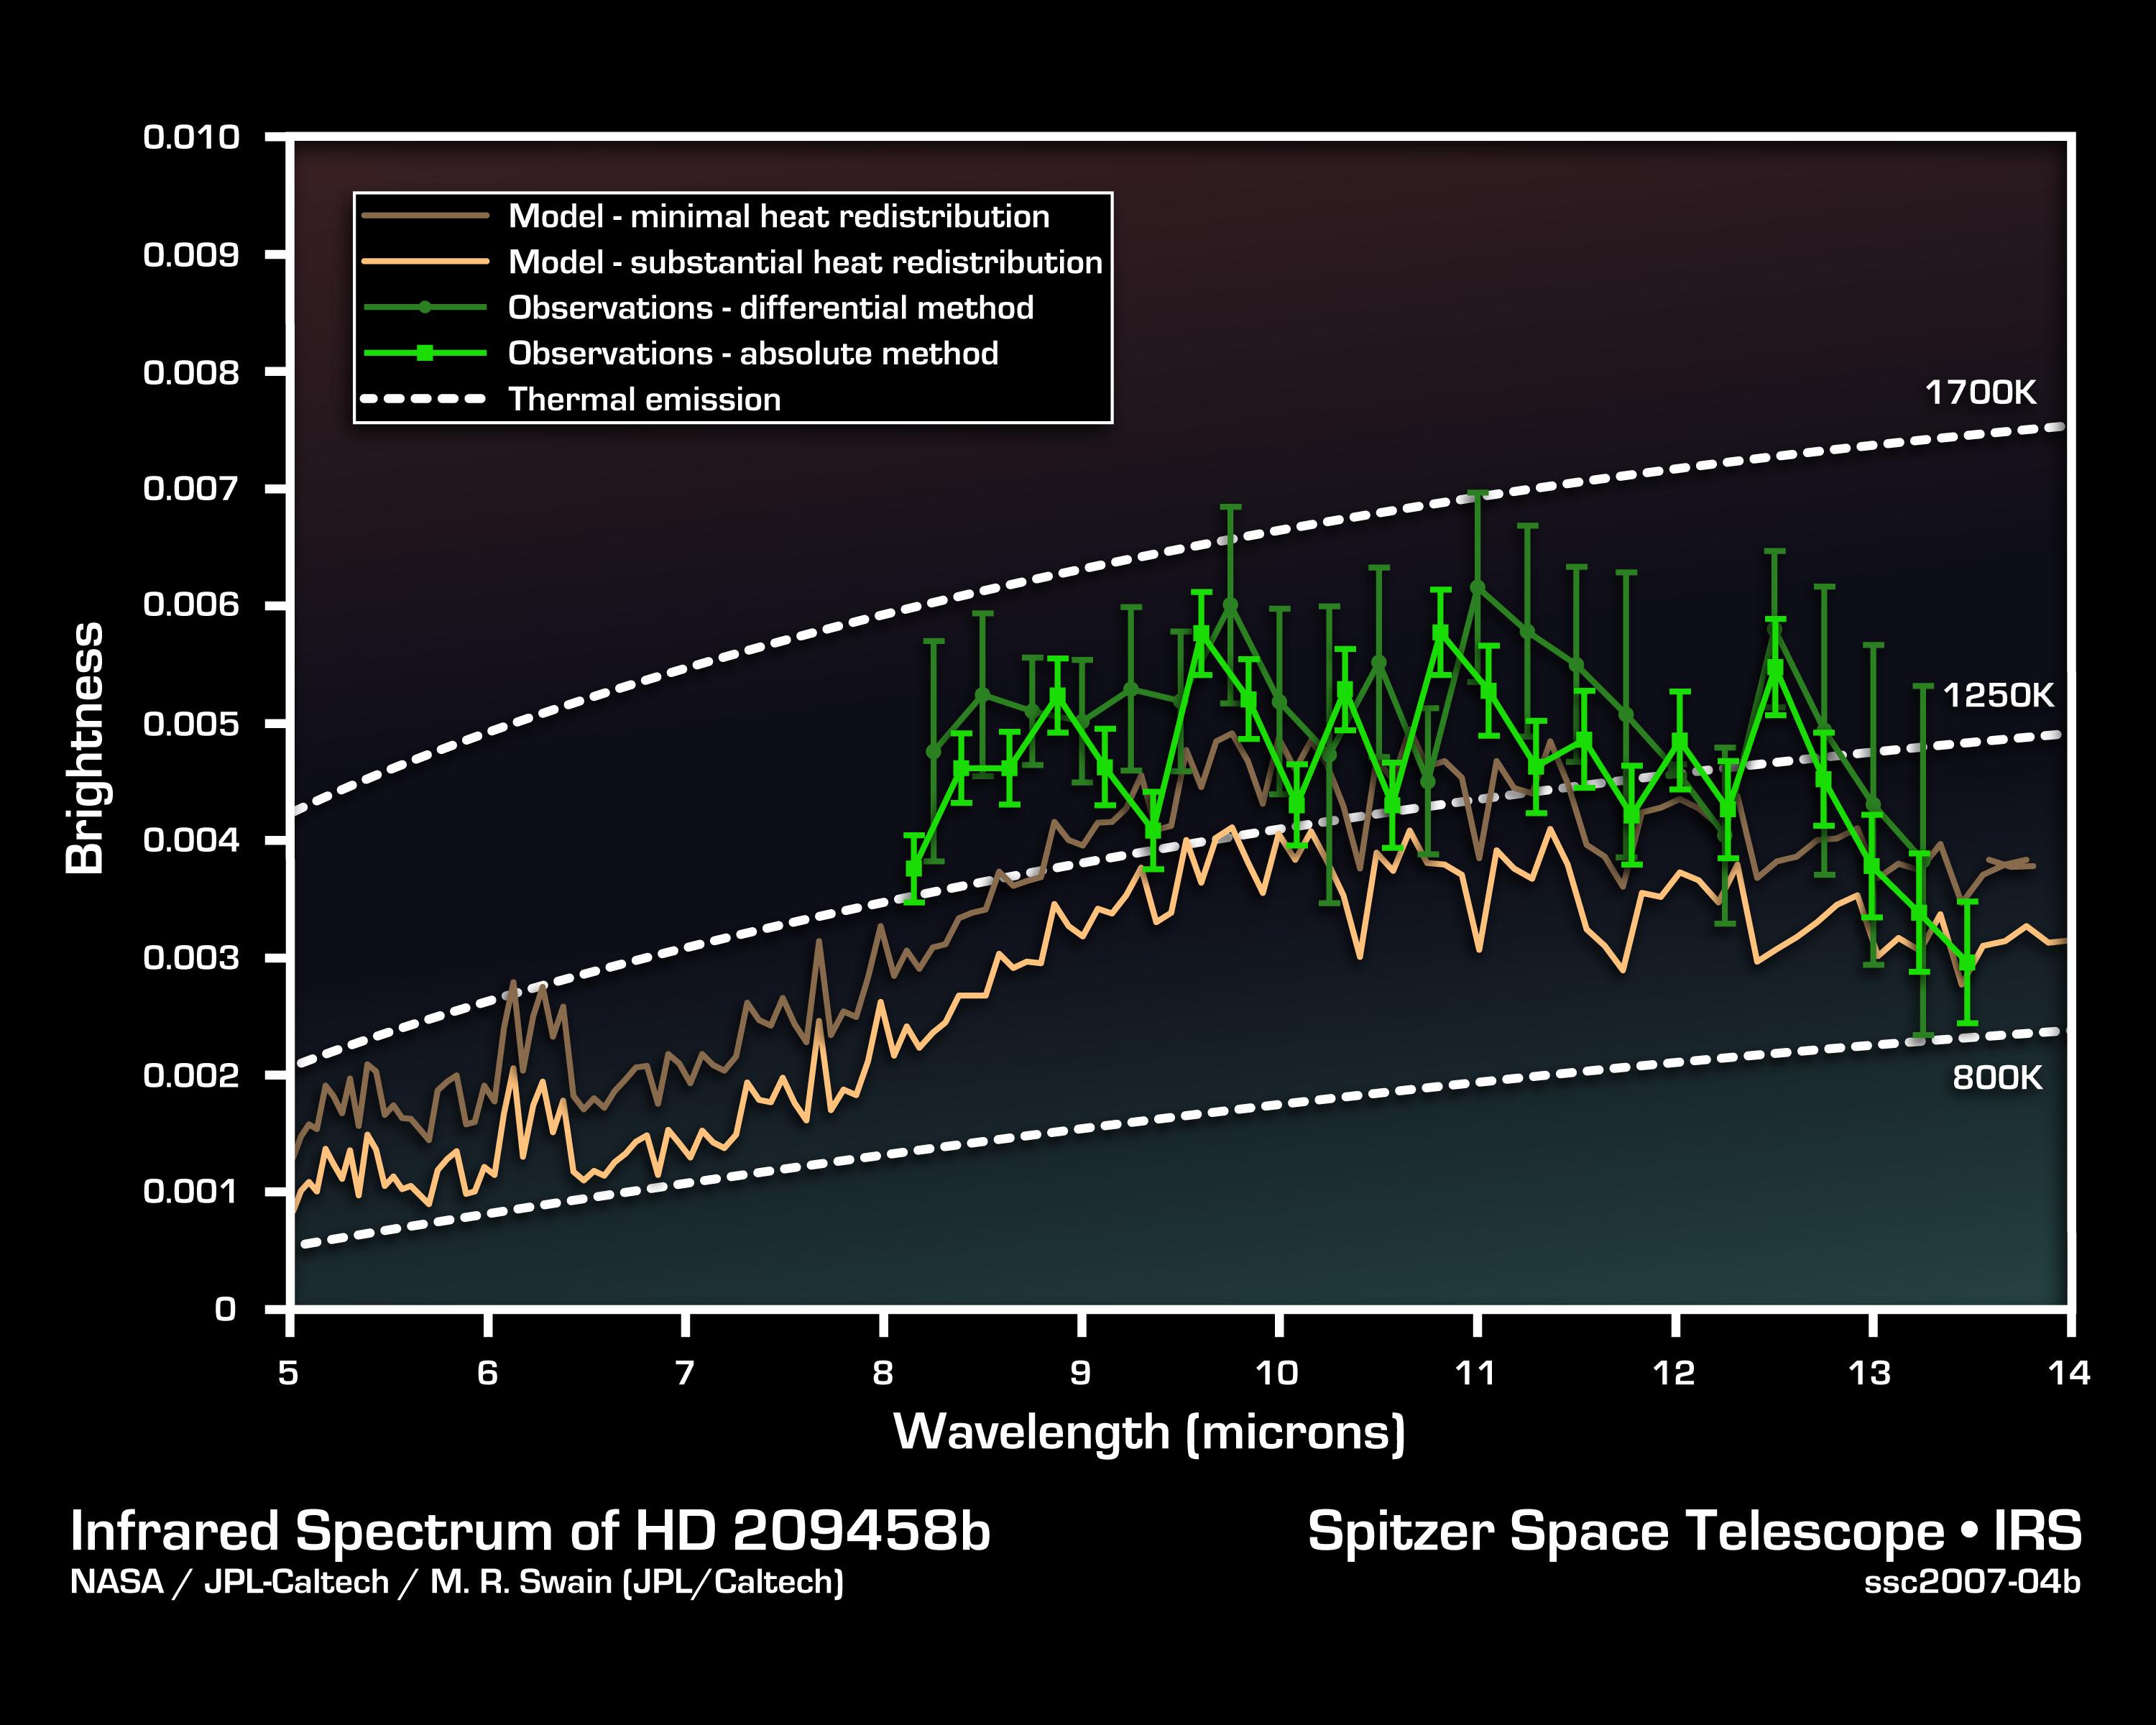
This infrared data from NASA's Spitzer Space Telescope - called a spectrum - tells astronomers that a distant gas planet, a so-called "hot Jupiter" called HD 209458b, might be smothered with high clouds. It is one of the first spectra of an alien world.
A spectrum is created when an instrument called a spectrograph spreads light from an object apart into a rainbow of different wavelengths. Patterns or ripples within the spectrum indicate the presence, or absence, of molecules making up the object.
Astronomers using Spitzer's spectrograph were able to obtain infrared spectra for two so-called "transiting" hot-Jupiter planets using the "secondary eclipse" technique. In this method, the spectrograph first collects the combined infrared light from the planet plus its star, then, as the planet is eclipsed by the star, the infrared light of just the star. Subtracting the latter from the former reveals the planet's own rainbow of infrared colors.
When astronomers first saw the infrared spectrum above, they were shocked. It doesn't look anything like what theorists had predicted. Theorists though the spectra for hot, Jupiter-like planets like this one would be filled with the signatures of molecules in the planets' atmospheres. But the spectrum doesn't show any molecules. It is what astronomers call "flat." For example, theorists thought there'd be signatures of water in the wavelength ranges of 8 to 9 microns. The fact that water is not seen there might indicate that the water is hidden under a thick blanket of high, dry clouds.
This spectrum was produced by Dr. Mark R. Swain of NASA's Jet Propulsion Laboratory in Pasadena, Calif., using a complex set of mathematical tools. It was derived using two different methods, both of which led to the same result. The data were taken on July 6 and 13, 2005, by Dr. Jeremy Richardson of NASA's Goddard Space Flight Center and his team using Spitzer's infrared spectrograph.
 Planetary Data System


