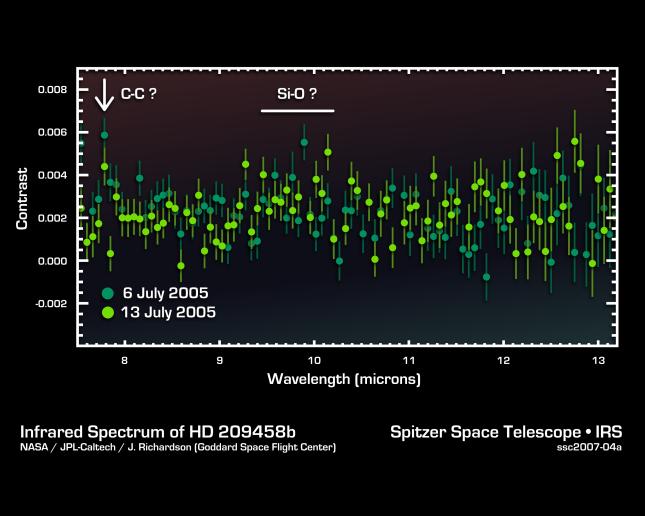
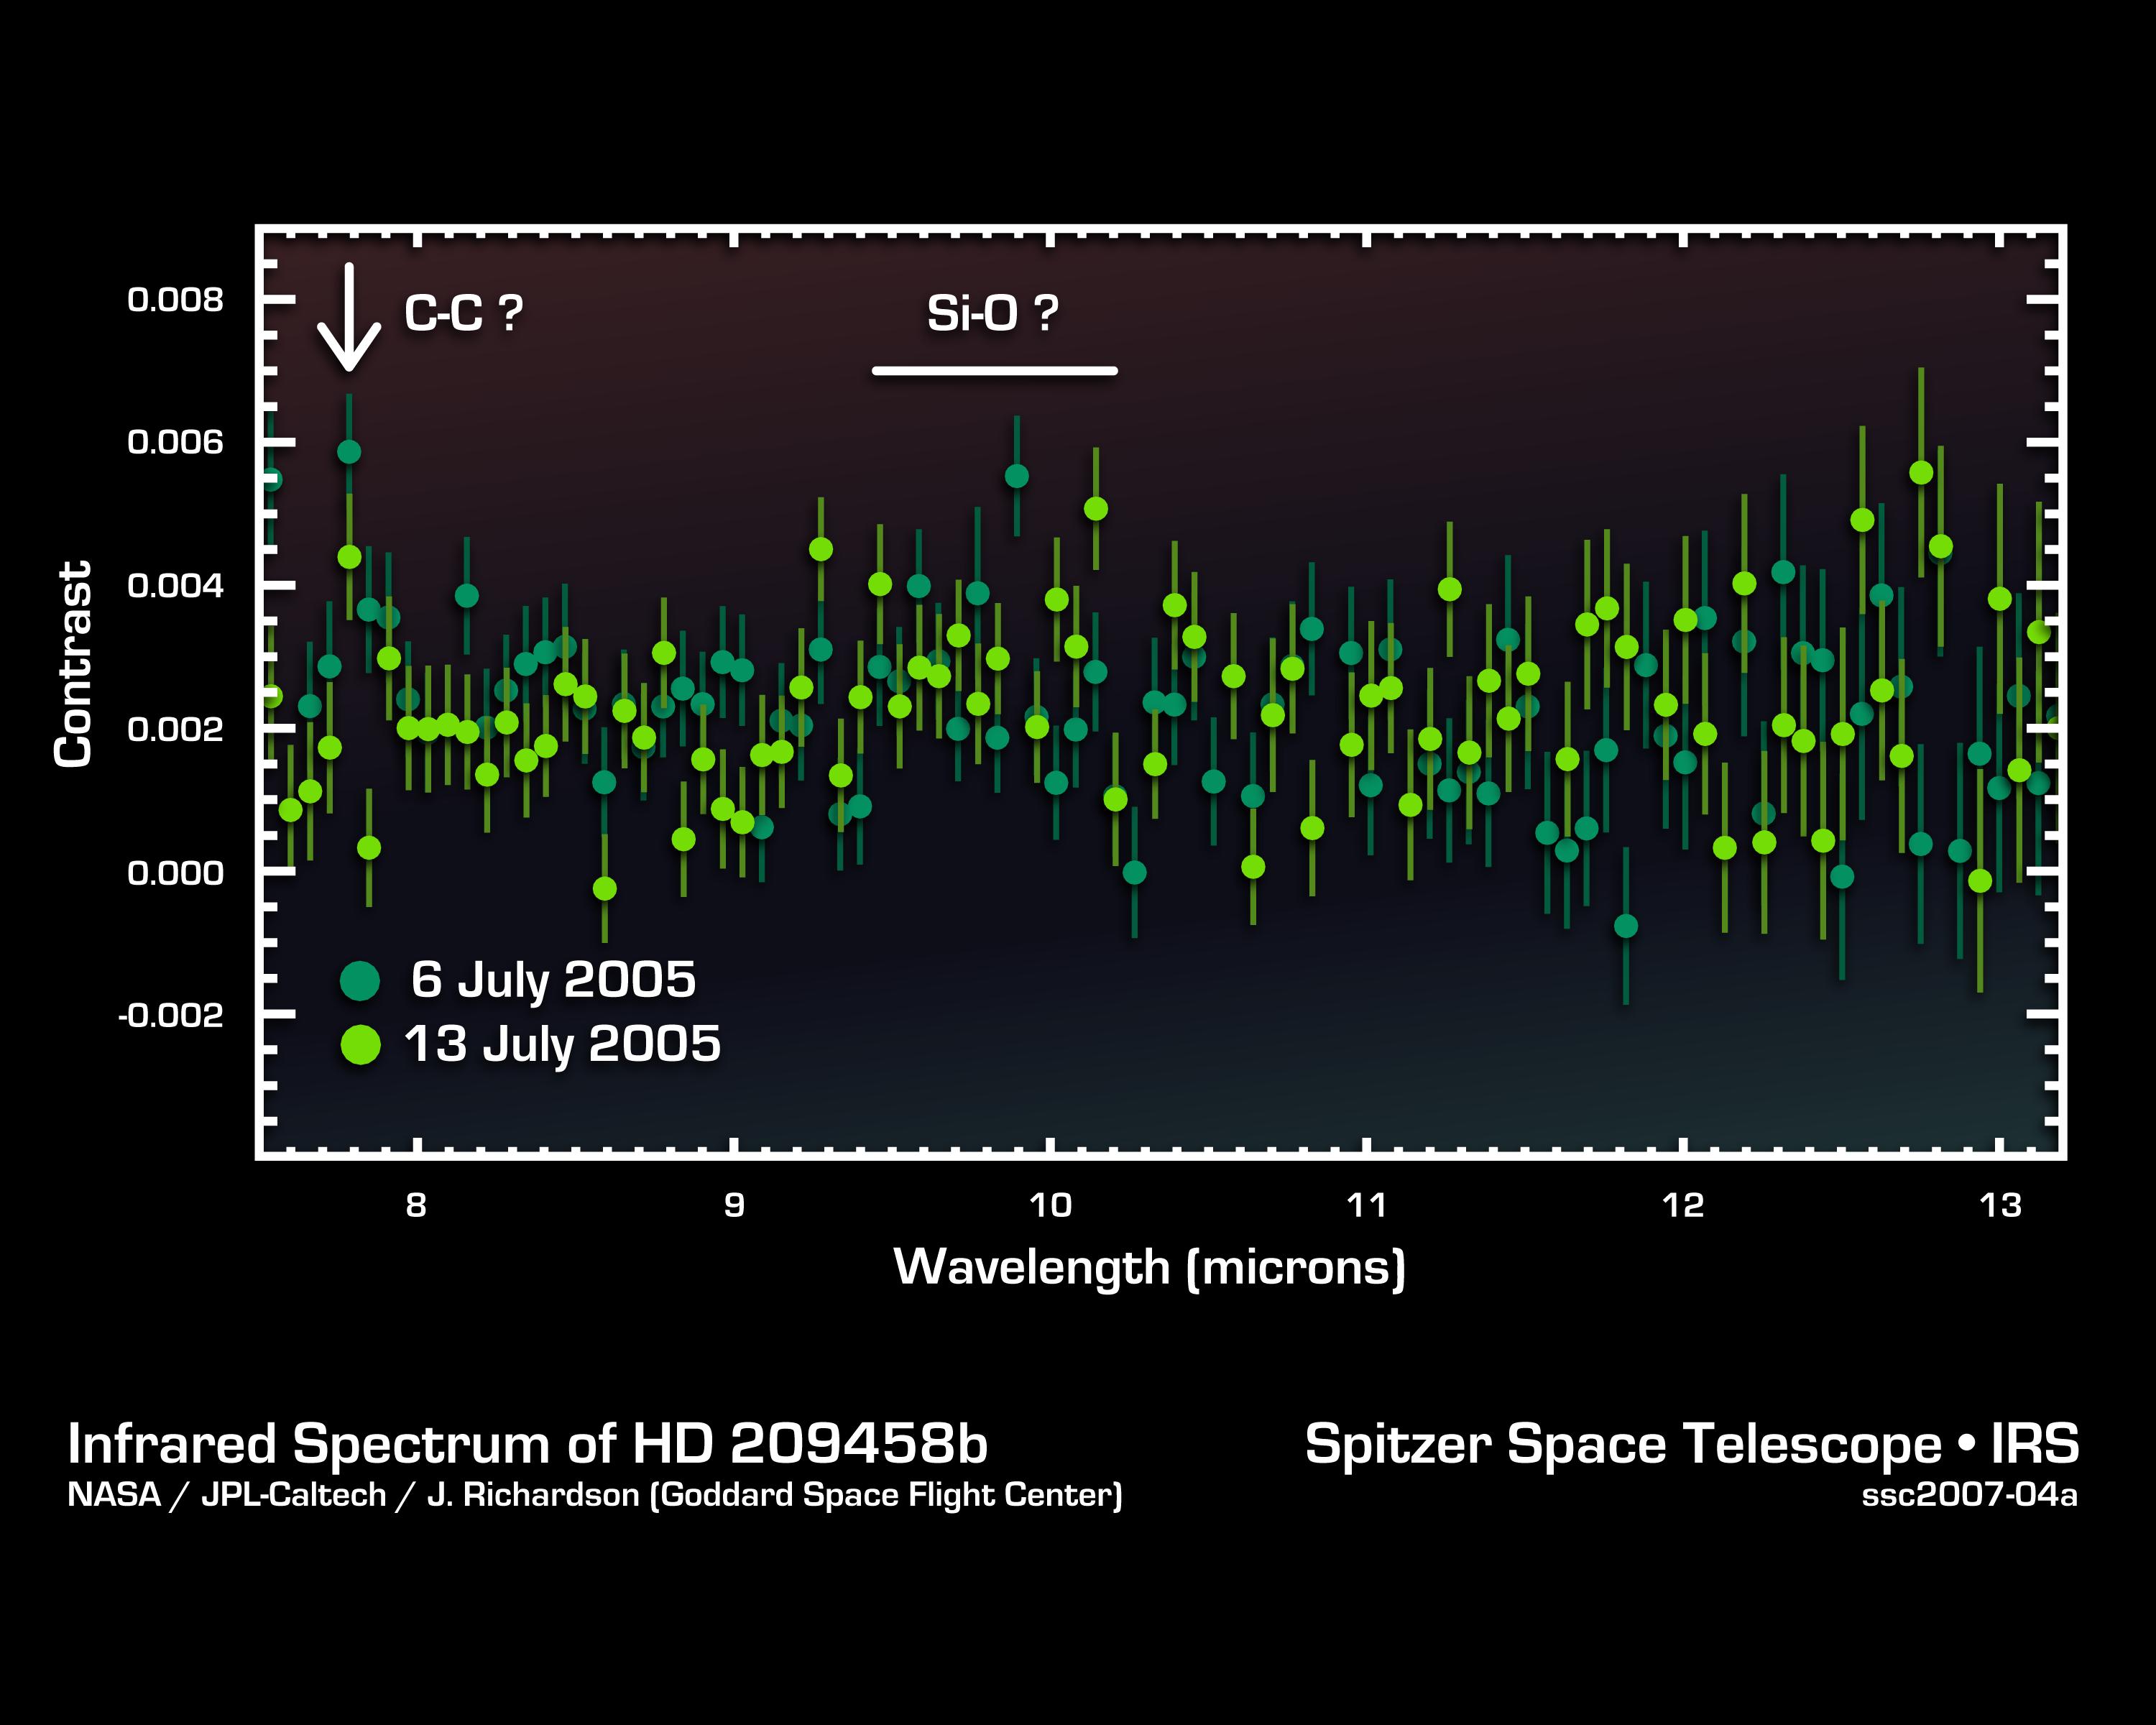
This infrared data from NASA's Spitzer Space Telescope - called a spectrum - tells astronomers that a distant gas planet, a so-called "hot Jupiter" called HD 209458b, might be smothered with high clouds. It is one of the first spectra of an alien world.
A spectrum is created when an instrument called a spectrograph cracks light from an object open into a rainbow of different wavelengths. Patterns or ripples within the spectrum indicate the presence, or absence, of molecules making up the object.
Astronomers using Spitzer's spectrograph were able to obtain infrared spectra for two so-called "transiting" hot-Jupiter planets using the "secondary eclipse" technique. In this method, the spectrograph first collects the combined infrared light from the planet plus its star, then, as the planet is eclipsed by the star, the infrared light of just the star. Subtracting the latter from the former reveals the planet's own rainbow of infrared colors.
When astronomers first saw the infrared spectrum above, they were shocked. It doesn't look anything like what theorists had predicted. For example, theorists thought there'd be signatures of water in the wavelength ranges of 8 to 9 microns. The fact that water is not detected might indicate that it is hidden under a thick blanket of high, dry clouds.
In addition, the spectrum shows signs of silicate dust -- tiny grains of sand -- in the wavelength range of 9 to 10 microns. This suggests that the planet's skies could be filled with high clouds of dust unlike anything seen in our own solar system.
There is also an unidentified molecular signature at 7.78 microns. Future observations using Spitzer's spectrograph should be able to determine the nature of the mysterious feature.
This spectrum was produced by Dr. Jeremy Richardson of NASA's Goddard Space Flight Center, Greenbelt, Md. and his colleagues. The data were taken by Spitzer's infrared spectrograph on July 6 and 13, 2005.
 Planetary Data System


