- Original Caption Released with Image:
-
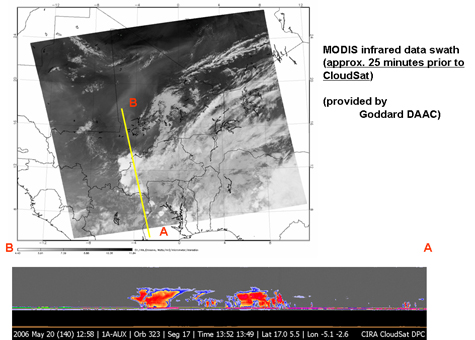
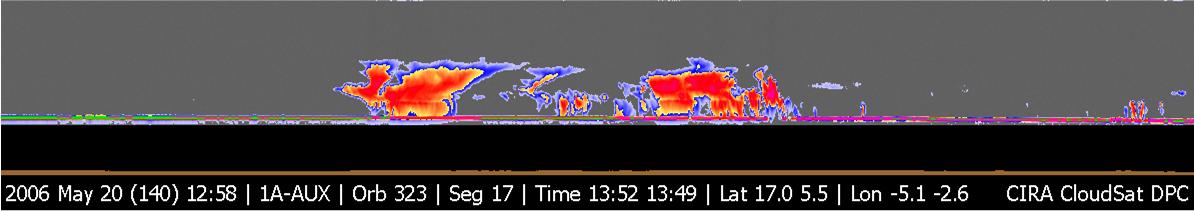
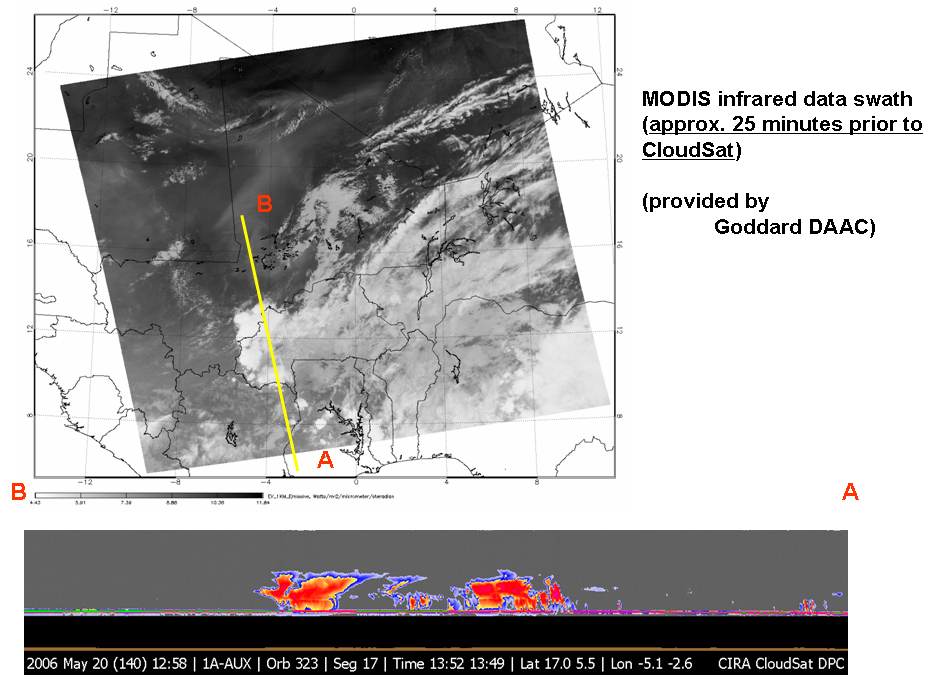
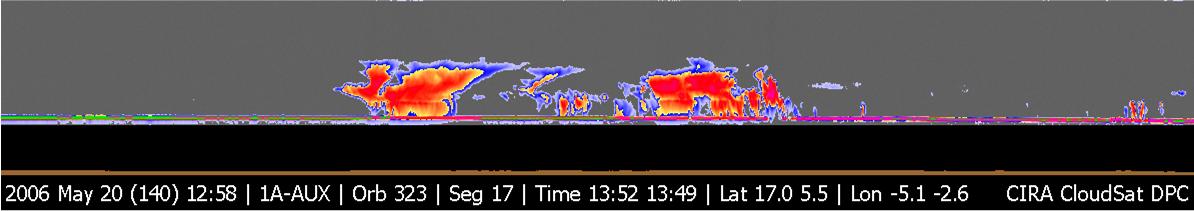
Figure 1CloudSat image of a horizontal cross-section of tropical clouds and thunderstorms over east Africa. The red colors are indicative of highly reflective particles such as water (rain) or ice crystals, which the blue indicates thinner clouds (such as cirrus). The flat green/blue lines across the bottom represent the ground signal. The vertical scale on the CloudSat Cloud Profiling Radar image is approximately 30 kilometers (19 miles). The brown line below the image indicates the relative elevation of the land surface. The inset image shows the CloudSat track relative to a Moderate Resolution Imaging Spectroradiometer (MODIS) visible image taken at nearly the same time.
- Image Credit:
-
NASA/JPL/The Cooperative Institute for Research in the Atmosphere (CIRA),
Colorado State University
Image Addition Date: -
2006-06-06
|