- Original Caption Released with Image:
-
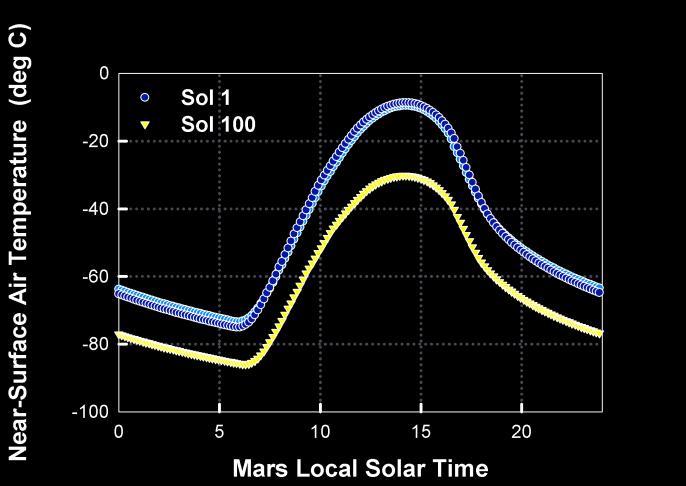
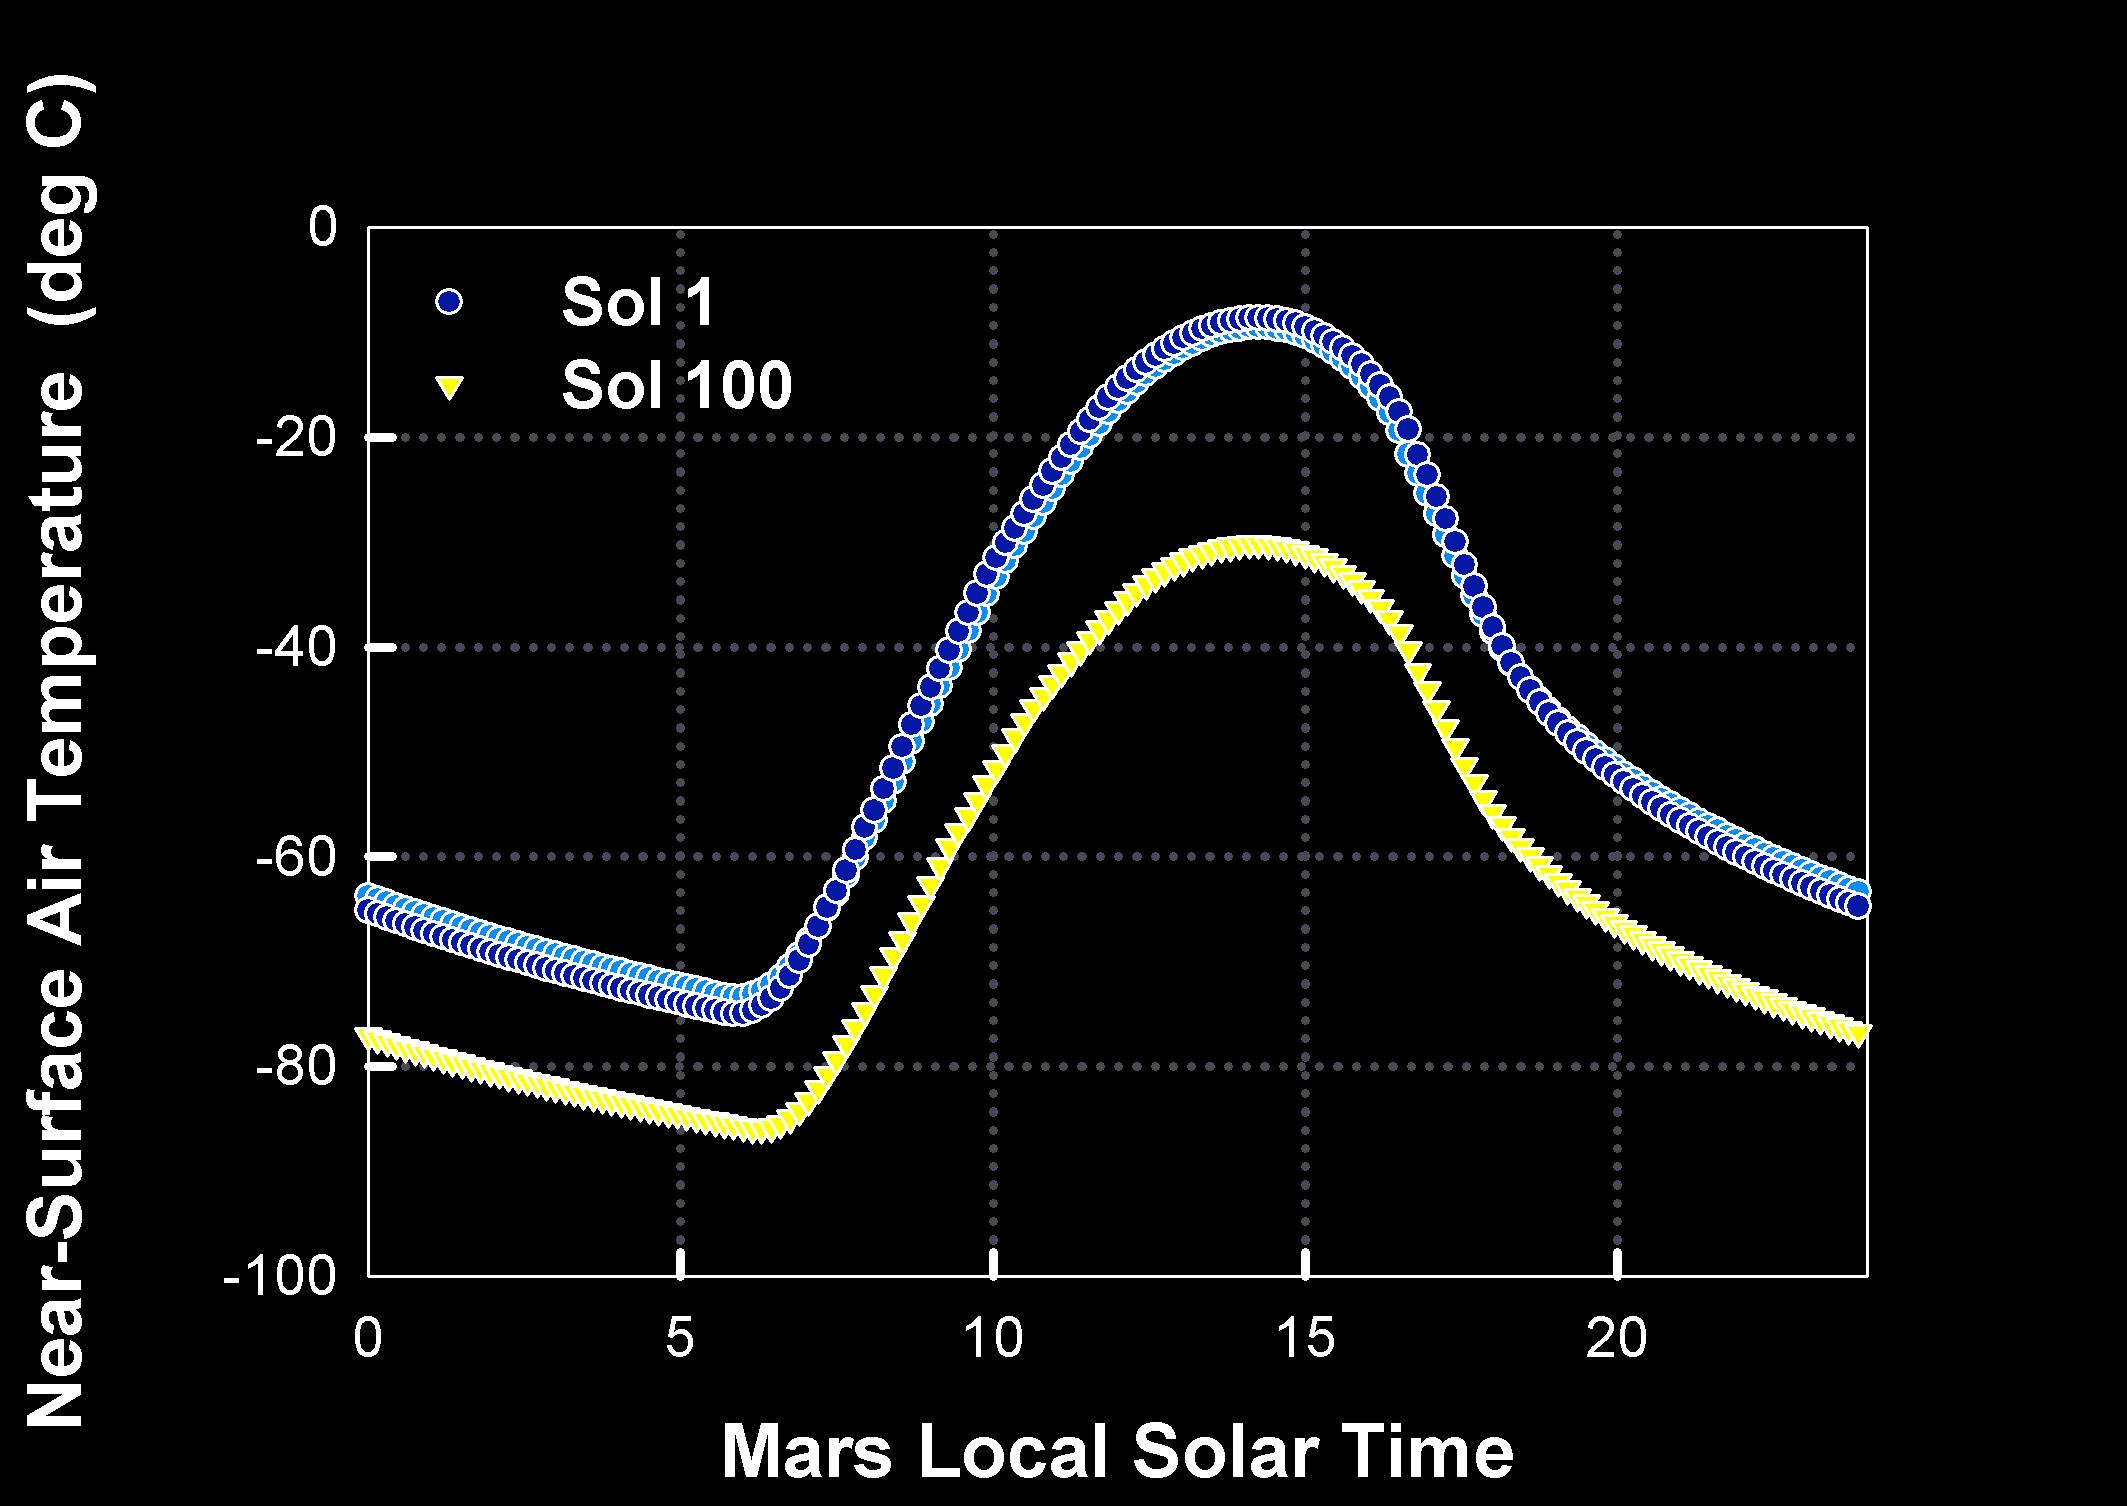
This graph shows the predicted daily change in the atmospheric temperature one meter above the surface of Mars at Gusev Crater, the Mars Exploration Rover Spirit's landing site. The blue curve denotes predicted values for sol 1 (the first day of Spirit's mission) and the yellow for sol 100 (100 days into the mission). The light blue symbols represent temperatures for a total atmospheric dust abundance of 0.7 visible optical depth units, and the darker blue symbols for a total atmospheric dust abundance of 1.0 visible optical depth units. Scientists use this data to ensure that Spirit stays within the right temperature range.
- Image Credit:
-
NASA/JPL/ARC/New Mexico State University
Image Addition Date: -
2004-01-12
|