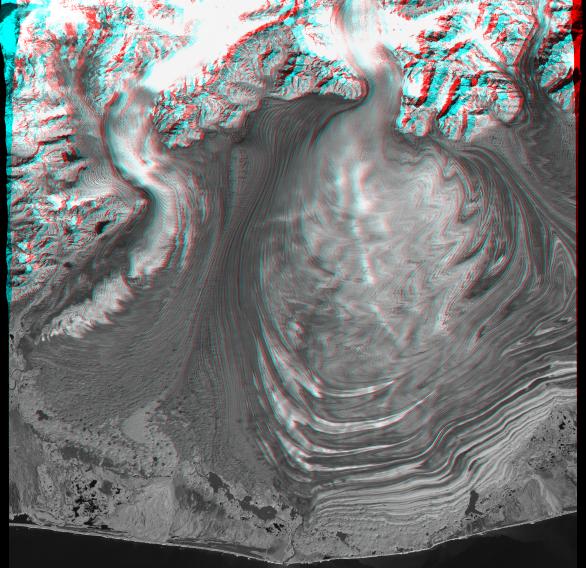
This anaglyph view of Malaspina Glacier in southeastern Alaska was created from a Landsat satellite image and an elevation model generated by the Shuttle Radar Topography Mission (SRTM). Malaspina Glacier is considered the classic example of a piedmont glacier. Piedmont glaciers occur where valley glaciers exit a mountain range onto broad lowlands, are no longer laterally confined, and spread to become wide lobes. Malaspina Glacier is actually a compound glacier, formed by the merger of several valley glaciers, the most prominent of which seen here are Agassiz Glacier (left) and Seward Glacier (right). In total, Malaspina Glacier is up to 65 kilometers (40 miles) wide and extends up to 45 kilometers (28 miles) from the mountain front nearly to the sea.
Glaciers erode rocks, carry them down slope, and deposit them at the edge of the melting ice, typically in elongated piles called moraines. The moraine patterns at Malaspina Glacier are quite spectacular in that they have huge contortions that result from the glacier crinkling as it gets pushed from behind by the faster-moving valley glaciers.
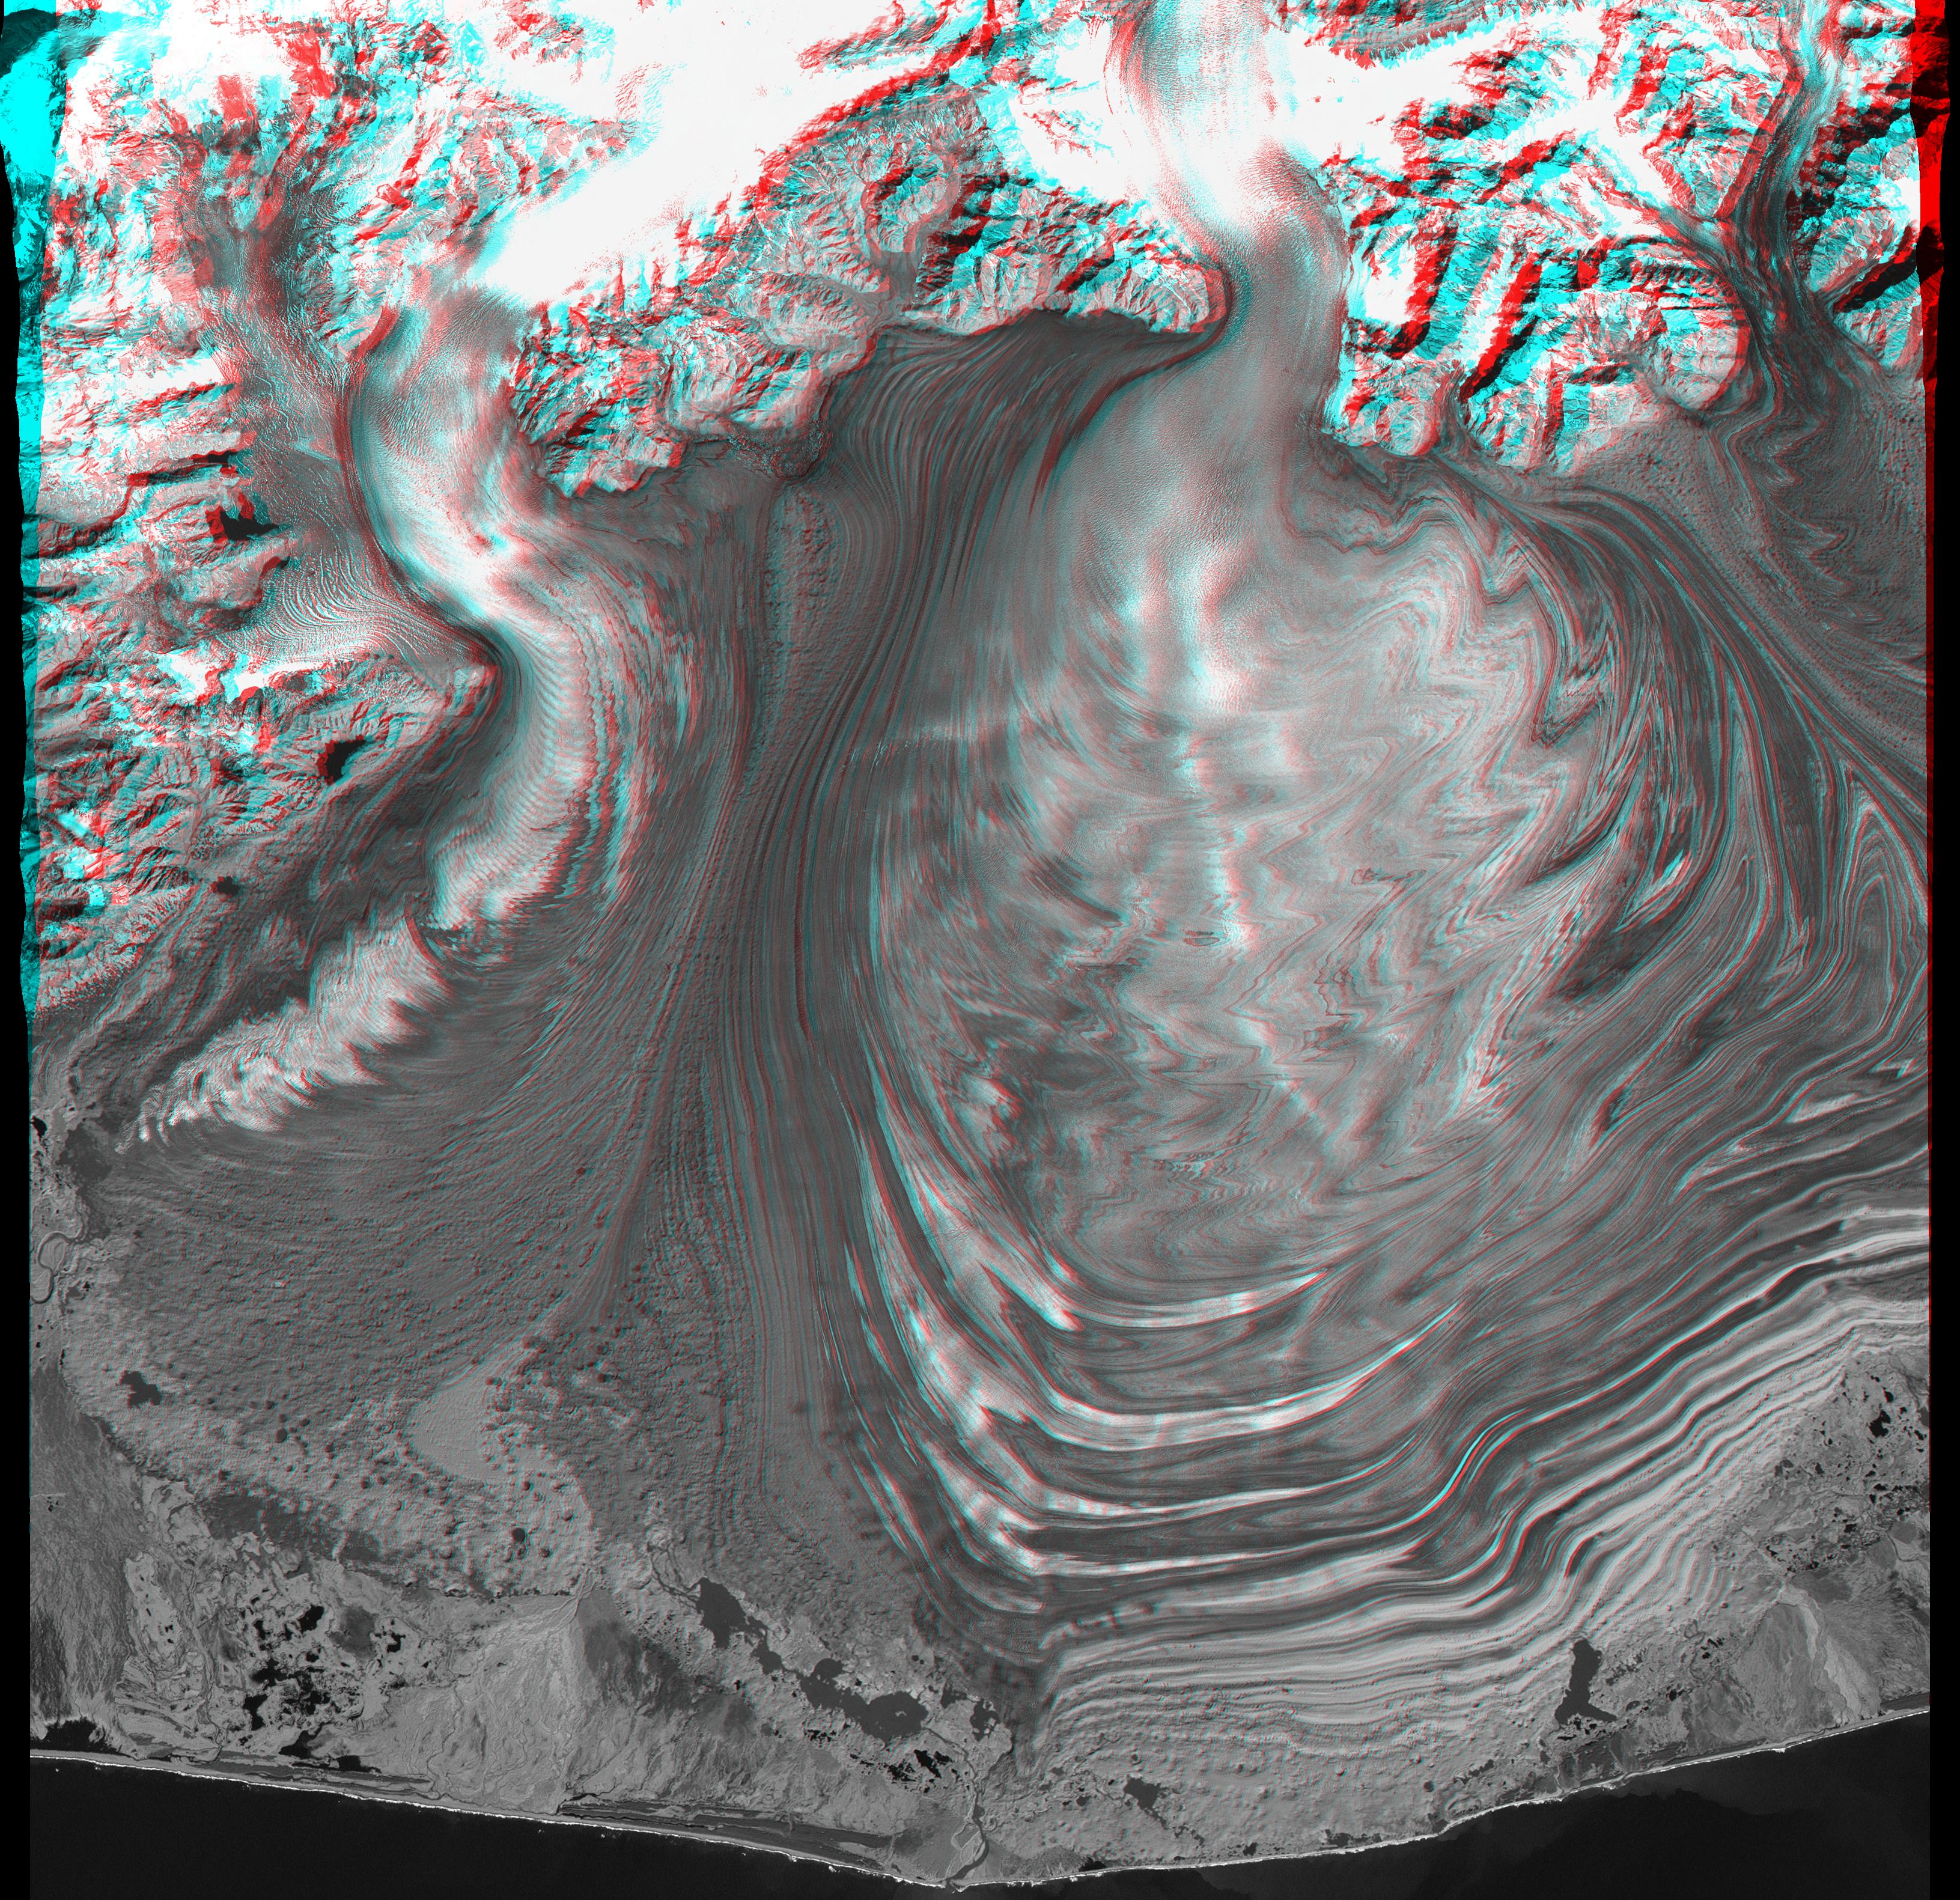
Numerous other features of the glaciers and the adjacent terrain are clearly seen when viewing this image at full resolution. The series of tonal arcs on Agassiz Glacier's extension onto the piedmont are called "ogives." These arcs are believed to be seasonal features created by deformation of the glacier as it passes over bedrock irregularities at differing speeds through the year. Assuming one light-and-dark ogive pair per year, the rate of motion of the glacial ice can be estimated (in this case, about 200 meters per year where the ogives are most prominent). Just to the west, moraine deposits abut the eroded bedrock terrain, forming a natural dam that has created a lake. Near the northwest corner of the scene, a recent landslide has deposited rock debris atop a small glacier. Sinkholes are common in many areas of the moraine deposits. The sinkholes form when blocks of ice are caught up in the deposits and then melt, locally collapsing the deposit. The combination of Landsat imagery and SRTM elevation data used in this stereoscopic display is very effective in visualizing these and other features of this terrain.
The stereoscopic effect of this anaglyph was created by registering a Landsat image to the SRTM elevation model and then generating two differing perspectives, one for each eye. When viewed through special glasses, the result is a vertically exaggerated view of the Earth's surface in its full three dimensions. Anaglyph glasses cover the left eye with a red filter and cover the right eye with a blue filter.
Landsat has been providing visible and infrared views of the Earth since 1972. SRTM elevation data matches the 30-meter (98-foot) resolution of most Landsat images and substantially helps in analyzing the large and growing Landsat image archive.
Elevation data used in this image were acquired by the Shuttle Radar Topography Mission aboard the Space Shuttle Endeavour, launched on February 11, 2000. The mission used the same radar instrument that comprised the Spaceborne Imaging Radar-C/X-Band Synthetic Aperture Radar that flew twice on the Space Shuttle Endeavour in 1994. The Shuttle Radar Topography Mission was designed to collect three-dimensional measurements of the Earth's surface. To collect the 3-D data, engineers added a 60-meter-long (200-foot) mast, installed additional C-band and X-band antennas, and improved tracking and navigation devices. The mission is a cooperative project between NASA, the National Imagery and Mapping Agency of the U.S. Department of Defense, and the German and Italian space agencies. It is managed by NASA's Jet Propulsion Laboratory, Pasadena, CA, for NASA's Earth Science Enterprise, Washington, DC.
Size: 55 x 55 kilometers (34 x 34 miles)
Location: 60 deg N latitude, 140 deg W longitude
Orientation: North at top
Image Data: Landsat Thematic Mapper visible and infrared band mix
Original Data Resolution: SRTM 1 arcsecond (30 meters or 98 feet), Landsat 30 meters (98 feet)
Date Acquired: February 2000 (SRTM), 31 August 2000 (Landsat)
 Planetary Data System


