Animation
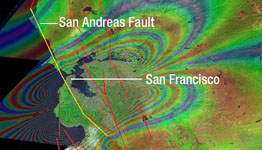
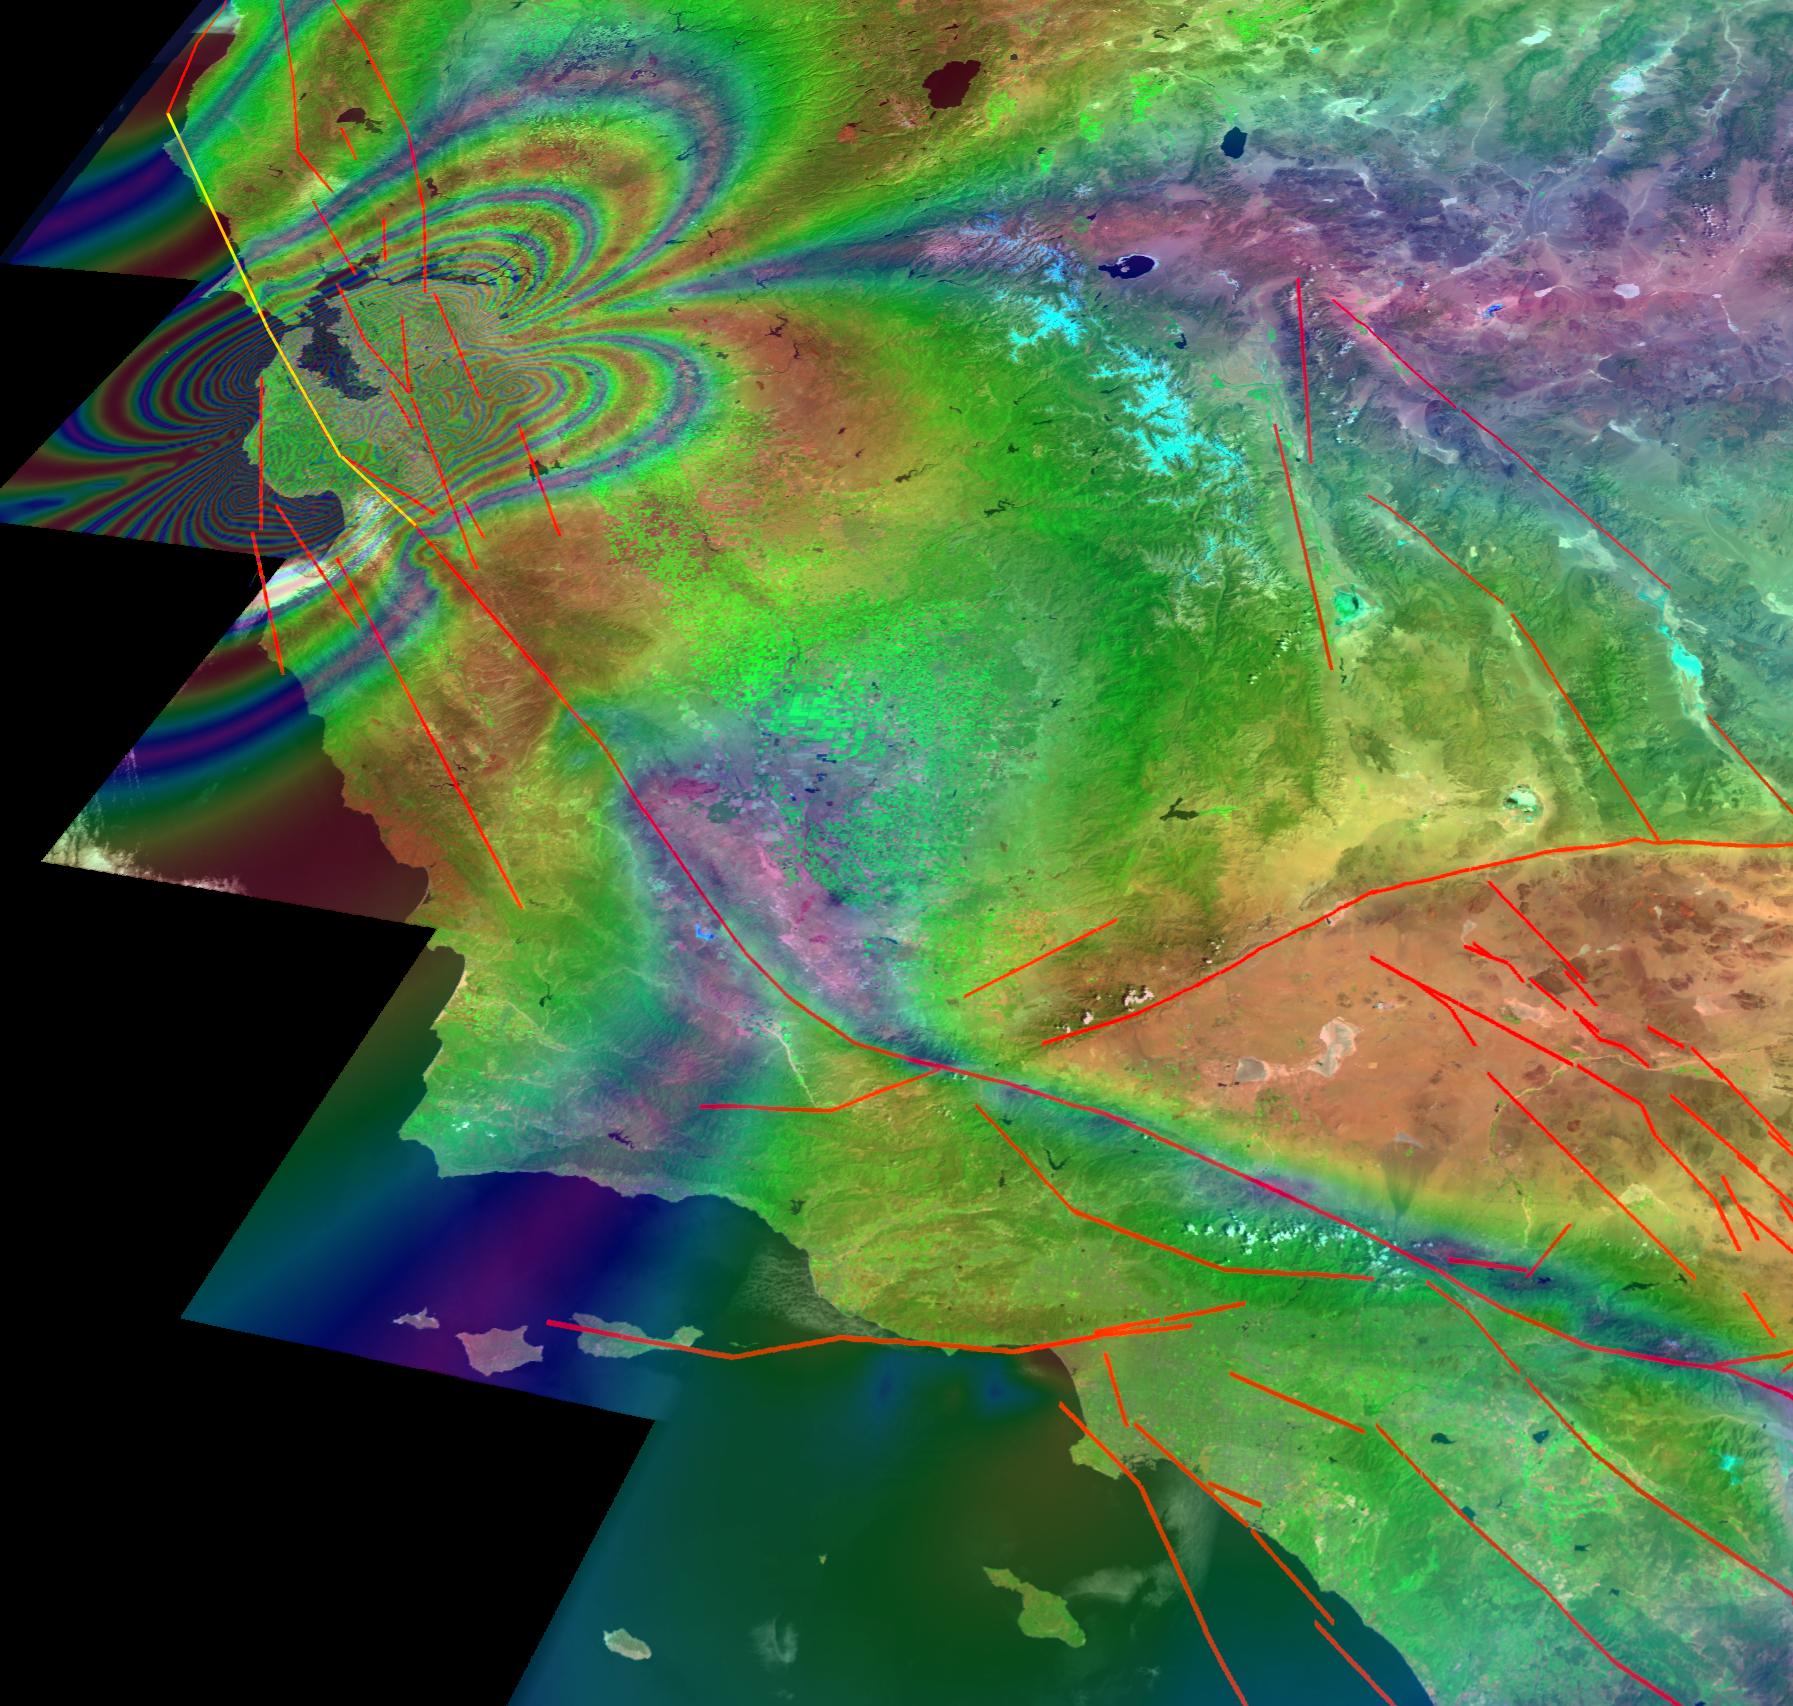
New Forecast of San Francisco Earthquake RiskThis illustration depicts synthetic aperature radar patterns of seismic deformations associated with a model earthquake on the San Francisco section of the San Andreas Fault (depicted in yellow). Each complete interferometric fringe color cycle corresponds to a displacement of 56 millimeters (2.2 inches).
A new computer simulation developed by scientists from JPL; the University of California, Davis; and other institutions concludes the region has a 25 percent chance of a magnitude 7 or greater earthquake in the next 20 years, and a roughly 1 percent chance of such an earthquake each year, according to the "Virtual California" computer simulation.
The Virtual California approach to earthquake forecasting is similar to the computer models used for weather forecasting. A previous forecast of earthquake hazards, the Working Group on California Earthquake Probabilities, used records of past earthquakes to calculate the probability of future ones.
The Virtual California model includes 650 segments representing the major fault systems in California, including the San Andreas fault responsible for the 1906 San Francisco earthquake. The simulation takes into account the gradual movement of faults and how they interact with each other.
The researchers used the model to simulate 40,000 years of earthquakes in California. They found almost 400 major (magnitude 7 or above) earthquakes at an average interval of 101 years. The simulation data indicates a 25 percent chance of another such earthquake in the next 20 years, a 50 percent chance in the next 45 years and a 75 percent chance by 2086.
About the animation:
This is an example of a 1000-year simulation produced by the computer code "Virtual California" visually rendered by the RIVA software. The map is a LandSat image of California, and the black lines represent the major strike-slip earthquake faults. In the model, the faults are divided into 650 segments, each approximately 10 km long, and exactly 15 km deep. After the movie is started, the viewer will see a series of "butterfly" images of various sizes centered on the faults. The butterflies represent the displacement of the ground surface as they would be reconstructed from observations taken by an interferometric radar satellite having a radar wavelength of 5.7 cm. The sizes of the butterflies are related to the sizes of the earthquakes they represent. The color contours can be interpreted as a kind of contour map of the change in ground displacement due to an earthquake, with each color cycle (i.e., red-blue-red) representing 5.7 cm of displacement along the line of sight to the spacecraft. The displacement changes are computed over a time interval of 5 years, and each movie frame represents an advance of 1 year in the ground displacement. The viewer can easily see that an important characteristic of the earthquakes in the simulation is the clustering of the earthquake butterflies in space and time. Clustering of this type is also seen in real earthquakes, and the simulations tell us that it is due to the elastic interactions between fault segments, combined with the nonlinear nature of the friction law governing slip on each fault segment.
 Planetary Data System


