The early part of the Mars Global Surveyor mission provided good TES coverage of the Mars south polar region. These data allow mapping of the polar cap recession, surface and atmospheric temperatures, and albedo features found within the seasonal cap itself (Kieffer et al., 1998, Titus et al., 1998).
During the period observed, the seasonal south polar cap retreated continuously and asymmetrically around the geographic pole, much the way Viking observed in 1976-1977 (Kieffer et al., 1977). One of the most dominant albedo features on the seasonal cap is a region that appears almost as dark as bare ground, but yet remains cold. We refer to this region, generally located between latitudes 85°S and 75°S and longitudes 150°W and 310°W, as the Cryptic region.
A re-examination of the IRTM data revealed that the Cryptic region was not unique to the TES era, but also was quite apparent during the Viking era. Interesting enough, Antoniadi (Blunck, 1977) observed dark regions forming on the season cap that loosely correlates to the Cryptic region: Depressio Magna (1909) and Depressio Parva (1929). These depressios were located at 270° W, 78°S and 166° W, 76°S, respectively.
Analysis of both the TES and IRTM data indicate that the Cryptic region is unique in its thermophysical properties relative to the rest of the cap. The region is a repeatable event that occupies the same general area from year to year. It is darker and slightly warmer than the rest of the south polar cap. Even though the Cryptic region is slightly warmer, it must still be CO2 buffered since it remains "cold" for several days.
Spectral analysis of the TES longward of the 15 micron atmospheric band shows that the Cryptic region shows less spectral than the rest of the polar cap. This suggests that the region may be composed of "ice," as opposed to snow or frost (Hansen, 1998). Further spectral analysis on going.
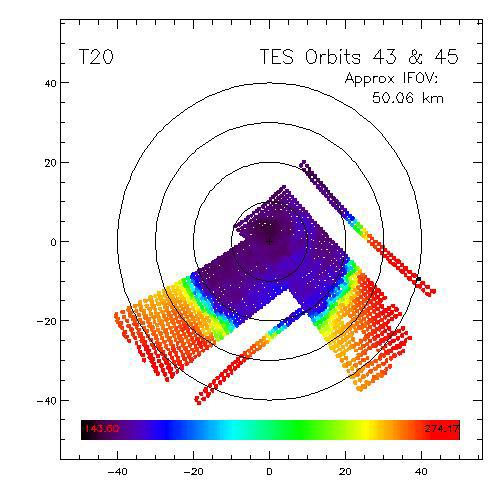
This image is a map of TES data, showing TES "T20" of the south polar cap. (The TES "T20" is a synthetic band created by convolving the response function of the IRTM 20µm filter with the TES spectra.) The image is a composite from the first rolls of orbit 43 (Ls =219.2°, Nov 17, 1997) and orbit 45 (Ls=220.8°, Nov 20, 1997). The Cryptic region is the blue area curving along the 80°S latitude line. The region shows up in this image as only slightly warmer than the rest of the polar cap, but still too cold to be bare ground.
See also the Lambert Albedo Image PIA02332.
 Planetary Data System


