PIA01936: Fire and Ice Planet (Artist Concept)
 Mission:  Spitzer Space Telescope
 Product Size:  640 x 479 pixels (w x h)
 Produced By:  California Institute of Technology 
 Full-Res TIFF:  PIA01936.tif (920.9 kB)
 Full-Res JPEG:  PIA01936.jpg (22.82 kB)

Click on image above for all movie download options

Original Caption Released with Image:

Click here for movie without data of PIA01936 Fire and Ice PlanetClick here for movie with data of PIA01936 Fire and Ice Planet
Movie without DataMovie with Data

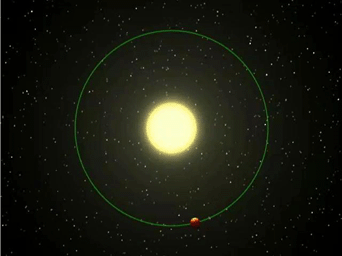
This artist's animation shows a blistering world revolving around its nearby "sun." NASA's infrared Spitzer Space Telescope observed a planetary system like this one, as the planet's sunlit and dark hemispheres swung alternately into the telescope's view. Based on the rise and fall of the planet's infrared light, or heat, Spitzer was able to measure the difference in temperature between the two sides of the planet -- about 1,400 degrees Celsius (2,550 degrees Fahrenheit). According to the astronomers, this means that the sunlit side of the planet is always as hot as fire, while the dark side is potentially as cold as ice.

The movie illustrates what the system might looks like to infrared eyes. It begins by showing an overhead view of the star Upsilon Andromedae and its planet Upsilon Andromedae b, the closest of three planets orbiting the star and the object of the Spitzer study. This planet whips around its star in 4.6 days.

The animation then shifts to show Spitzer's view of the system. The planet is shown with winds that circulate quickly around the surface, though astronomers believe the planet is "tidally locked." Our moon is similarly locked to Earth, always showing us the same face.

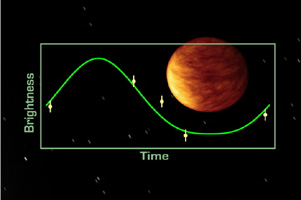
Spitzer measured the infrared light,coming from both the star and the planet at five points during the planet's orbit. The temperature levels went and up and down depending on which face of the planet, sunlit or dark, was in Spitzer's line of sight. The actual data collected by Spitzer are displayed over the animation (see Movie with Data). The difference between the peak and trough of the orange curve represents the difference in temperature across the surface of the planet.

These results indicate that, even if strong winds blow across this planet, its sun-baked atmosphere will cool off before reaching the planet's dark side.

Image Credit:
NASA/JPL-Caltech

Image Addition Date:
2006-10-12