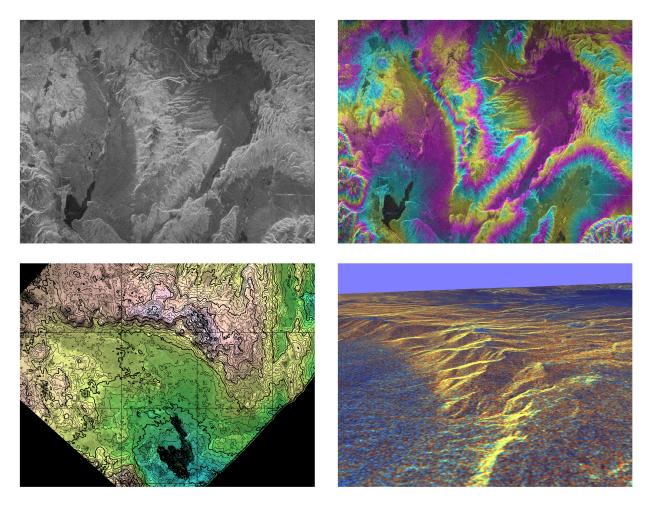
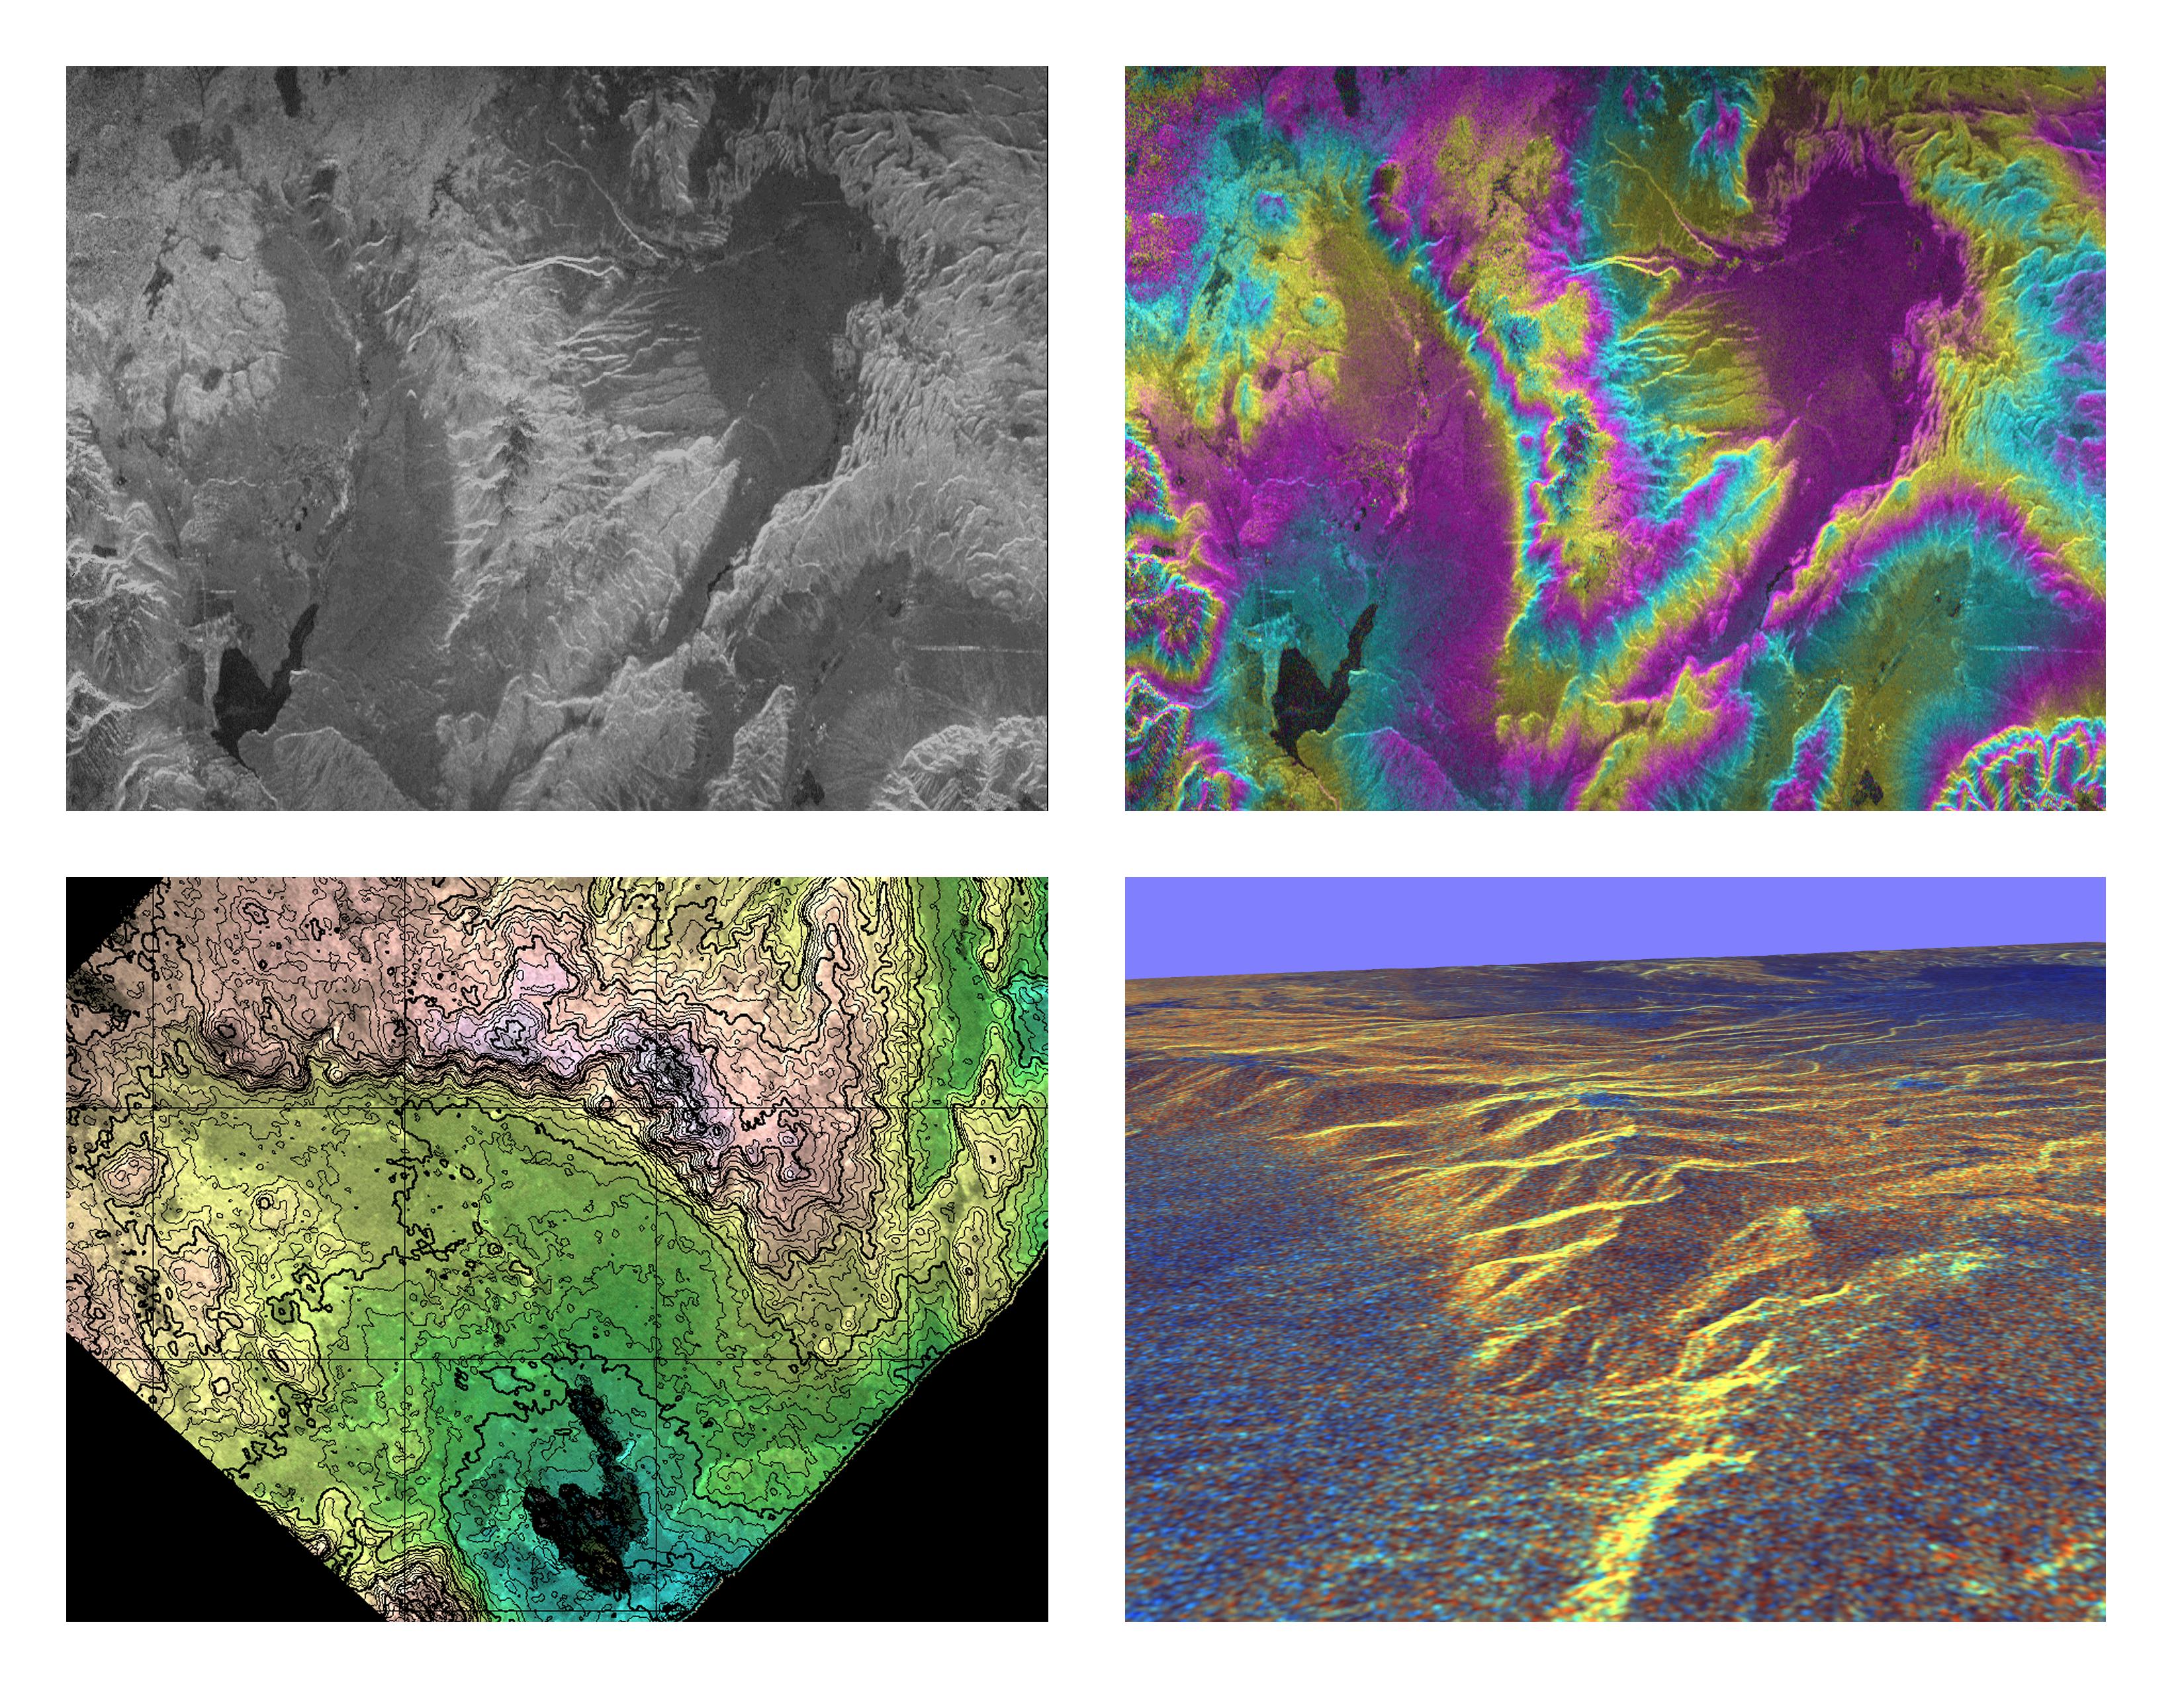
These four images of the Long Valley region of east-central California illustrate the steps required to produced three dimensional data and topographics maps from radar interferometry. All data displayed in these images were acquired by the Spaceborne Imaging Radar-C/X-band Synthetic Aperture Radar (SIR-C/X-SAR) aboard the space shuttle Endeavour during its two flights in April and October, 1994.
The image in the upper left shows L-band (horizontally transmitted and received) SIR-C radar image data for an area 34 by 59 kilometers (21 by 37 miles). North is toward the upper right; the radar illumination is from the top of the image. The bright areas are hilly regions that contain exposed bedrock and pine forest. The darker gray areas are the relatively smooth, sparsely vegetated valley floors. The dark irregular patch near the lower left is Lake Crowley. The curving ridge that runs across the center of the image from top to bottom is the northeast rim of the Long Valley Caldera, a remnant crater from a massive volcanic eruption that occurred about 750,000 years ago. The image in the upper right is an interferogram of the same area, made by combining SIR-C L-band data from the April and October flights. The colors in this image represent the difference in the phase of the radar echoes obtained on the two flights. Variations in the phase difference are caused by elevation differences. Formation of continuous bands of phase differences, known as interferometric "fringes," is only possible if the two observations were acquired from nearly the same position in space. For these April and October data takes, the shuttle tracks were less than 100 meters (328 feet) apart. The image in the lower left shows a topographic map derived from the interferometric data. The colors represent increments of elevation, as do the thin black contour lines, which are spaced at 50-meter (164-foot) elevation intervals. Heavy contour lines show 250-meter intervals (820-foot). Total relief in this area is about 1,320 meters (4,330 feet). Brightness variations come from the radar image, which has been geometrically corrected to remove radar distortions and rotated to have north toward the top.
The image in the lower right is a three-dimensional perspective view of the northeast rim of the Long Valley caldera, looking toward the northwest. SIR-C C-band radar image data are draped over topographic data derived from the interferometry processing. No vertical exaggeration has been applied. Combining topographic and radar image data allows scientists to examine relationships between geologic structures and landforms, and other properties of the land cover, such as soil type, vegetation distribution and hydrologic characteristics.
Spaceborne Imaging Radar-C and X-band Synthetic Aperture Radar (SIR-C/X-SAR) is part of NASA's Mission to Planet Earth. The radars illuminate Earth with microwaves, allowing detailed observations at any time, regardless of weather or sunlight conditions. SIR-C/X-SAR uses three microwave wavelengths: L-band (24 cm), C-band (6 cm) and X-band (3 cm). The multi-frequency data will be used by the international scientific community to better understand the global environment and how it is changing. The SIR-C/X-SAR data, complemented by aircraft and ground studies, will give scientists clearer insights into those environmental changes which are caused by nature and those changes which are induced by human activity.
SIR-C was developed by NASA's Jet Propulsion Laboratory. X-SAR was developed by the Dornier and Alenia Spazio companies for the German space agency, Deutsche Agentur fuer Raumfahrtangelegenheiten (DARA), and the Italian space agency, Agenzia Spaziale Italiana (ASI), with the Deutsche Forschungsanstalt fuer Luft und Raumfahrt e.v.(DLR), the major partner in science, operations and data processing of X-SAR.