PDS logoPlanetary Data System
PDS Information
Find a Node - Use these links to navigate to any of the 8 publicly accessible PDS Nodes.

This bar indicates that you are within the PDS enterprise which includes 6 science discipline nodes and 2 support nodes which are overseen by the Project Management Office at NASA's Goddard Space Flight Center (GSFC). Each node is led by an expert in the subject discipline, supported by an advisory group of other practitioners of that discipline, and subject to selection and approval under a regular NASA Research Announcement.
Click here to return to the Photojournal Home Page Click here to view a list of Photojournal Image Galleries Photojournal_inner_header
Latest Images  |  Spacecraft & Technology  |  Animations  |  Space Images App  |  Feedback  |  Photojournal Search  

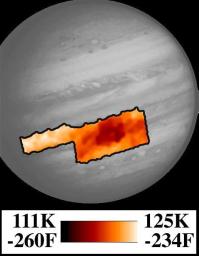
PIA01233: Photopolarimeter/Radiometer (PPR) Temperature Map of Great Red Spot
 Target Name:  Jupiter
 Is a satellite of:  Sol (our sun)
 Mission:  Galileo
 Spacecraft:  Galileo Orbiter
 Instrument:  Photopolarimeter-Radiometer 
 Product Size:  468 x 604 pixels (w x h)
 Produced By:  JPL
 Producer ID:  P49779 MRPS87789
 Addition Date:  1998-04-02
 Primary Data Set:  Galileo EDRs
 Full-Res TIFF:  PIA01233.tif (340.9 kB)
 Full-Res JPEG:  PIA01233.jpg (32.65 kB)

Click on the image above to download a moderately sized image in JPEG format (possibly reduced in size from original)

Original Caption Released with Image:

This map shows temperatures for the region around Jupiter's Great Red Spot and an area to the northwest. The center of the Great Red Spot appears colder than the surrounding areas, and actually is colder than any other place in Jupiter's atmosphere. The center of the spot is a region where winds bring gases up from underneath. The ammonia in the rising air condenses as it comes up and so forms tall thick clouds, much the same way as rising air in the Earth's atmosphere over moist areas forms high water clouds. It is a little warmer to the immediate east and west of the spot, where the uprising winds are weaker. To the south is a warm area where winds are generally descending and clearer of clouds. The northwestern area in this map shows atmosphere that is much warmer and drier, and the gases there are descending, so it is much clearer of clouds. This map corresponds to a level in Jupiter's atmosphere where the pressure is only 1/4 of the Earth's at sea level (250 millibars), the same as it is near 1200 meters (40,000 feet) above sea level in the Earth. This map was made from data taken by the Photopolarimeter/Radiometer (PPR) instrument on June 26, 1996.

JPL manages the Galileo mission for NASA's Office of Space Science, Washington, D.C.

This image and other images and data received from Galileo are posted on the World Wide Web, on the Galileo mission home page at URL http://galileo.jpl.nasa.gov.

Image Credit:
NASA/JPL

Image Addition Date:
1998-04-02