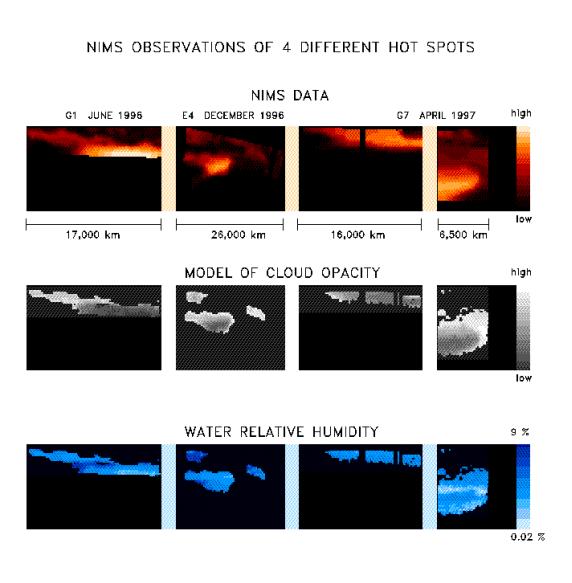
With the NIMS instrument high quality observations are being obtained from all parts of Jupiter. The images in the upper panel are taken at a wavelength of 4.8 microns. At this wavelength thermal radiation from about 100 km deep below the visible cloud deck is escaping, allowing us to study the deep atmospheric region.
The overlying cloud deck absorbs a part of the radiation, but there are places where it is thin and more radiation can escape. These are called hot spot regions. Many hotspots regions occur in a zone between the equator and 15 degrees north latitude, the North Equatorial Belt (NEB), but thermal radiation is seen from much of the planet.
The uniqueness of NIMS is that it is capable of observing the same spatial region at a maximum of 408 different wavelengths between 0.7 and 5.2 micron simultaneously. Every picture element (pixel) contains a spectrum of up to 408 wavelengths. The gases that compose the atmosphere leave there traces in the spectra. In this particular case, 48 wavelengths were available between 4.6 and 5.2 micron, and we see spectral signatures of water, ammonia, and phosphine. Also, the total amount of radiation is determined by the amount of overlying cloud, characterized by the cloud opacity. By means of model calculations, we can determine the amount of water and the cloud opacity for each individual spectrum. The amount ammonia and phosphine is more difficult to obtain because its influence on the spectra is weaker.
The results of these calculations are shown in the form of maps in the next two panels. With NIMS, we can now have a detailed look at the spatial distribution of the water and ammonia amounts and the cloud opacity in the atmosphere. Not all the pixels from the observations have good spectra, so for some data points no reliable determination of the water and cloud opacity could be made.
We find that the atmosphere is extremely dry in, and close to, the hot spot, with relative humidities between 0.02 % and 10 %, with the dryest places being inside the hot spot. This corroborates the in-situ Galileo Entry Probe measurements. The Probe entered the atmosphere, on December 5 1995, in a hot spot region. Whereas the Probe obtained only a very localized snapshot, with NIMS we can do observations of larger areas and over longer periods. The spatial distribution of water is more complex than expected. More detailed investigations will be necessary to fully understand these results.
Future studies will also allow a better understanding of the dynamics of the Jovian atmosphere, since the spatial distribution of water is thought to be a tracer for atmospheric motions under the cloud deck.
NIMS will continue to provide excellent and unique data during the Galileo Europa Mission, planned to last until December 1999.
The Jet Propulsion Laboratory, Pasadena, CA manages the mission for NASA's Office of Space Science, Washington, DC.
This image and other images and data received from Galileo are posted on the World Wide Web, on the Galileo mission home page at URL http://galileo.jpl.nasa.gov.