|
Your search criteria found 30 images Target is Earth (and available satellites) |
| My List |
Addition Date
|
Target | Mission | Instrument | Size |

|
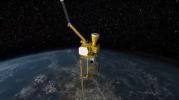
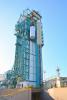
2011-07-12 | Earth |
SMAP |
500x280x3 | |
|
|||||
|
|
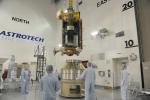
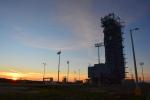
2015-01-20 | Earth |
SMAP |
3000x1996x3 | |
|
|||||
|
|
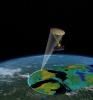
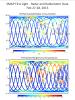
2015-01-21 | Earth |
SMAP |
8192x8784x3 | |
|
|||||
|
|
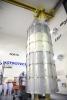
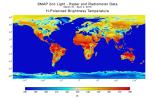
2015-01-21 | Earth |
SMAP |
2002x3000x3 | |
|
|||||
|
|
2015-01-21 | Earth |
SMAP |
2815x1850x3 | |

|
|||||
|
|
2015-01-21 | Earth |
SMAP |
2000x3000x3 | |
|
|||||
|
|
2015-01-21 | Earth |
SMAP |
3000x2000x3 | |
|
|||||
|
|
2015-03-09 | Earth |
SMAP |
884x1180x3 | |
|
|||||
|
|
2015-04-21 | Earth |
SMAP |
1669x1080x3 | |
|
|||||
|
|
2015-04-21 | Earth |
SMAP |
1187x882x3 | |
|
|||||
|
|
2015-04-29 | Earth |
SMAP |
931x602x3 | |
|
|||||
|
|
2015-05-06 | Earth |
SMAP |
2999x3006x3 | |
|
|||||
|
|
2015-05-19 | Earth |
SMAP |
13492x6783x3 | |
|
|||||
|
|
2015-05-19 | Earth |
SMAP |
9105x11395x3 | |
|
|||||
|
|
2015-09-02 | Earth |
SMAP |
7592x3775x3 | |
|
|||||
|
|
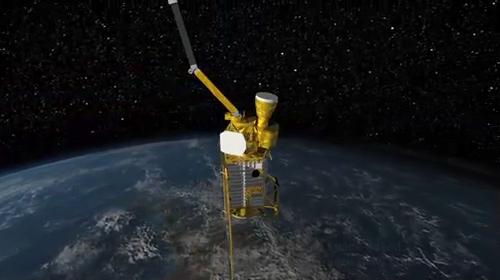
2015-09-09 | Earth |
SMAP |
Passive Active L-band System |
1248x1830x3 |
|
|||||
|
|
2015-09-12 | Earth |
Aqua Aquarius SMAP |
1299x1078x3 | |
|
|||||
|
|
2015-10-08 | Earth |
SMAP |
1093x1153x3 | |
|
|||||
|
|
2016-10-07 | Earth |
SMAP |
1527x1175x3 | |

|
|||||
|
|
2017-08-28 | Earth |
SMAP |
3000x1240x3 | |
|
|||||
|
|
2017-08-29 | Earth |
SMAP |
3040x1626x3 | |
|
|||||
|
|
2017-08-30 | Earth |
SMAP |
11811x3410x3 | |
|
|||||
|
|
2017-09-05 | Earth |
SMAP |
1830x1976x3 | |
|
|||||
|
|
2017-09-13 | Earth |
SMAP |
5882x1662x3 | |
|
|||||
|
|
2017-09-19 | Earth |
SMAP |
1808x895x3 | |
|
|||||
|
|
2018-09-13 | Earth |
SMAP |
792x612x3 | |
|
|||||
|
|
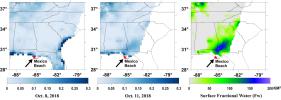
2018-10-09 | Earth |
SMAP |
792x612x3 | |
|
|||||
|
|
2018-10-10 | Earth |
SMAP |
792x612x3 | |

|
|||||
|
|
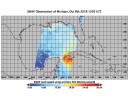
2018-10-11 | Earth |
SMAP |
2991x1065x3 | |
|
|||||
|
|
2019-05-17 | Earth |
SMAP |
1400x787x3 | |
|
|||||
| Currently displaying images: 1 - 30 of 30 |