Click on an image for detailed information
Click on a column heading to sort in ascending or descending order

My
List |
Addition Date
|
Target
|
Mission
|
Instrument
|
Size
|

|
2016-10-07 |
Earth
|
SMAP
|
|
1527x1175x3 |

|
-
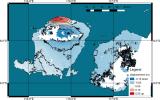
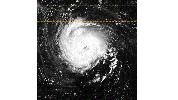
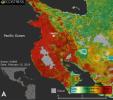
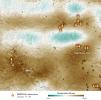
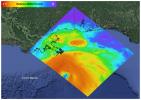
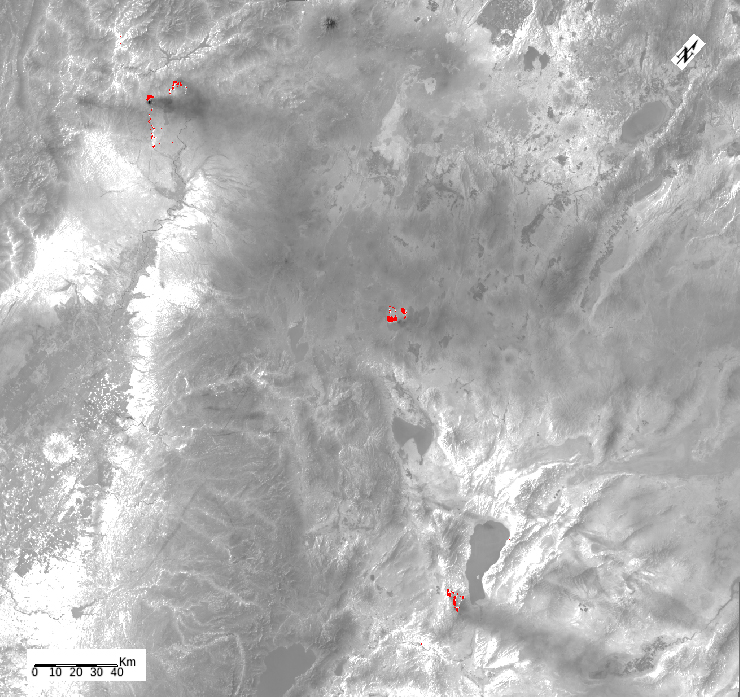
PIA21096:
-
SMAP Takes a New Measure of Hurricane Matthew's Winds
Full Resolution:
TIFF
(1.8 MB)
JPEG
(167.8 kB)
|
|
|
2016-10-27 |
Moon
|
GRAIL
|
|
2707x2832x3 |

|
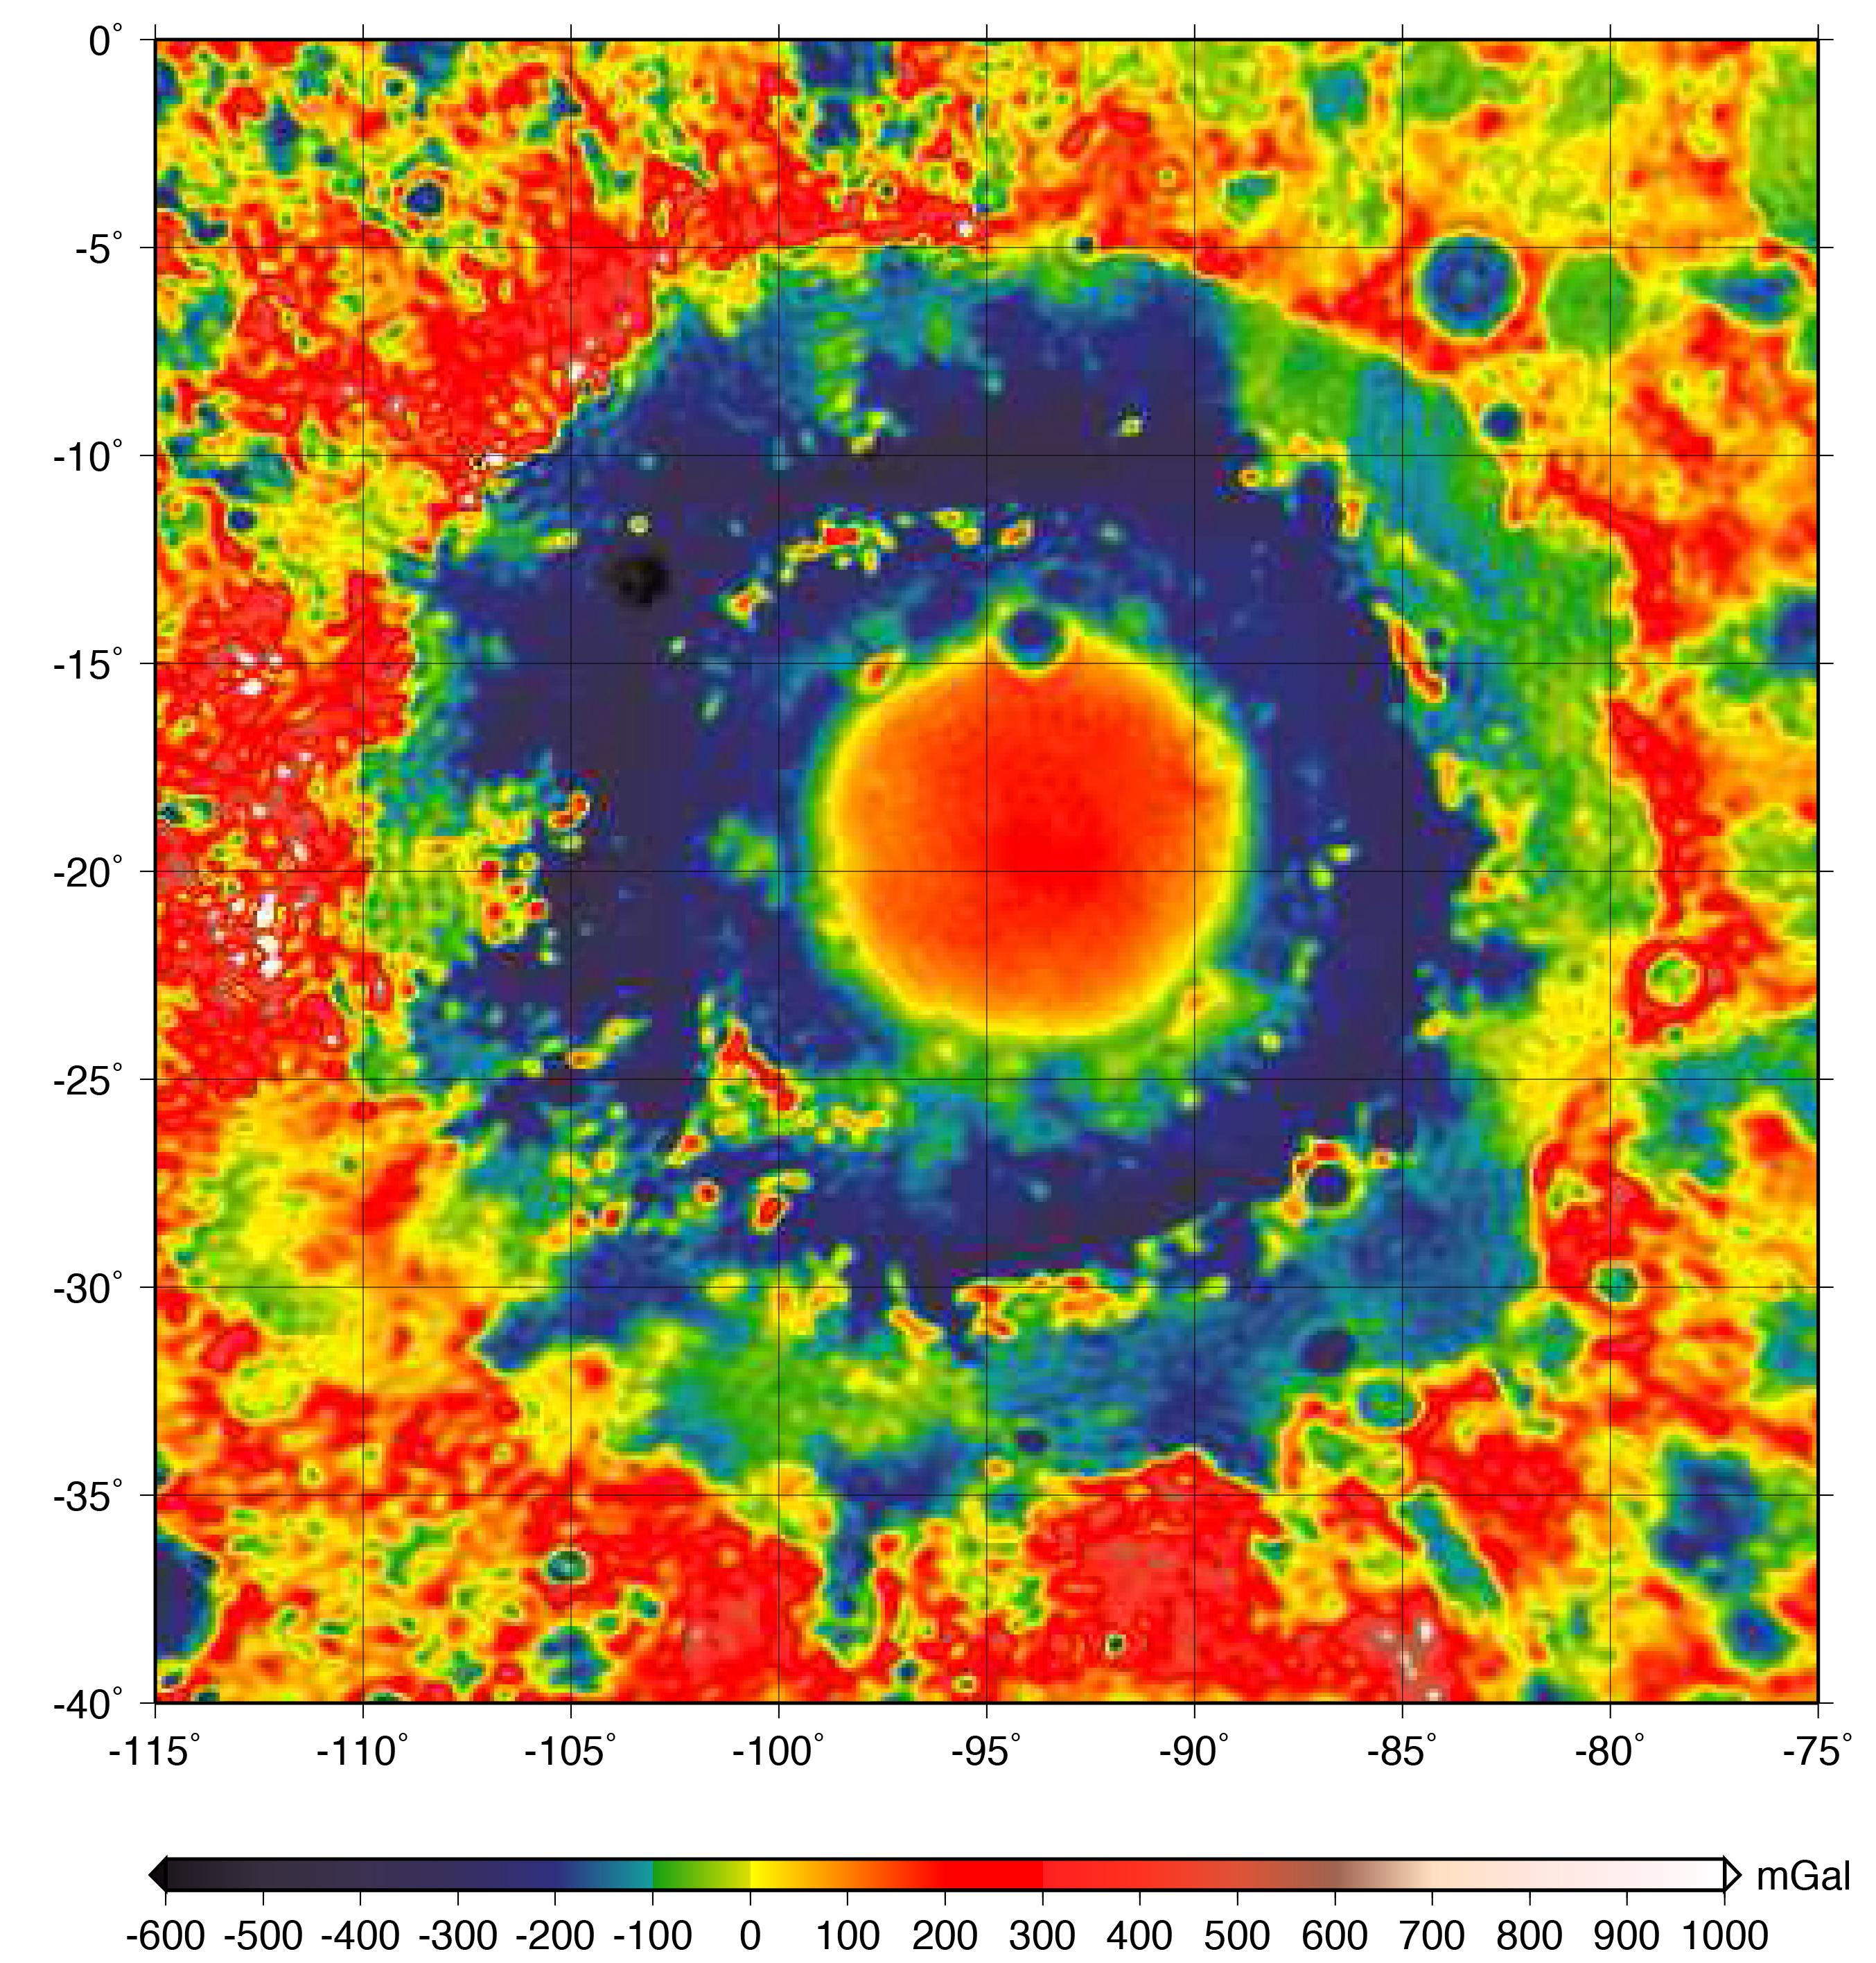
-
PIA21050:
-
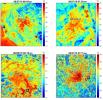
GRAIL Gravity Map of Orientale Basin
Full Resolution:
TIFF
(17.62 MB)
JPEG
(990.3 kB)
|
|
|
2016-11-16 |
Earth
|
ARIA
|
|
1119x1289x3 |

|
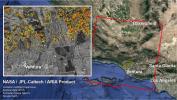
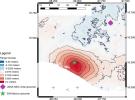
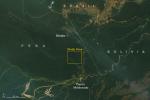
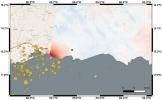
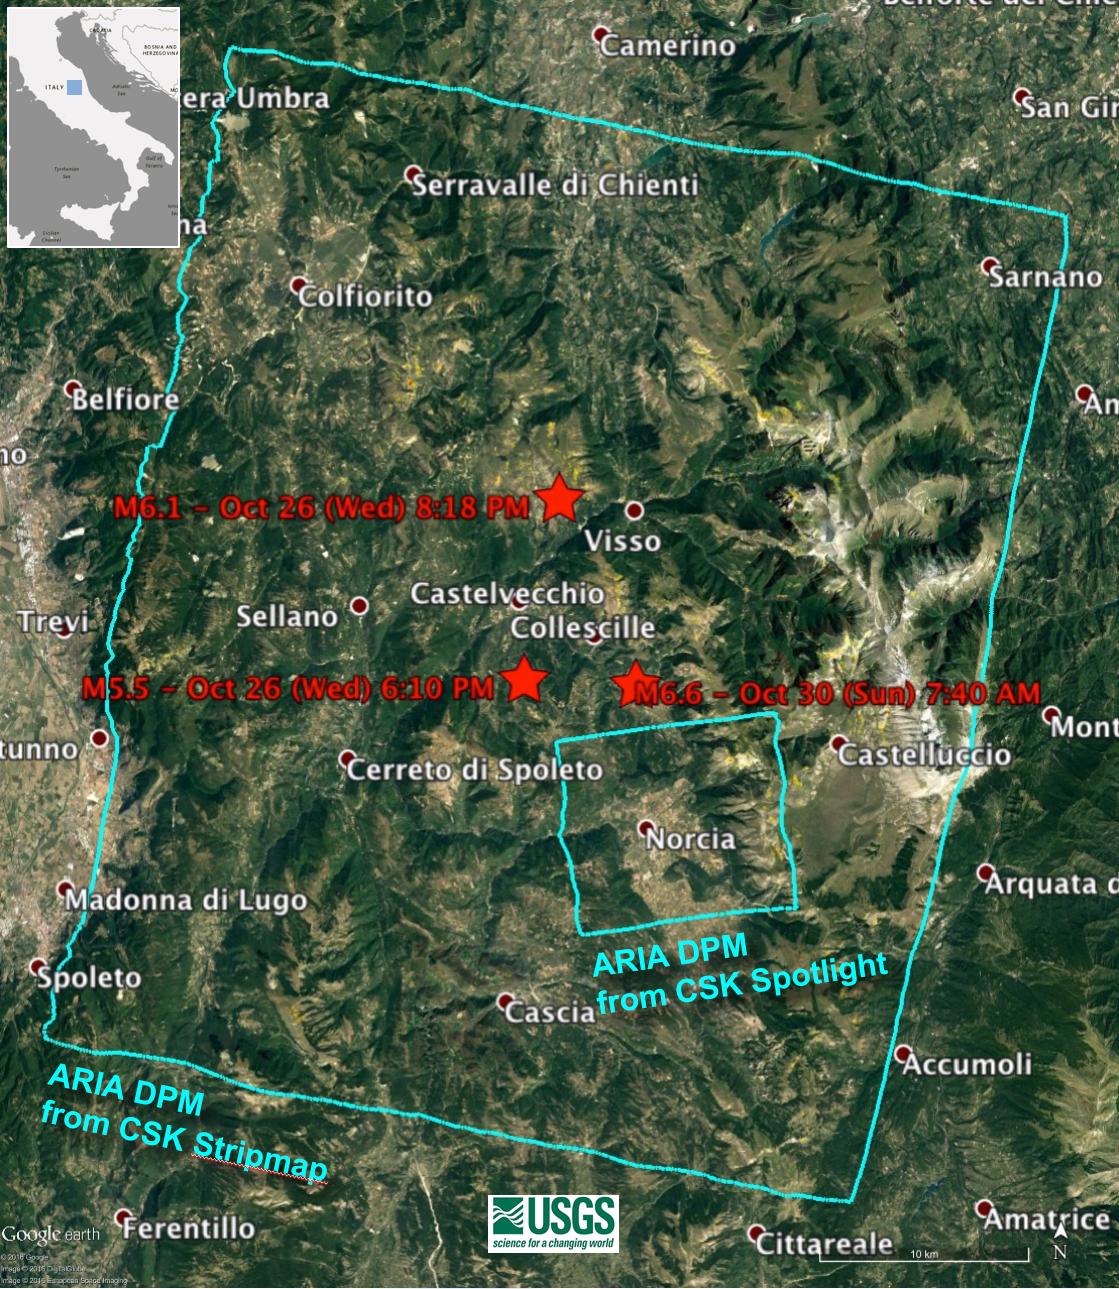
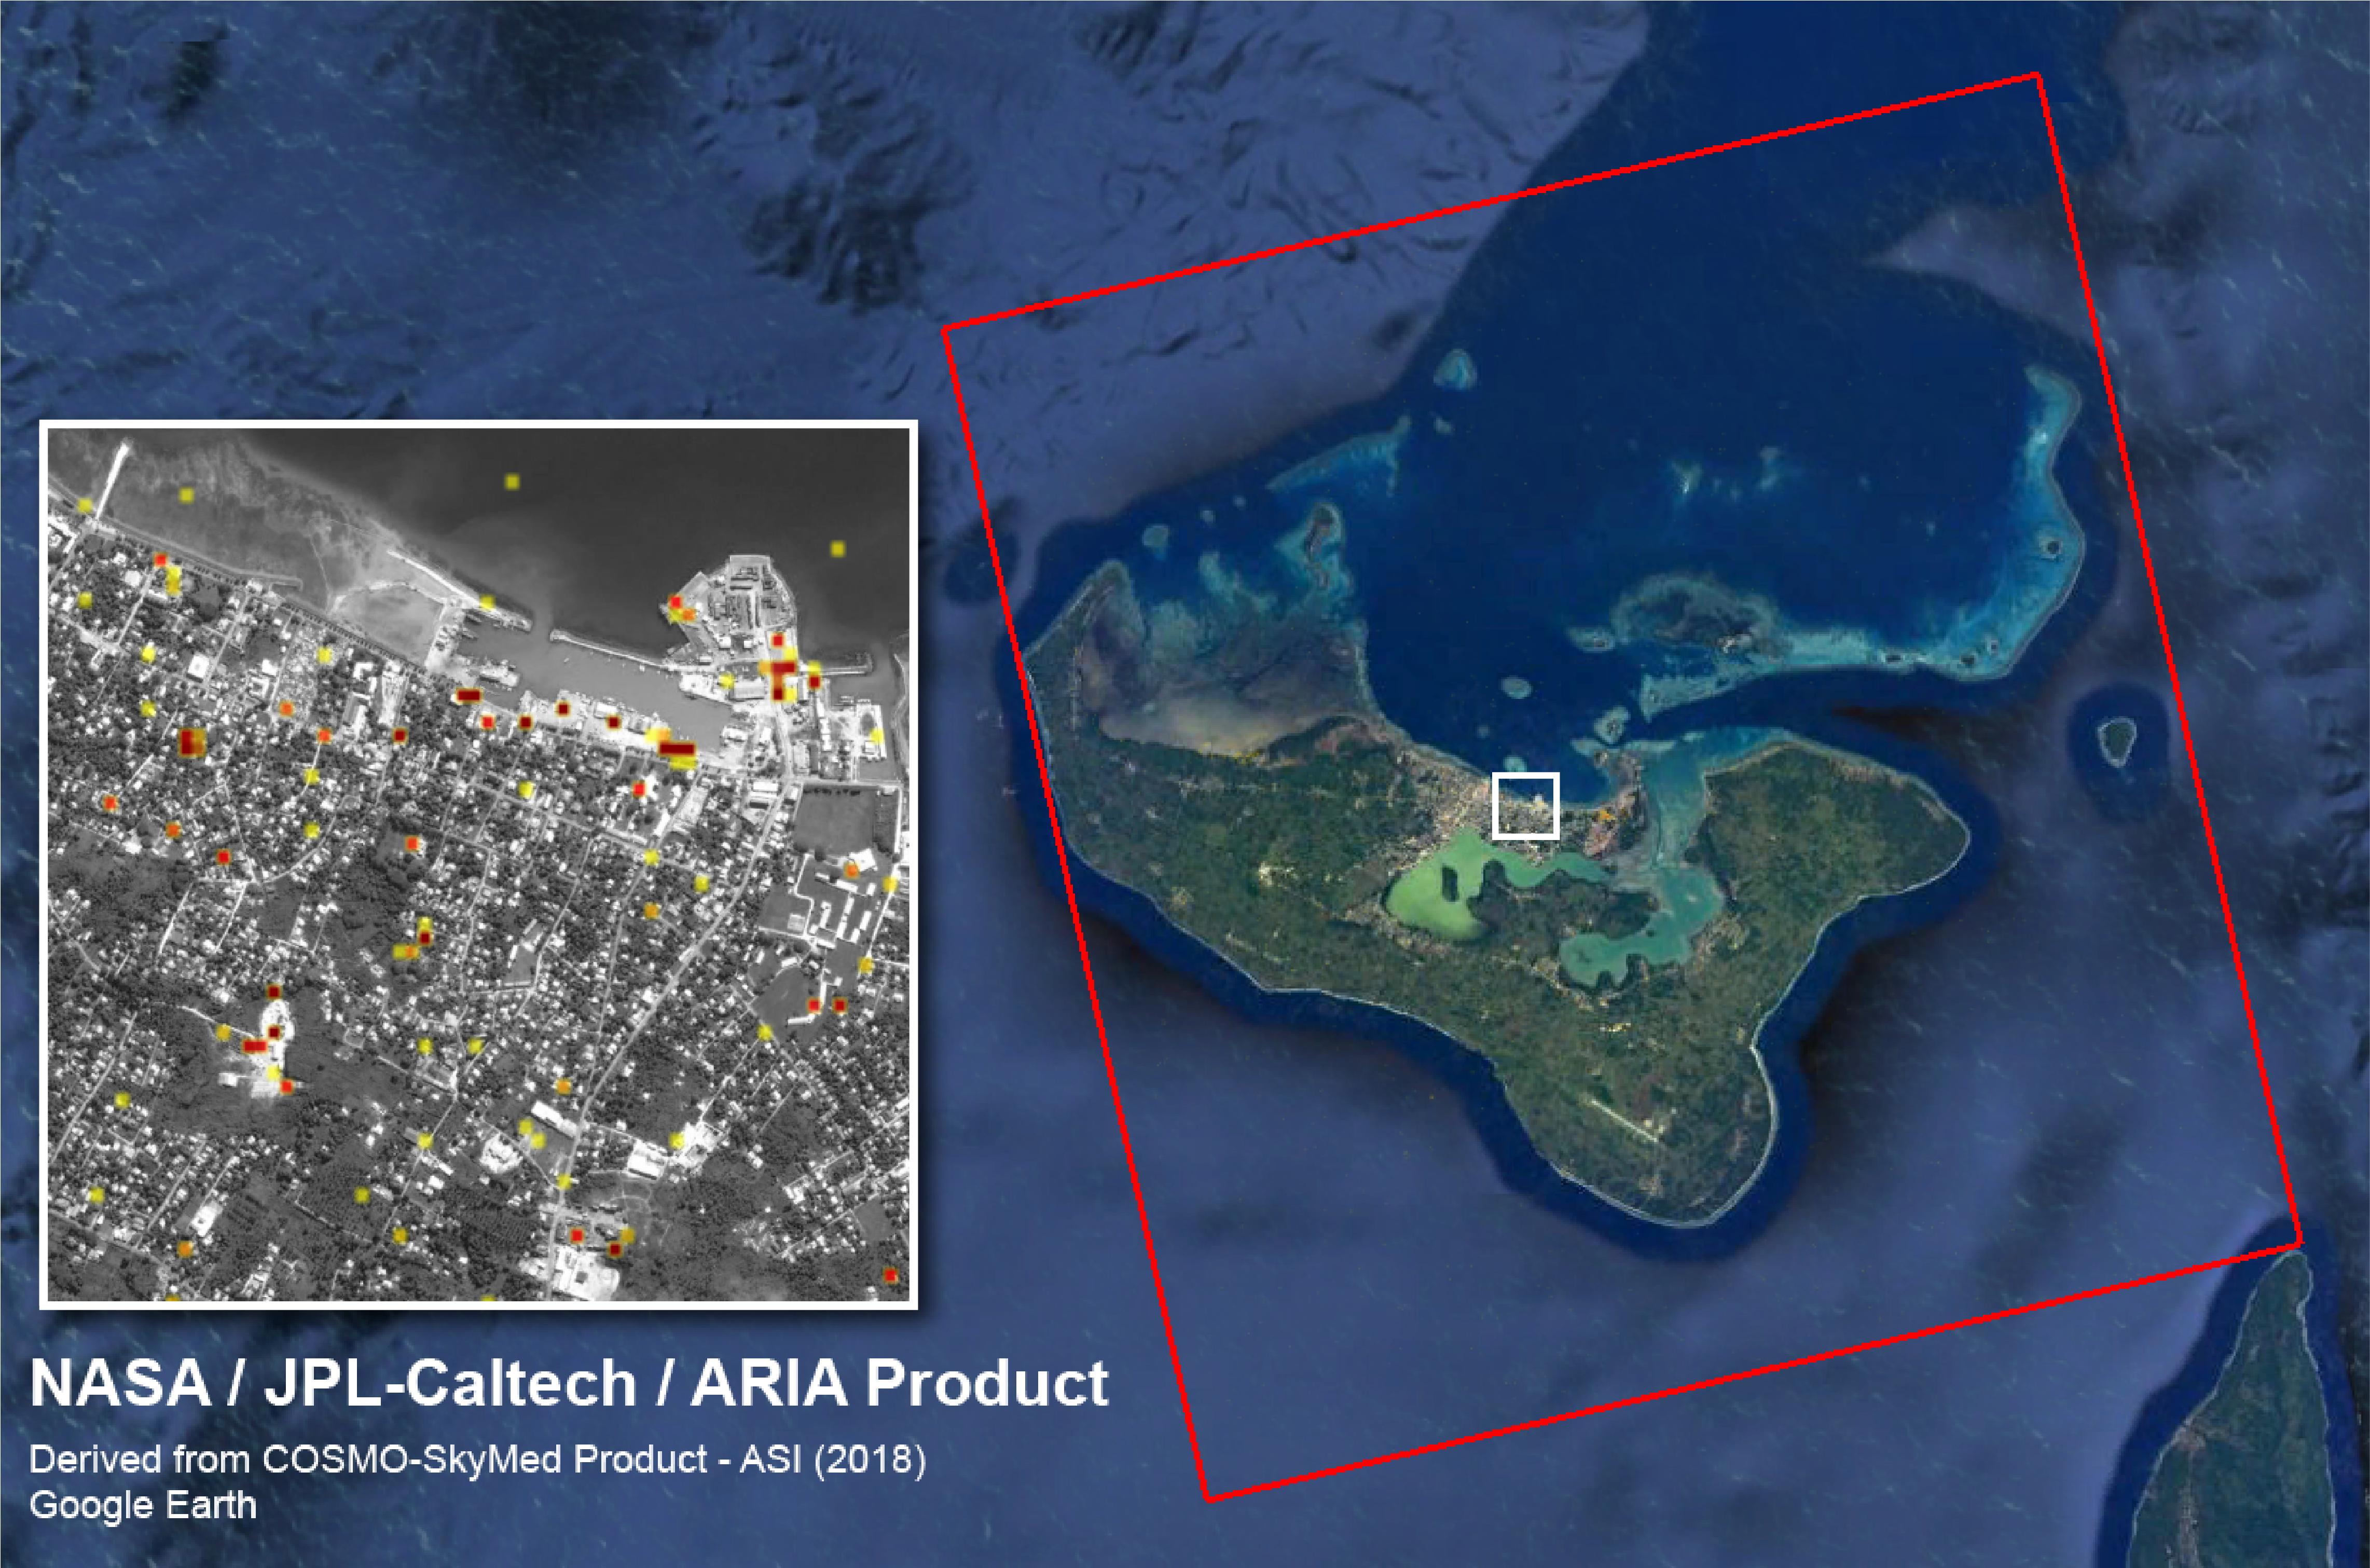
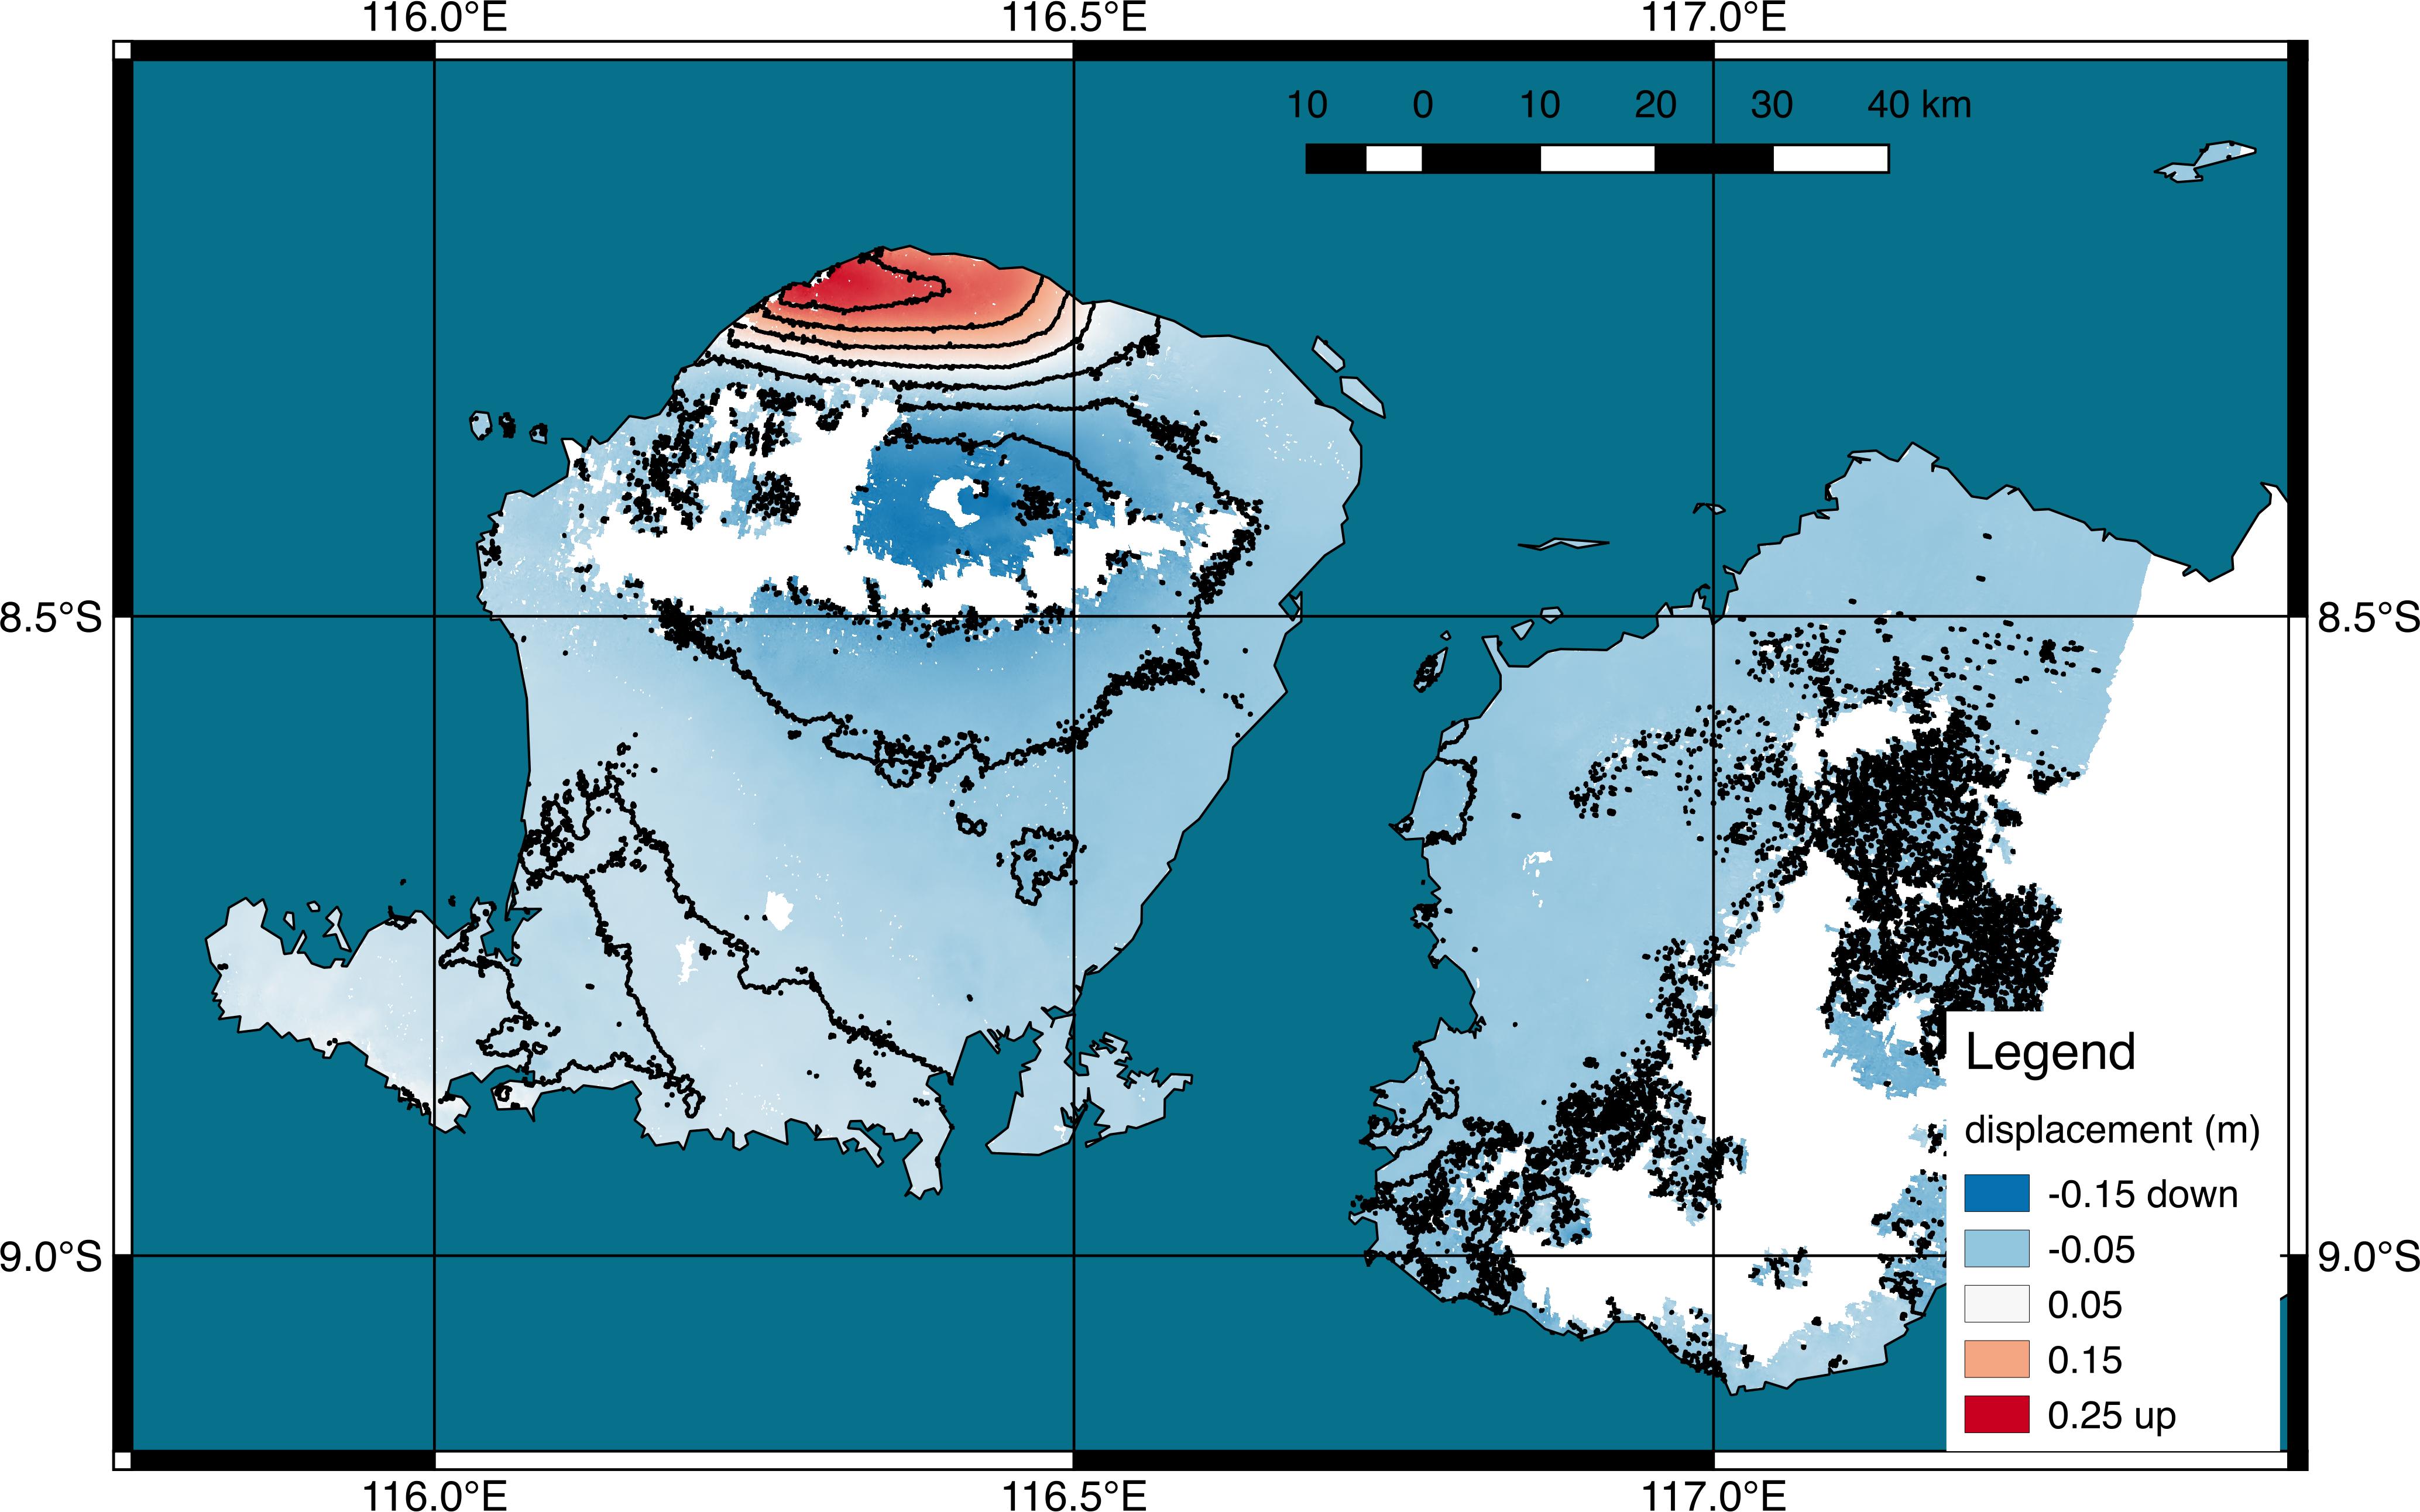
-
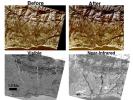
PIA15374:
-
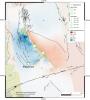
NASA�s Damage Proxy Map to Assist with Italy Earthquake Disaster Response
Full Resolution:
TIFF
(4.329 MB)
JPEG
(322.2 kB)
|
|
|
2017-01-25 |
Earth
|
Mars Reconnaissance Orbiter (MRO)
|
|
4608x3456x3 |

|
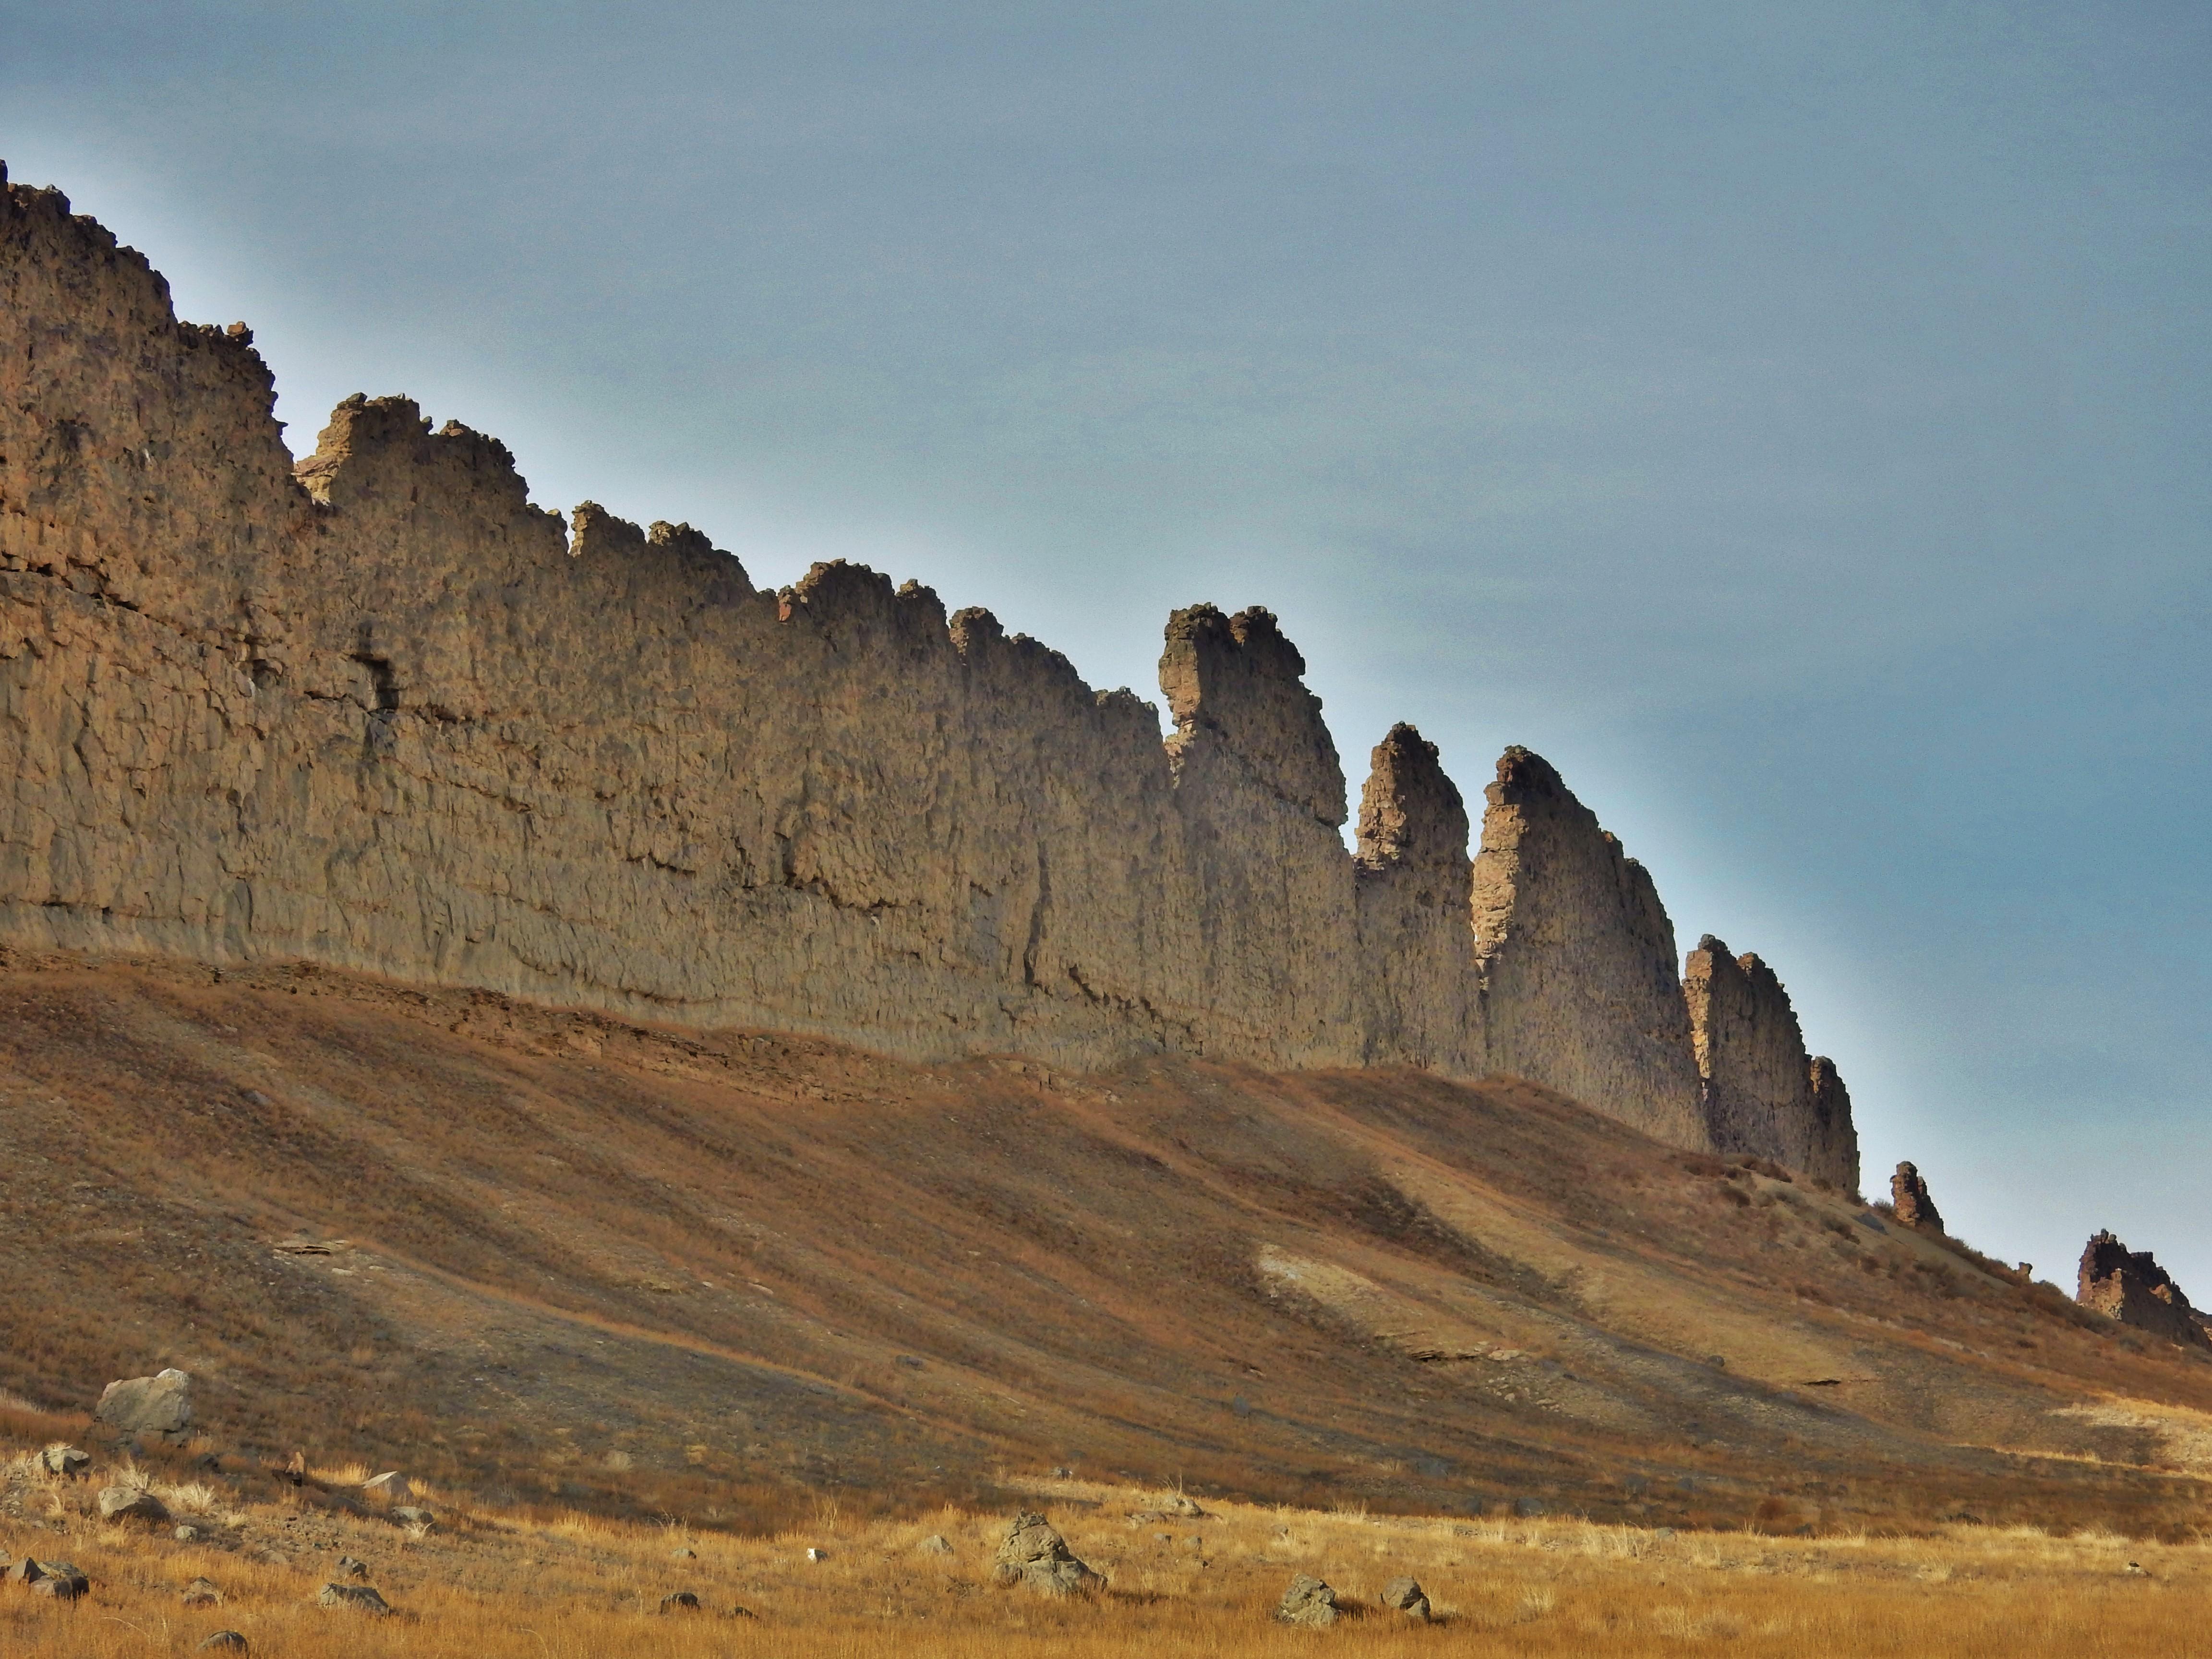
-
PIA21266:
-
'Wing' Dike of Hardened Lava in New Mexico
Full Resolution:
TIFF
(39.07 MB)
JPEG
(1.569 MB)
|
|
|
2017-08-28 |
Earth
|
SMAP
|
|
3000x1240x3 |
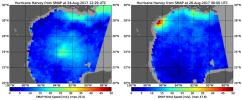
|
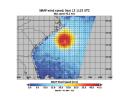
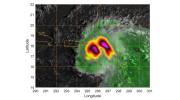
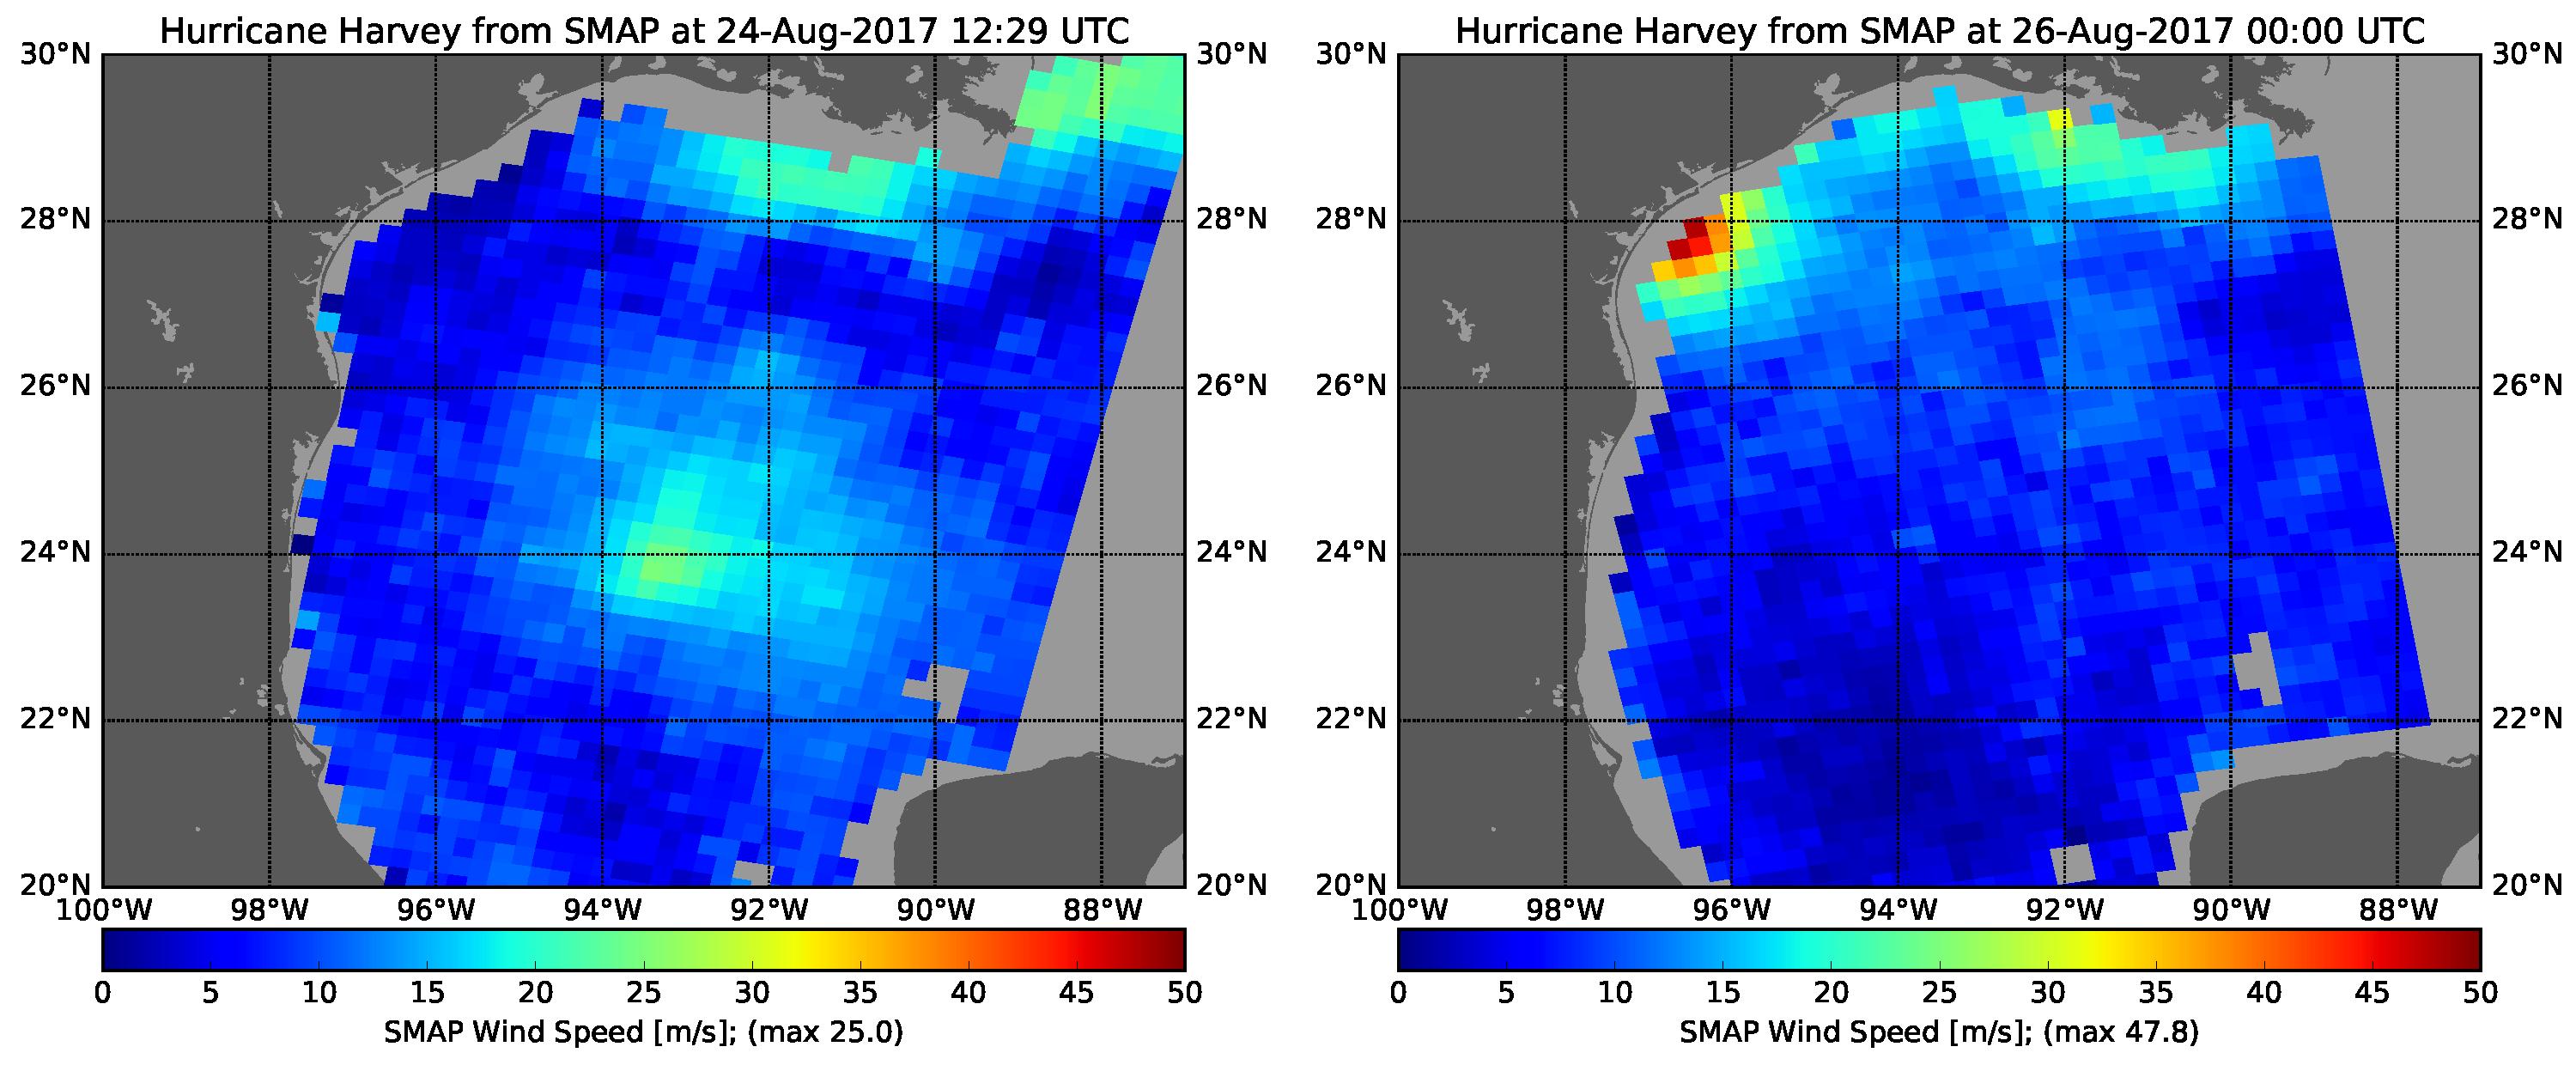
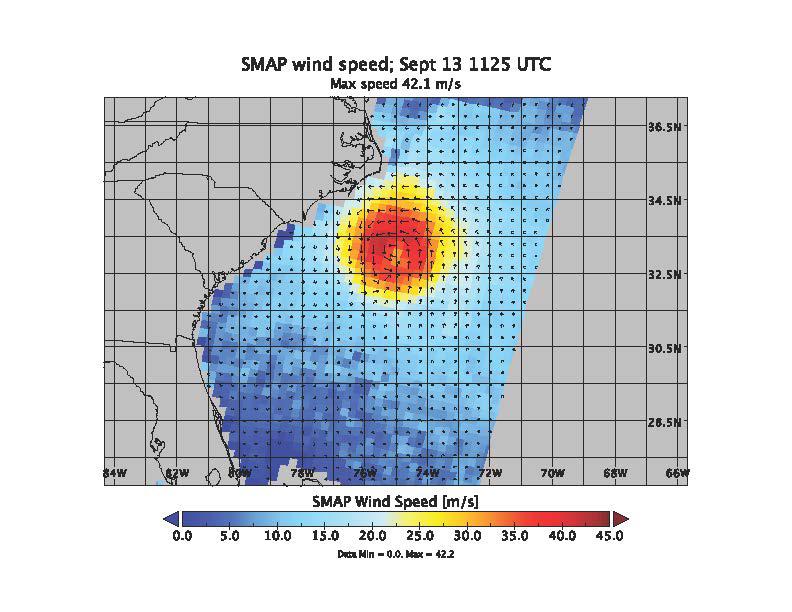
-
PIA21884:
-
Hurricane Harvey's Rapid Wind Intensification seen by NASA's SMAP
Full Resolution:
TIFF
(1.562 MB)
JPEG
(412.3 kB)
|
|
|
2017-08-29 |
Earth
|
SMAP
|
|
3040x1626x3 |
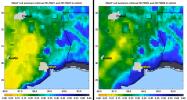
|
-
PIA21926:
-
NASA SMAP Images Show Texas Soil Moisture Conditions Before/After Hurricane Harvey's Landfall
Full Resolution:
TIFF
(3.095 MB)
JPEG
(407.2 kB)
|
|
|
2017-08-30 |
Earth
|
SMAP
|
|
11811x3410x3 |
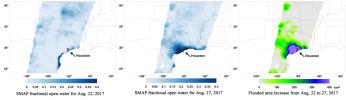
|
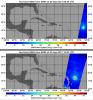
-
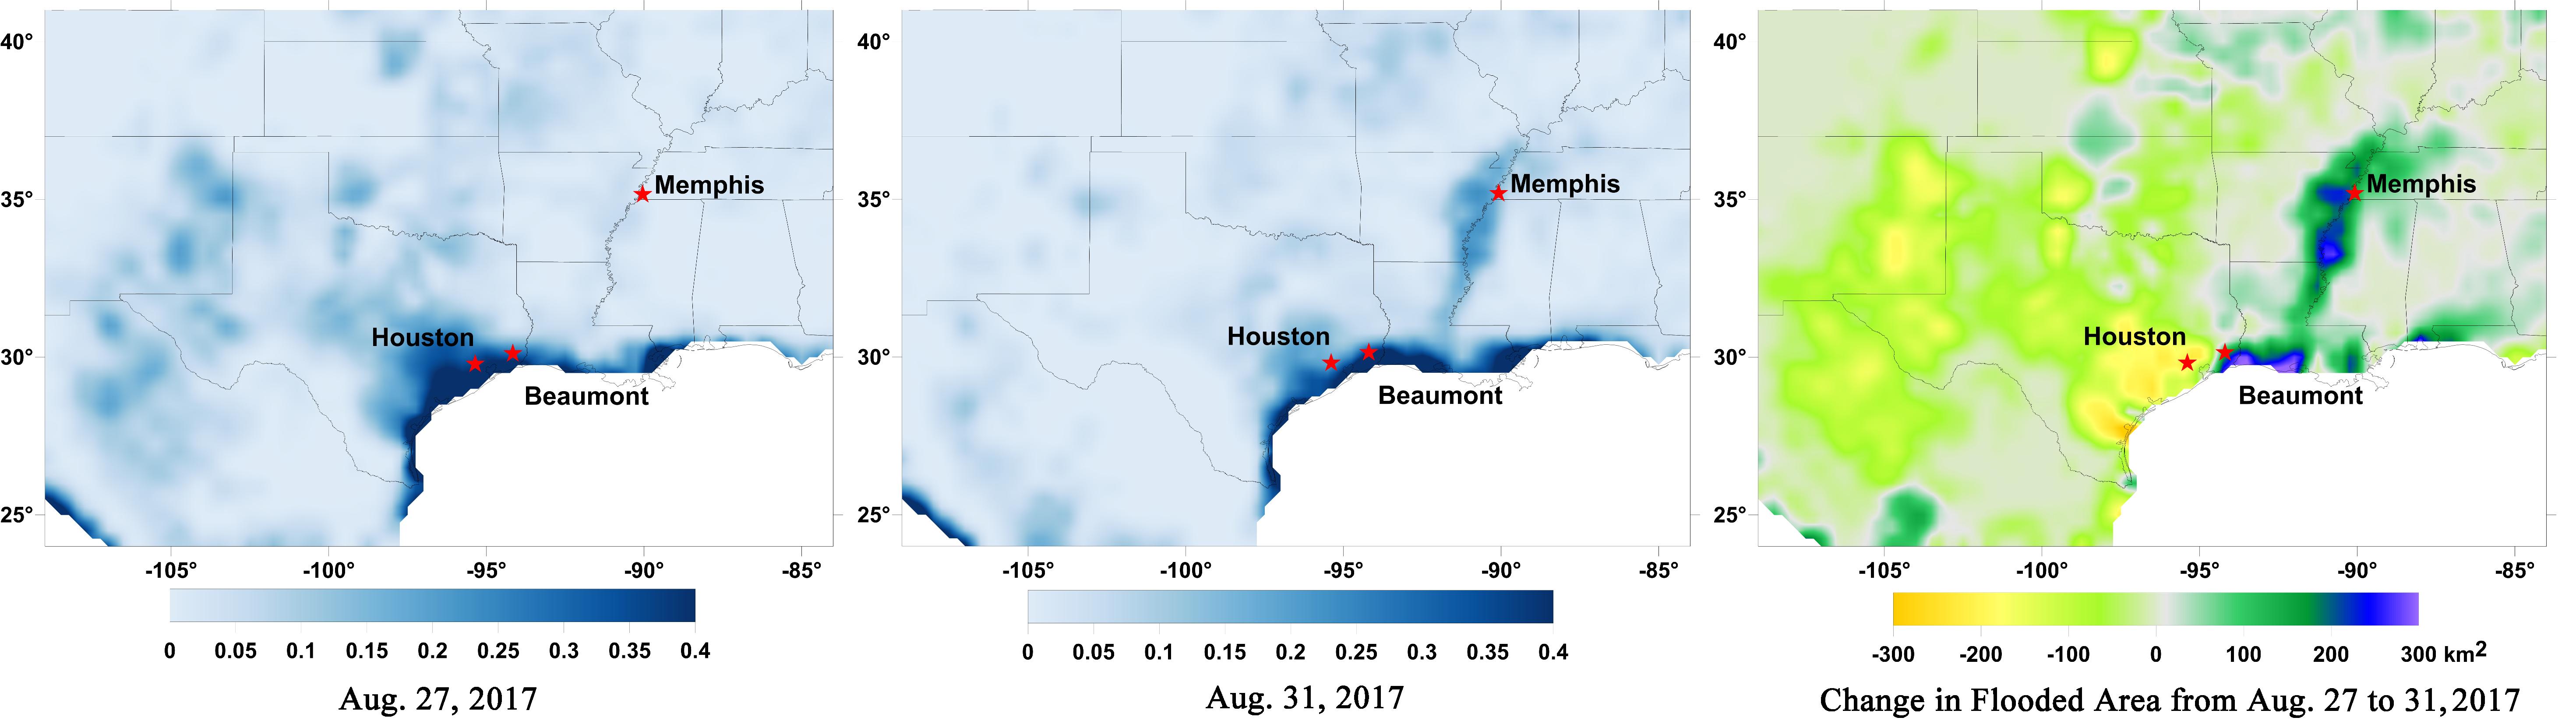
PIA21930:
-
Surface Flooding from Hurricane Harvey Shown in New SMAP Imagery
Full Resolution:
TIFF
(13.21 MB)
JPEG
(1.489 MB)
|
|
|
2017-08-31 |
Earth
|
ARIA
|
|
824x1173x3 |
|
-
PIA21931:
-
Updated NASA Satellite Flood Map of Southeastern Texas (ALOS-2 Data)
Full Resolution:
TIFF
(2.819 MB)
JPEG
(194.7 kB)
|
|
|
2017-08-31 |
Earth
|
ARIA
|
|
811x1174x3 |
|
-
PIA21932:
-
New NASA Satellite Flood Map of Southeastern Texas (Sentinel-1 Data)
Full Resolution:
TIFF
(2.858 MB)
JPEG
(210.2 kB)
|
|
|
2017-09-05 |
Earth
|
SMAP
|
|
1830x1976x3 |
|
-
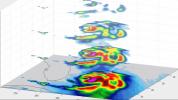
PIA21939:
-
Rapid Intensification of Hurricane Irma Seen in New SMAP Wind Images
Full Resolution:
TIFF
(2.313 MB)
JPEG
(401.8 kB)
|
|
|
2017-09-13 |
Earth
|
SMAP
|
|
5882x1662x3 |
|
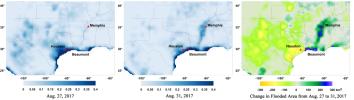
-
PIA21951:
New NASA Maps Show Flooding Changes In Aftermath of Hurricane Harvey
Full Resolution:
TIFF
(9.019 MB)
JPEG
(552 kB)
|
|
|
2017-09-19 |
Earth
|
ARIA
|
|
3174x2707x3 |
|
-
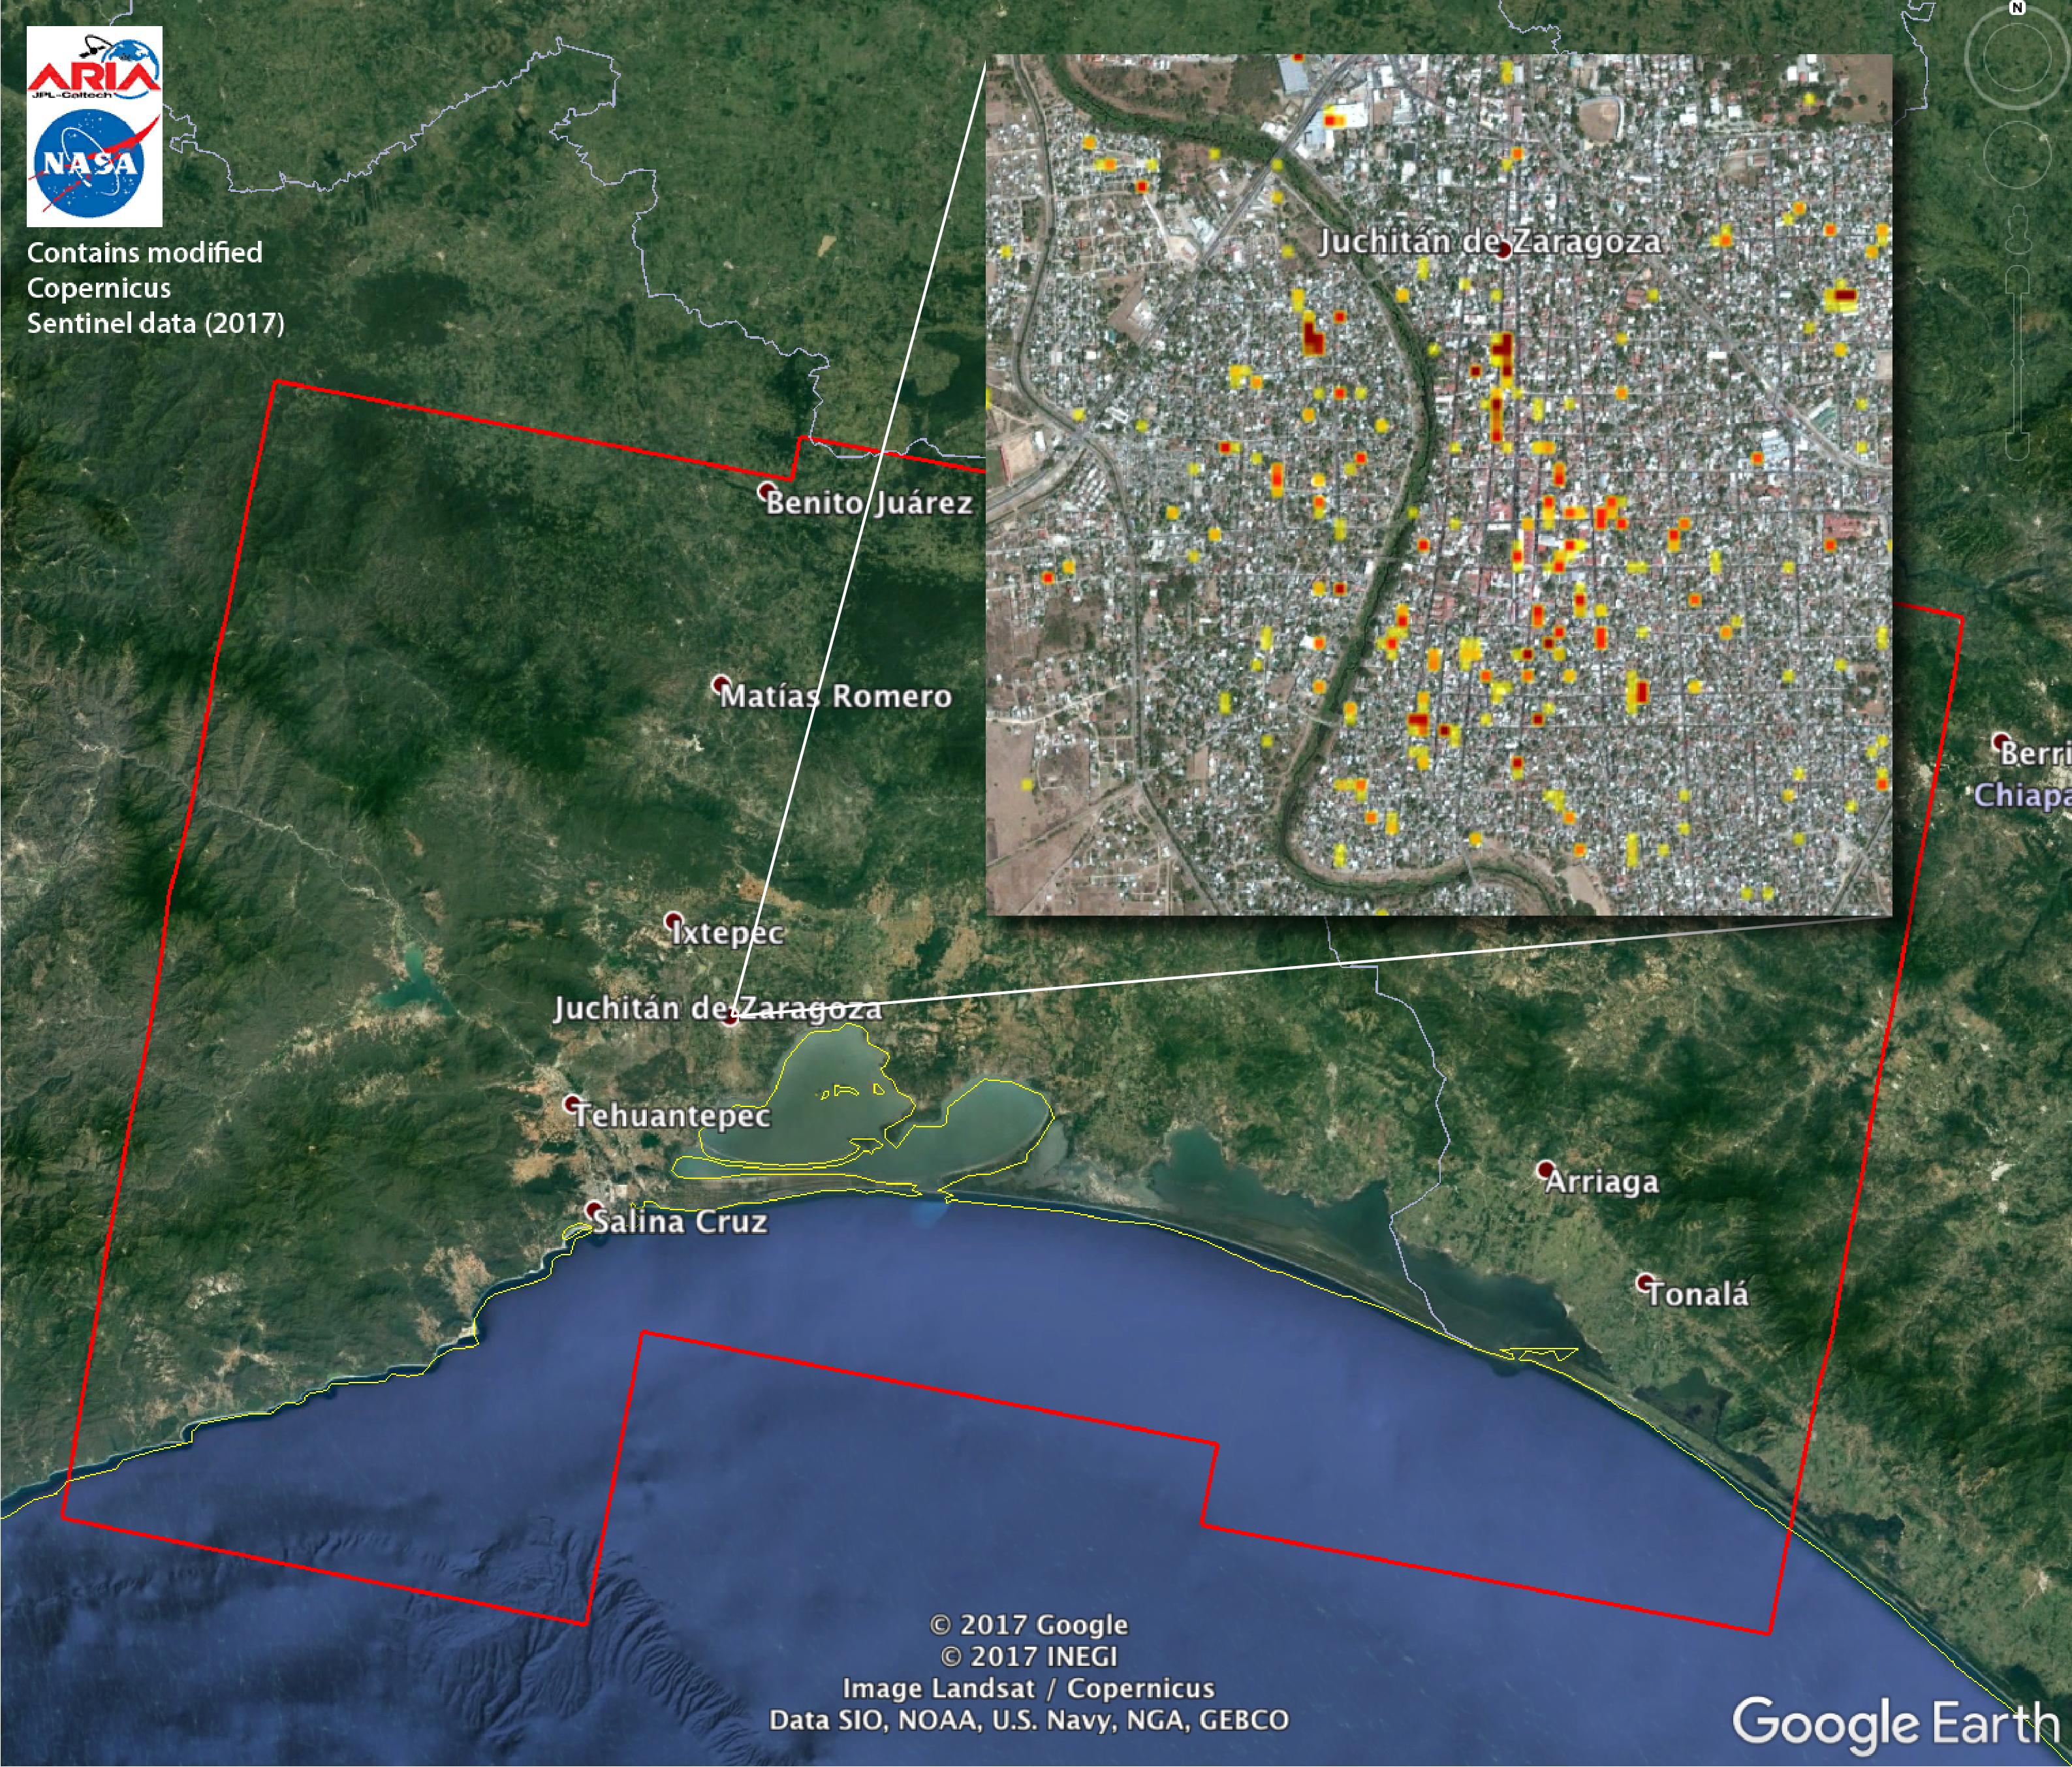
PIA21956:
-
Satellite Radar Detects Damage from Sept. 2017 Chiapas, Mexico Quake
Full Resolution:
TIFF
(22.41 MB)
JPEG
(1.302 MB)
|
|
|
2017-09-19 |
Earth
|
SMAP
|
|
1808x895x3 |
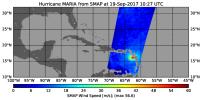
|
-
PIA21960:
-
Hurricane Maria's Strengthening Winds Seen in NASA SMAP Image
Full Resolution:
TIFF
(454.2 kB)
JPEG
(200.2 kB)
|
|
|
2017-09-20 |
Earth
|
ARIA
|
|
1860x1896x3 |
|
-
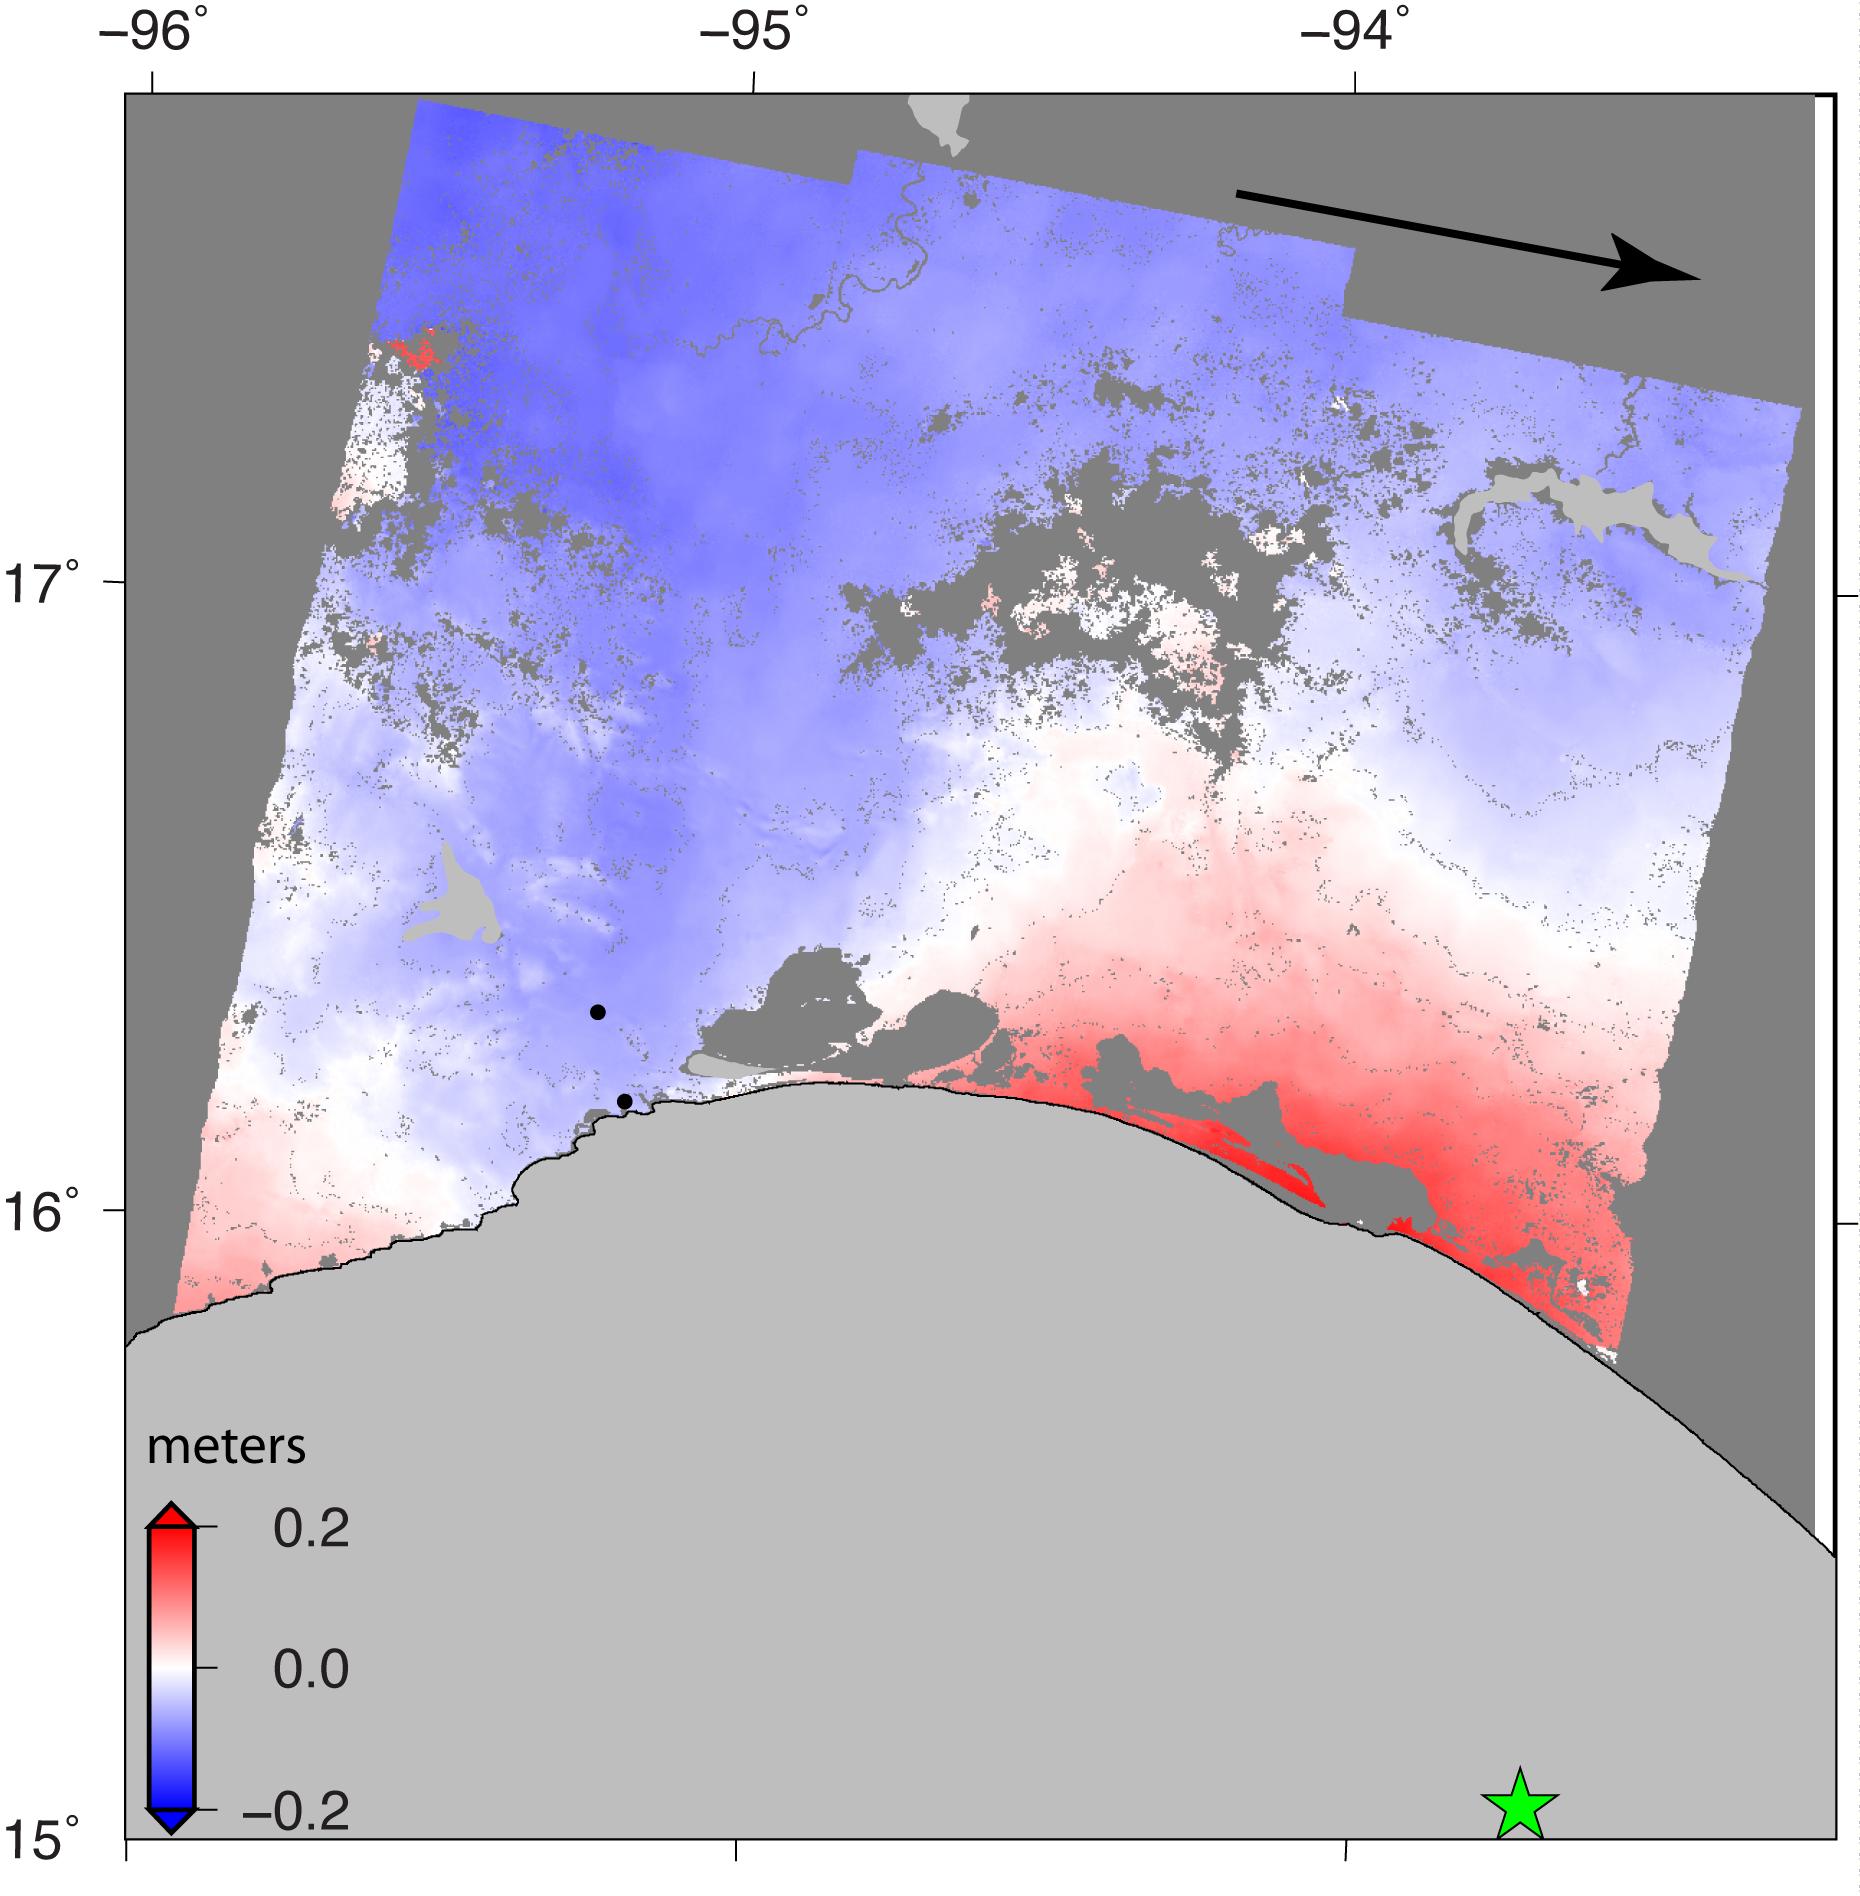
PIA21962:
-
Sentinel-1 Radar Shows Ground Motion From Sept. 2017 Oaxaca-Chiapas, Mexico Quake
Full Resolution:
TIFF
(2.292 MB)
JPEG
(259.6 kB)
|
|
|
2017-09-20 |
Earth
|
ARIA
|
|
2512x2290x3 |
|
-
PIA21963:
-
Satellite Radar Detects Damage from Sept. 19, 2017 Raboso, Mexico, Quake
Full Resolution:
TIFF
(16.67 MB)
JPEG
(1.194 MB)
|
|
|
2017-09-26 |
Earth
|
ARIA
|
|
1600x900x3 |

|
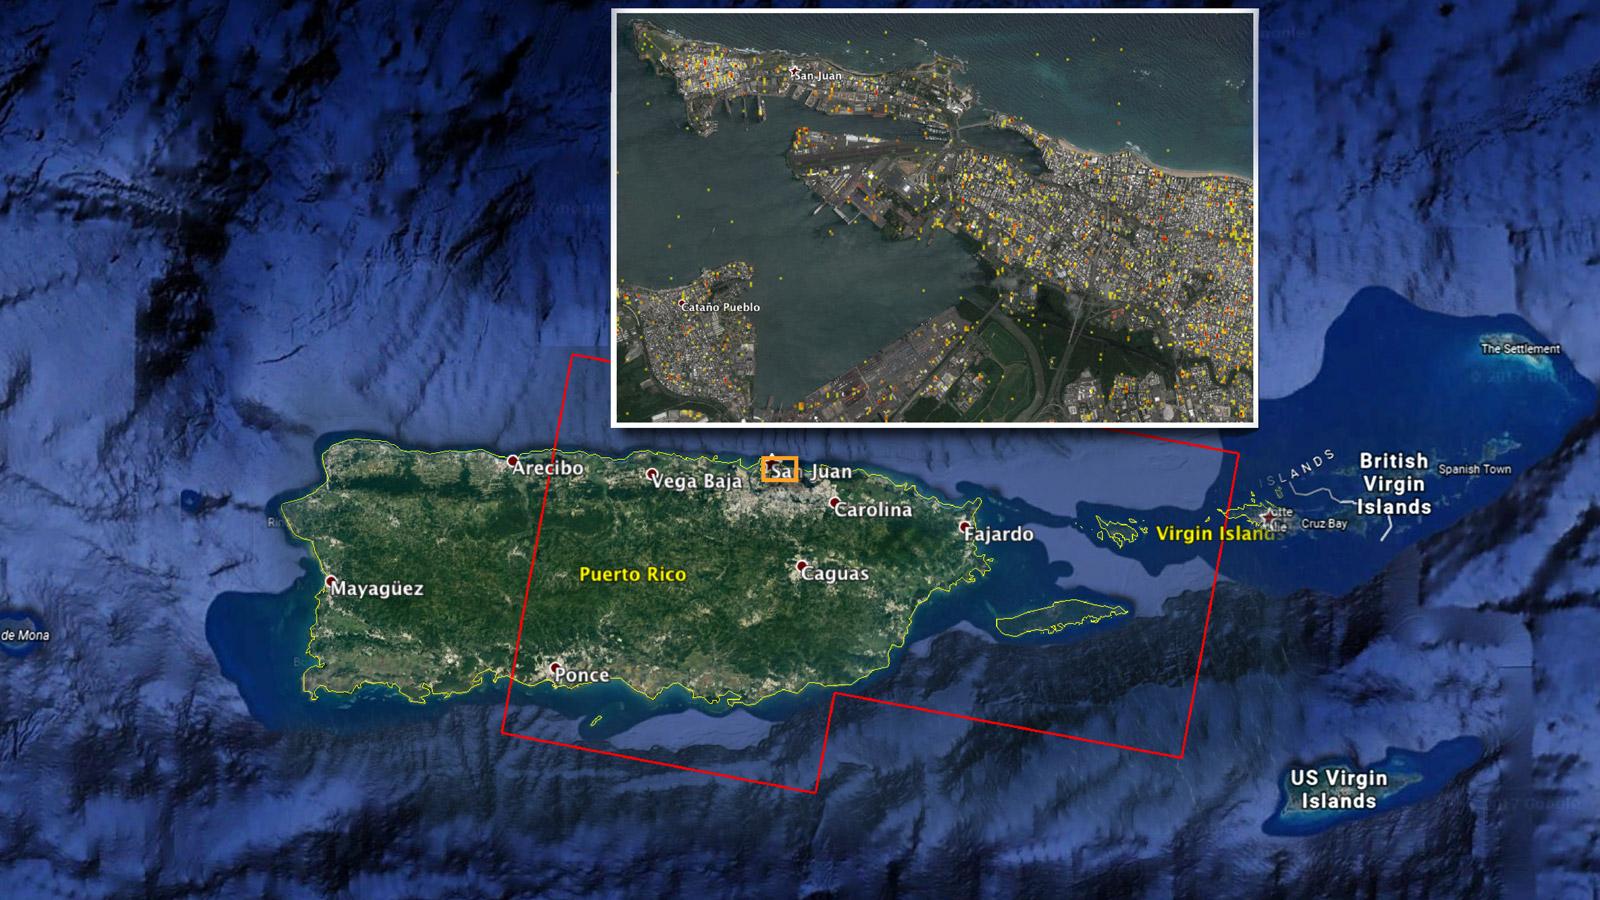
-
PIA21964:
-
NASA Damage Map Aids FEMA's Hurricane Maria Rescue Operation in Puerto Rico
Full Resolution:
TIFF
(4.322 MB)
JPEG
(223.4 kB)
|
|
|
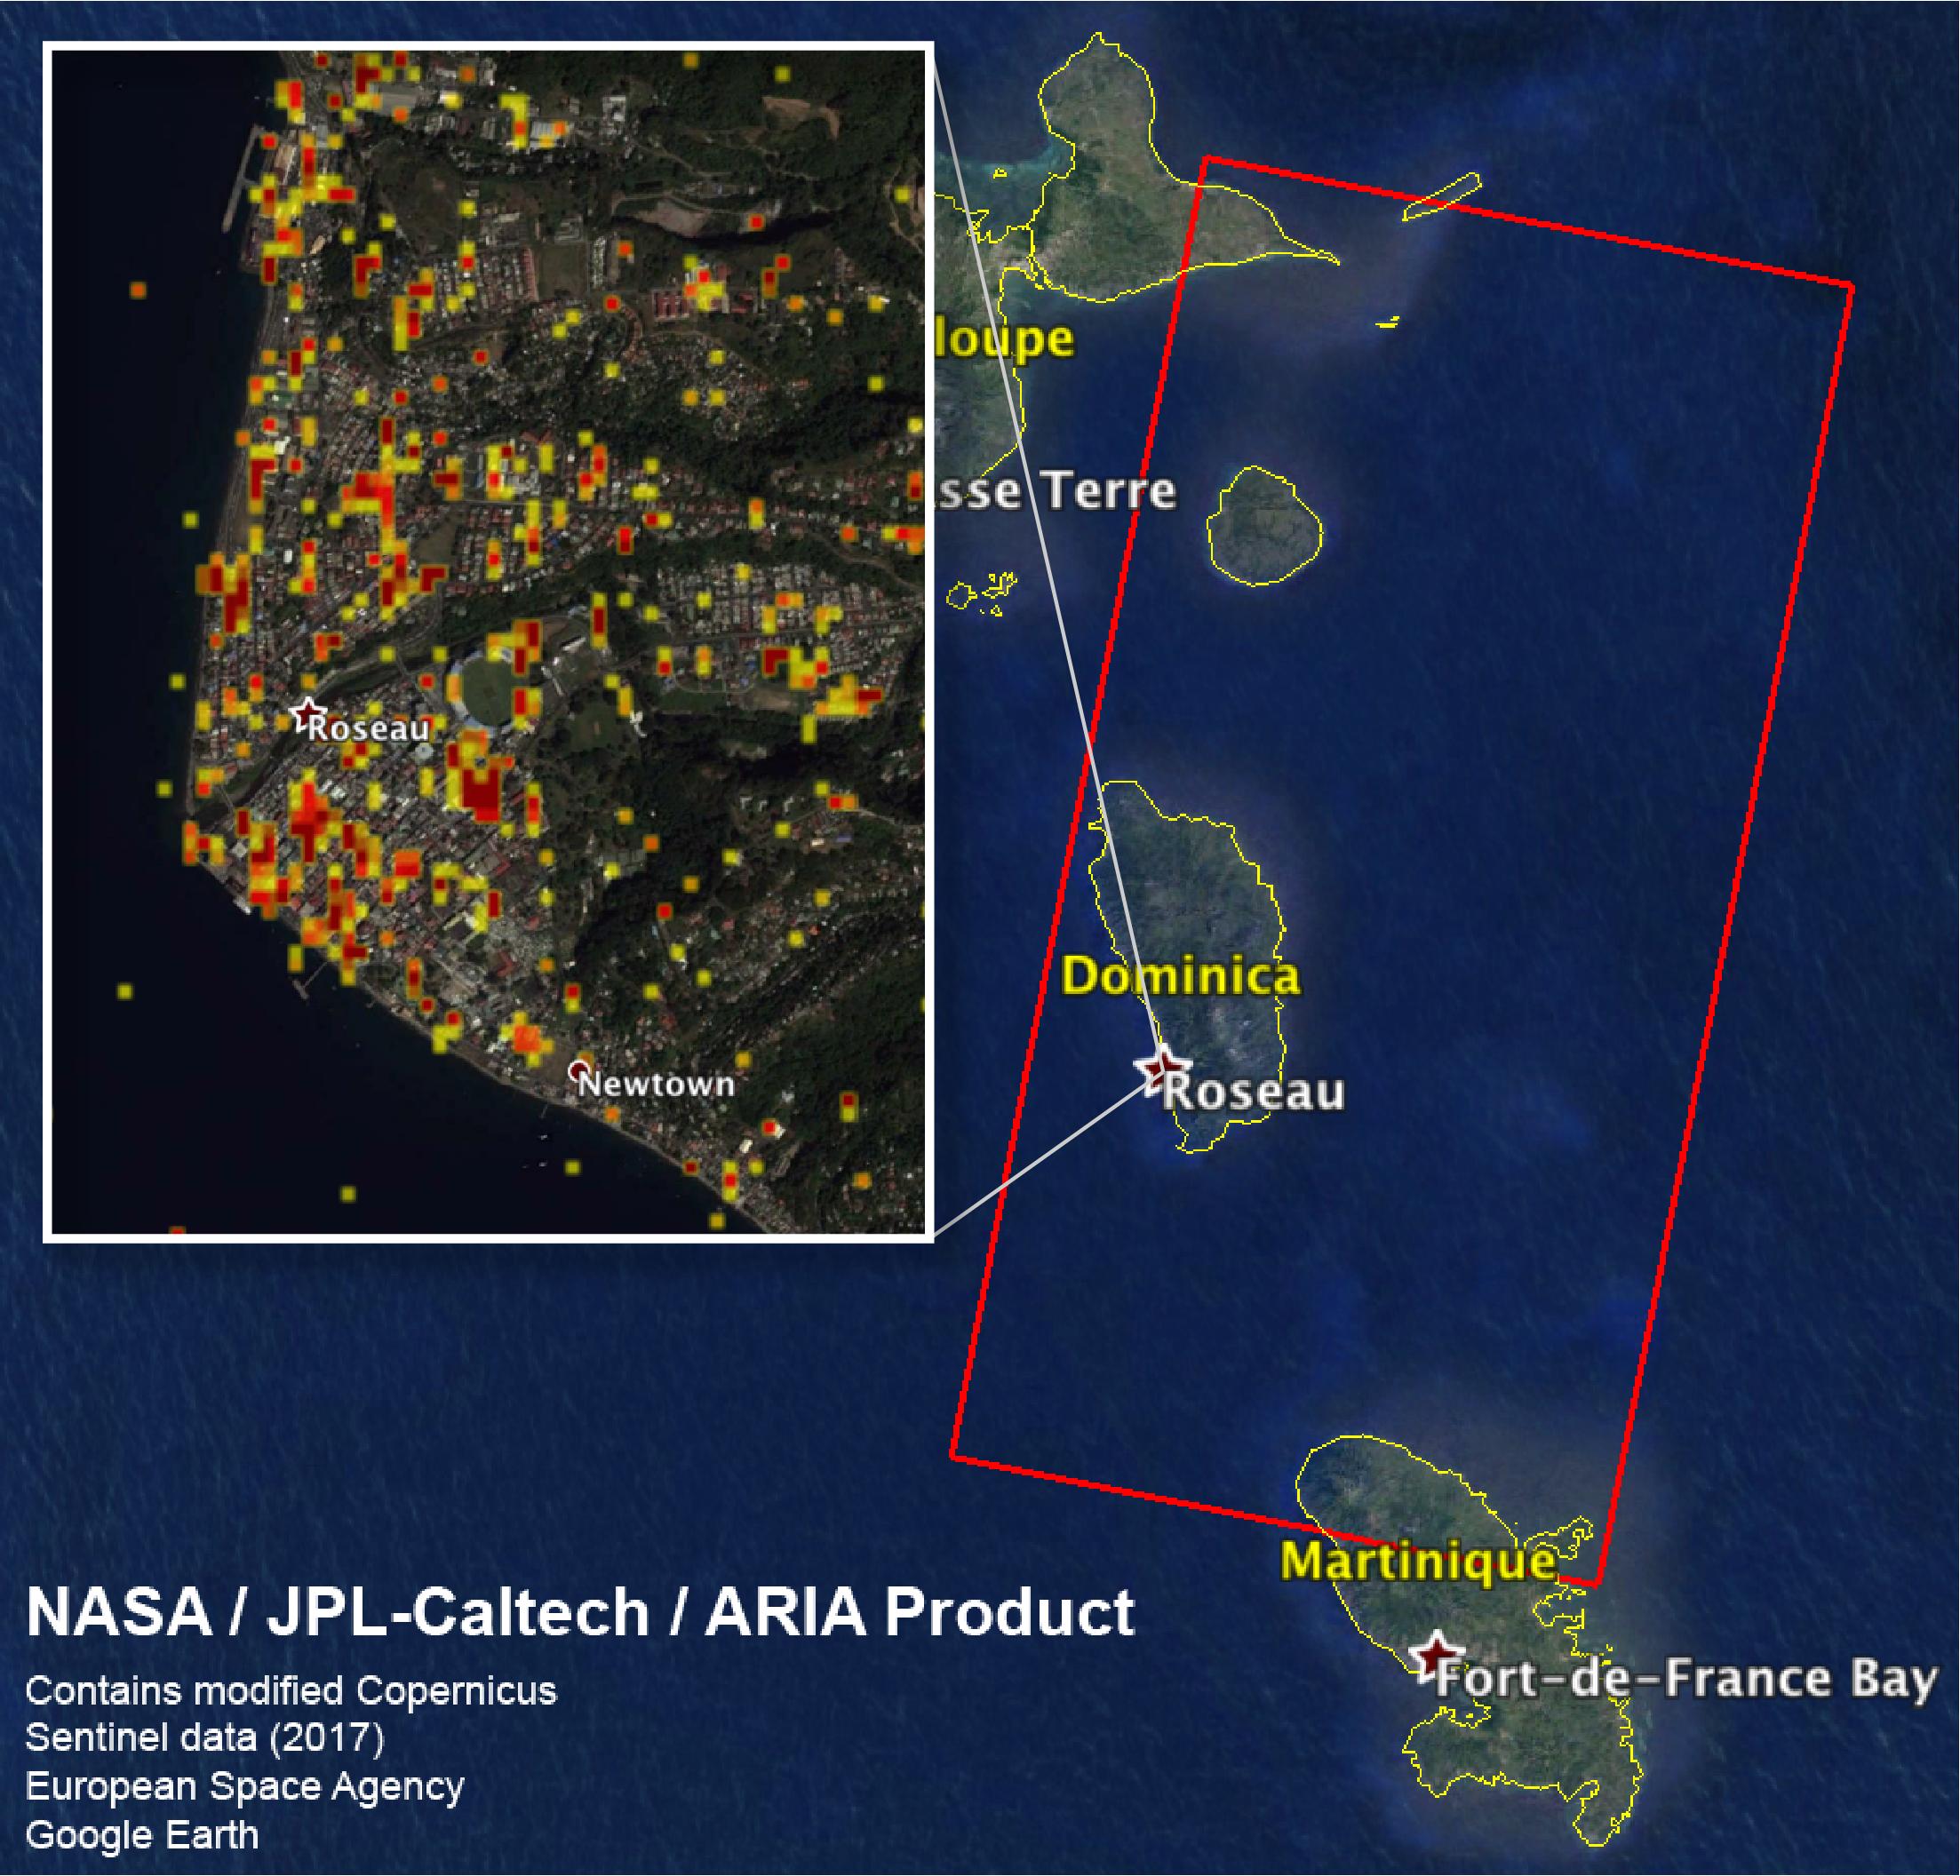
2017-09-29 |
Earth
|
ARIA
|
|
2206x2112x3 |

|
-
PIA22037:
-
Dominica Hurricane Damage Mapped by NASA's ARIA Team
Full Resolution:
TIFF
(9.583 MB)
JPEG
(474.4 kB)
|
|
|
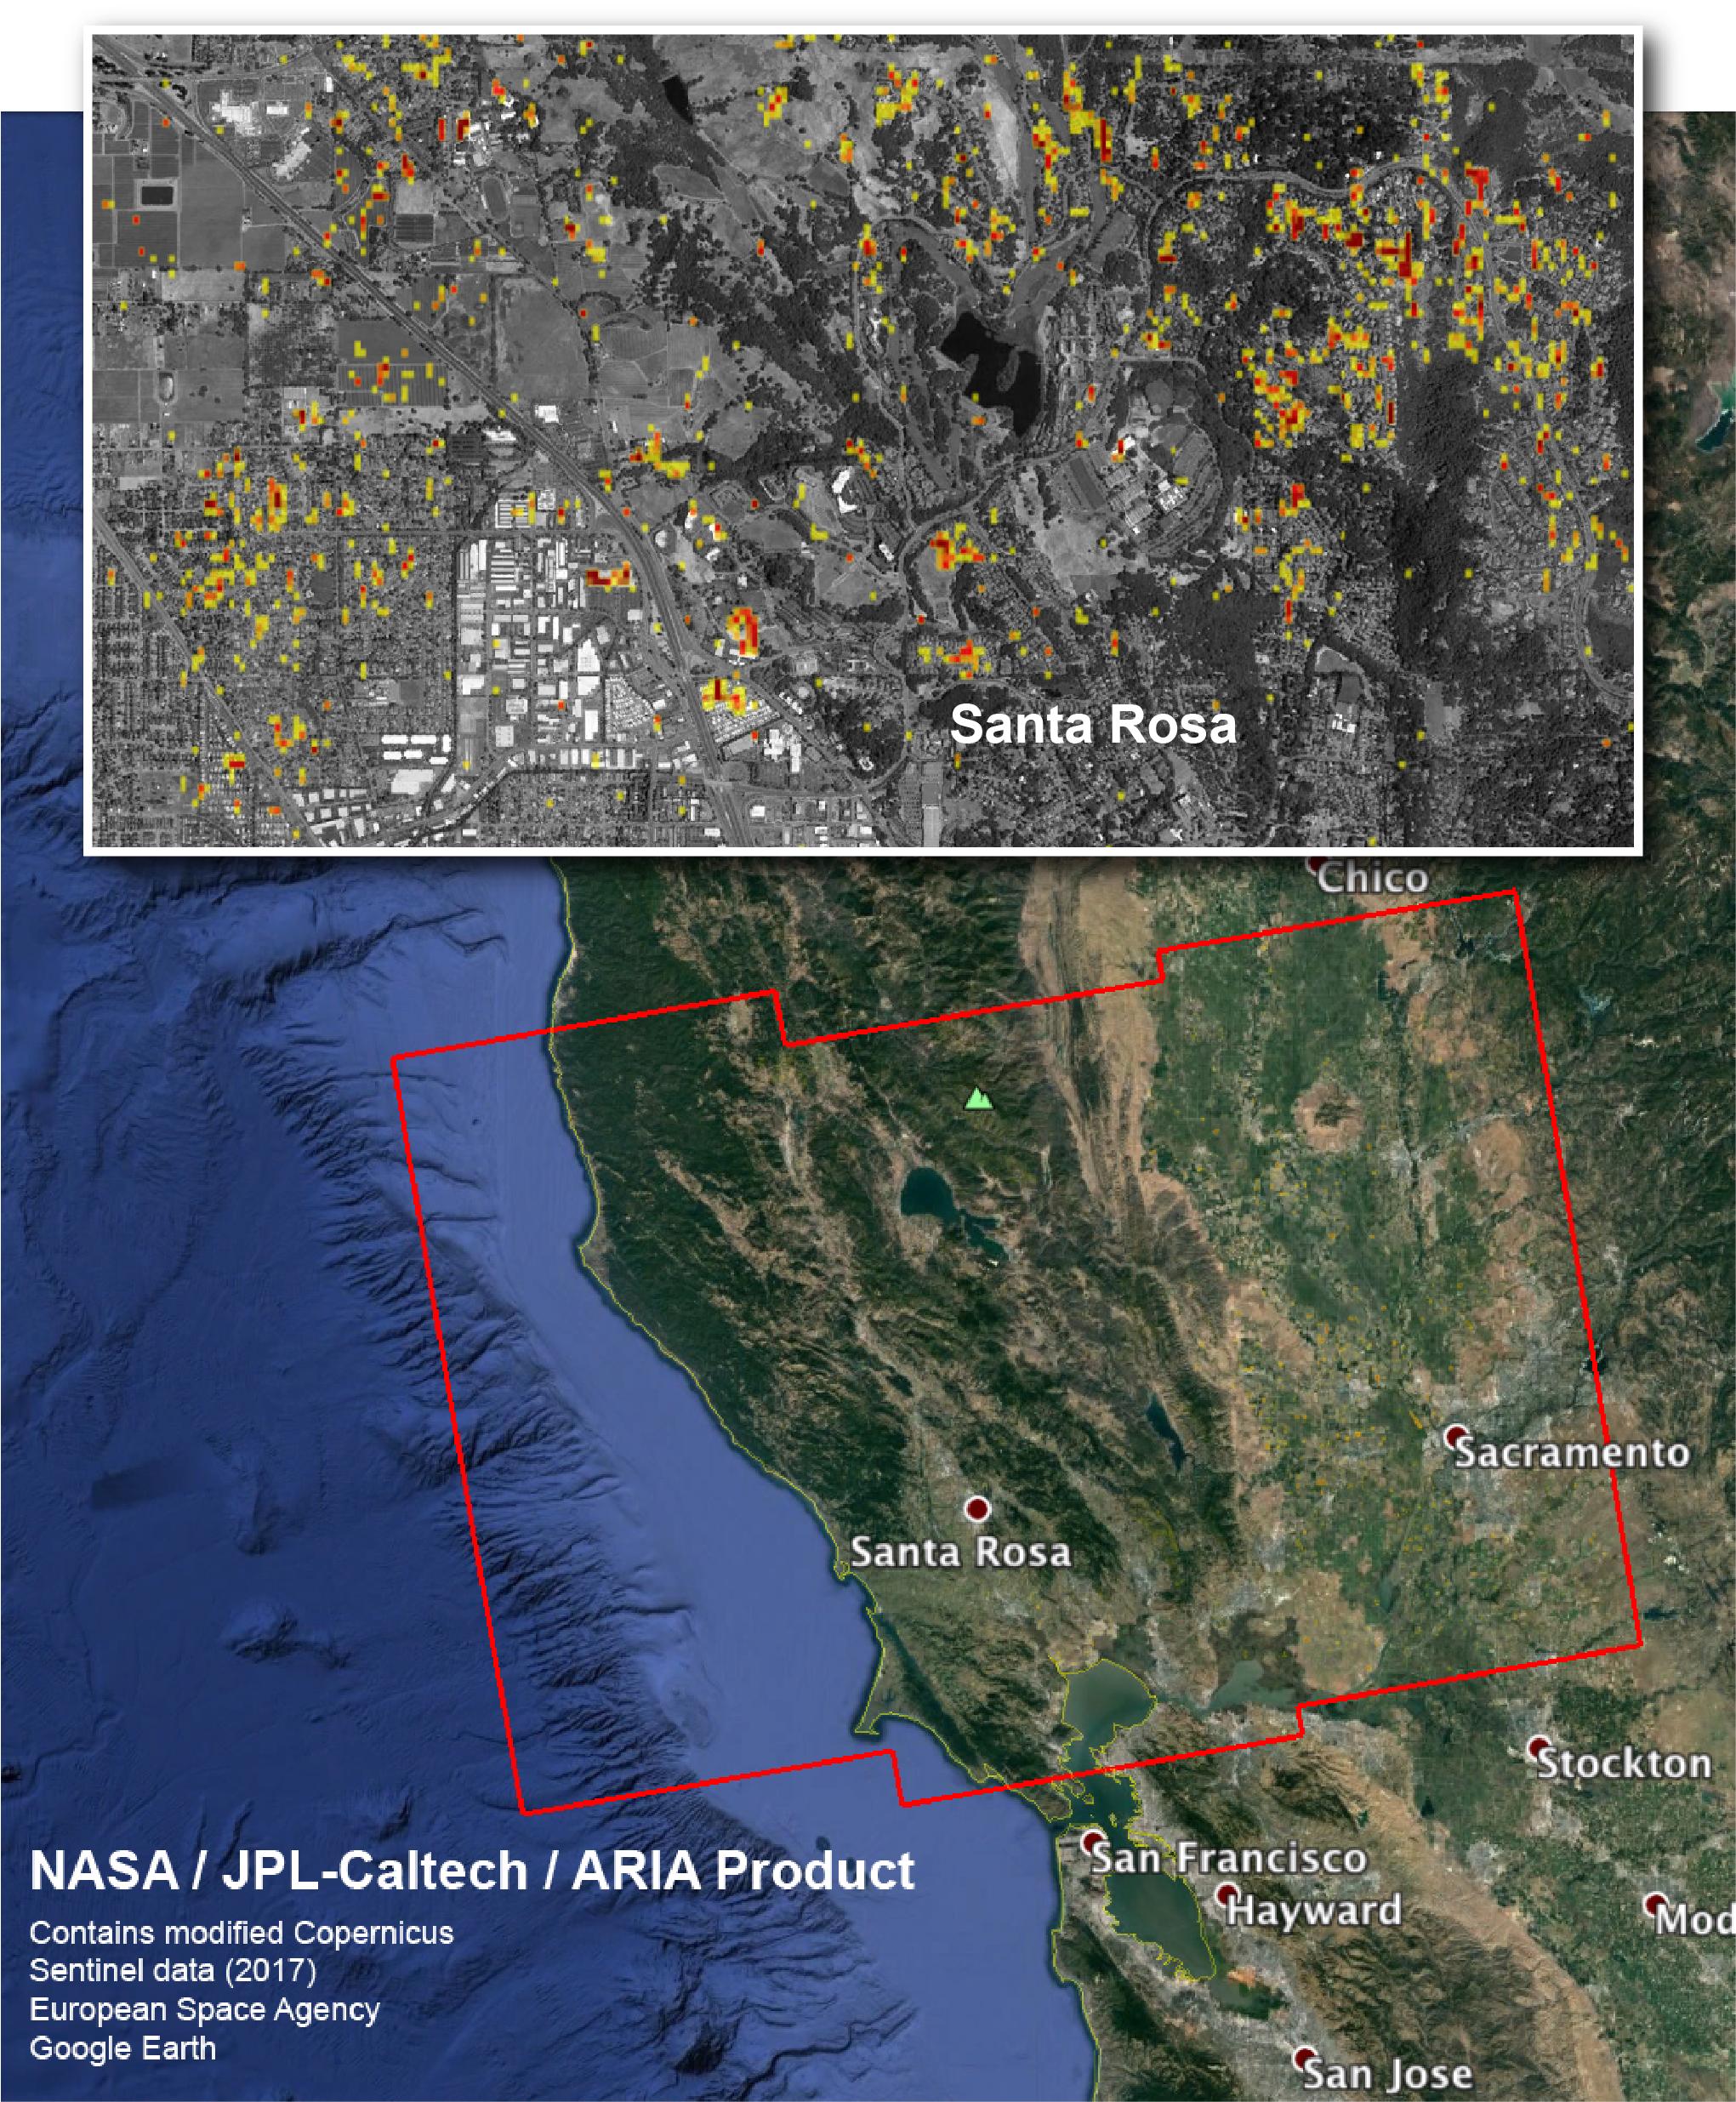
2017-10-18 |
Earth
|
ARIA
|
|
2041x2471x3 |
|
-
PIA22048:
-
NASA Damage Map Aids Northern California Wildfire Response
Full Resolution:
TIFF
(11.3 MB)
JPEG
(920.9 kB)
|
|
|
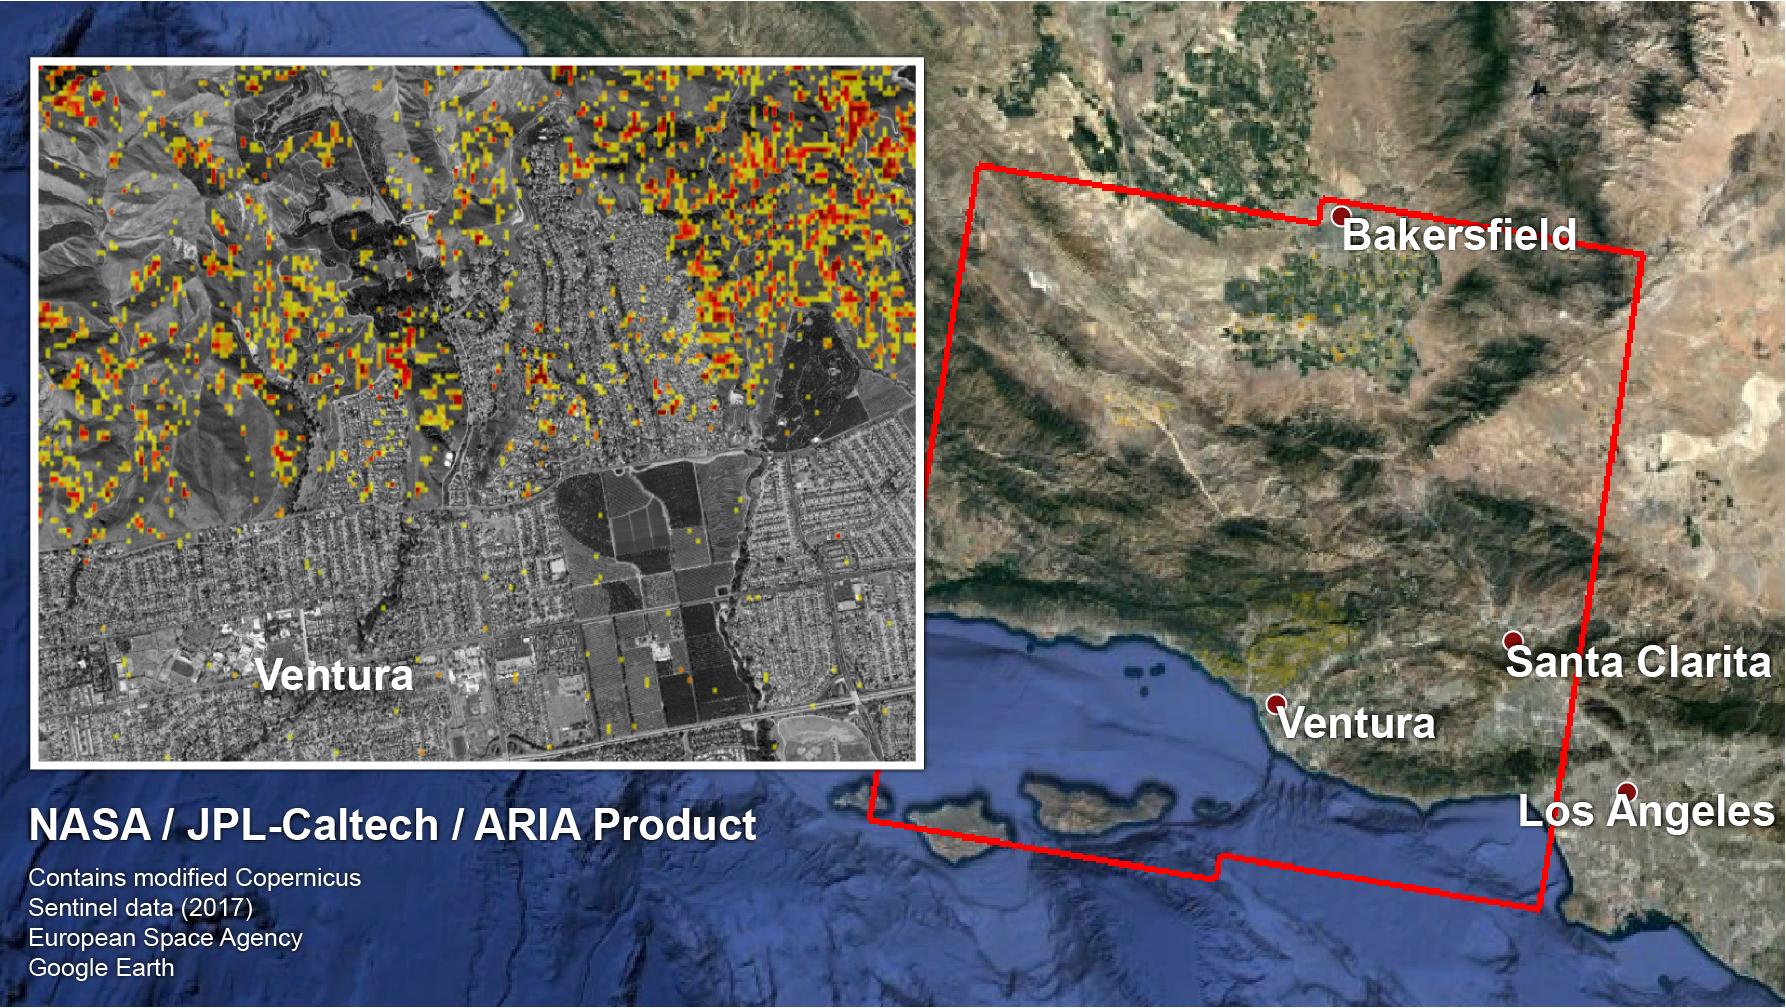
2017-12-14 |
Earth
|
ARIA
|
|
1786x1008x3 |
|
-
PIA22191:
-
NASA-Produced Map Shows Extent of Southern California Wildfire Damage
Full Resolution:
TIFF
(4.691 MB)
JPEG
(384.9 kB)
|
|
|
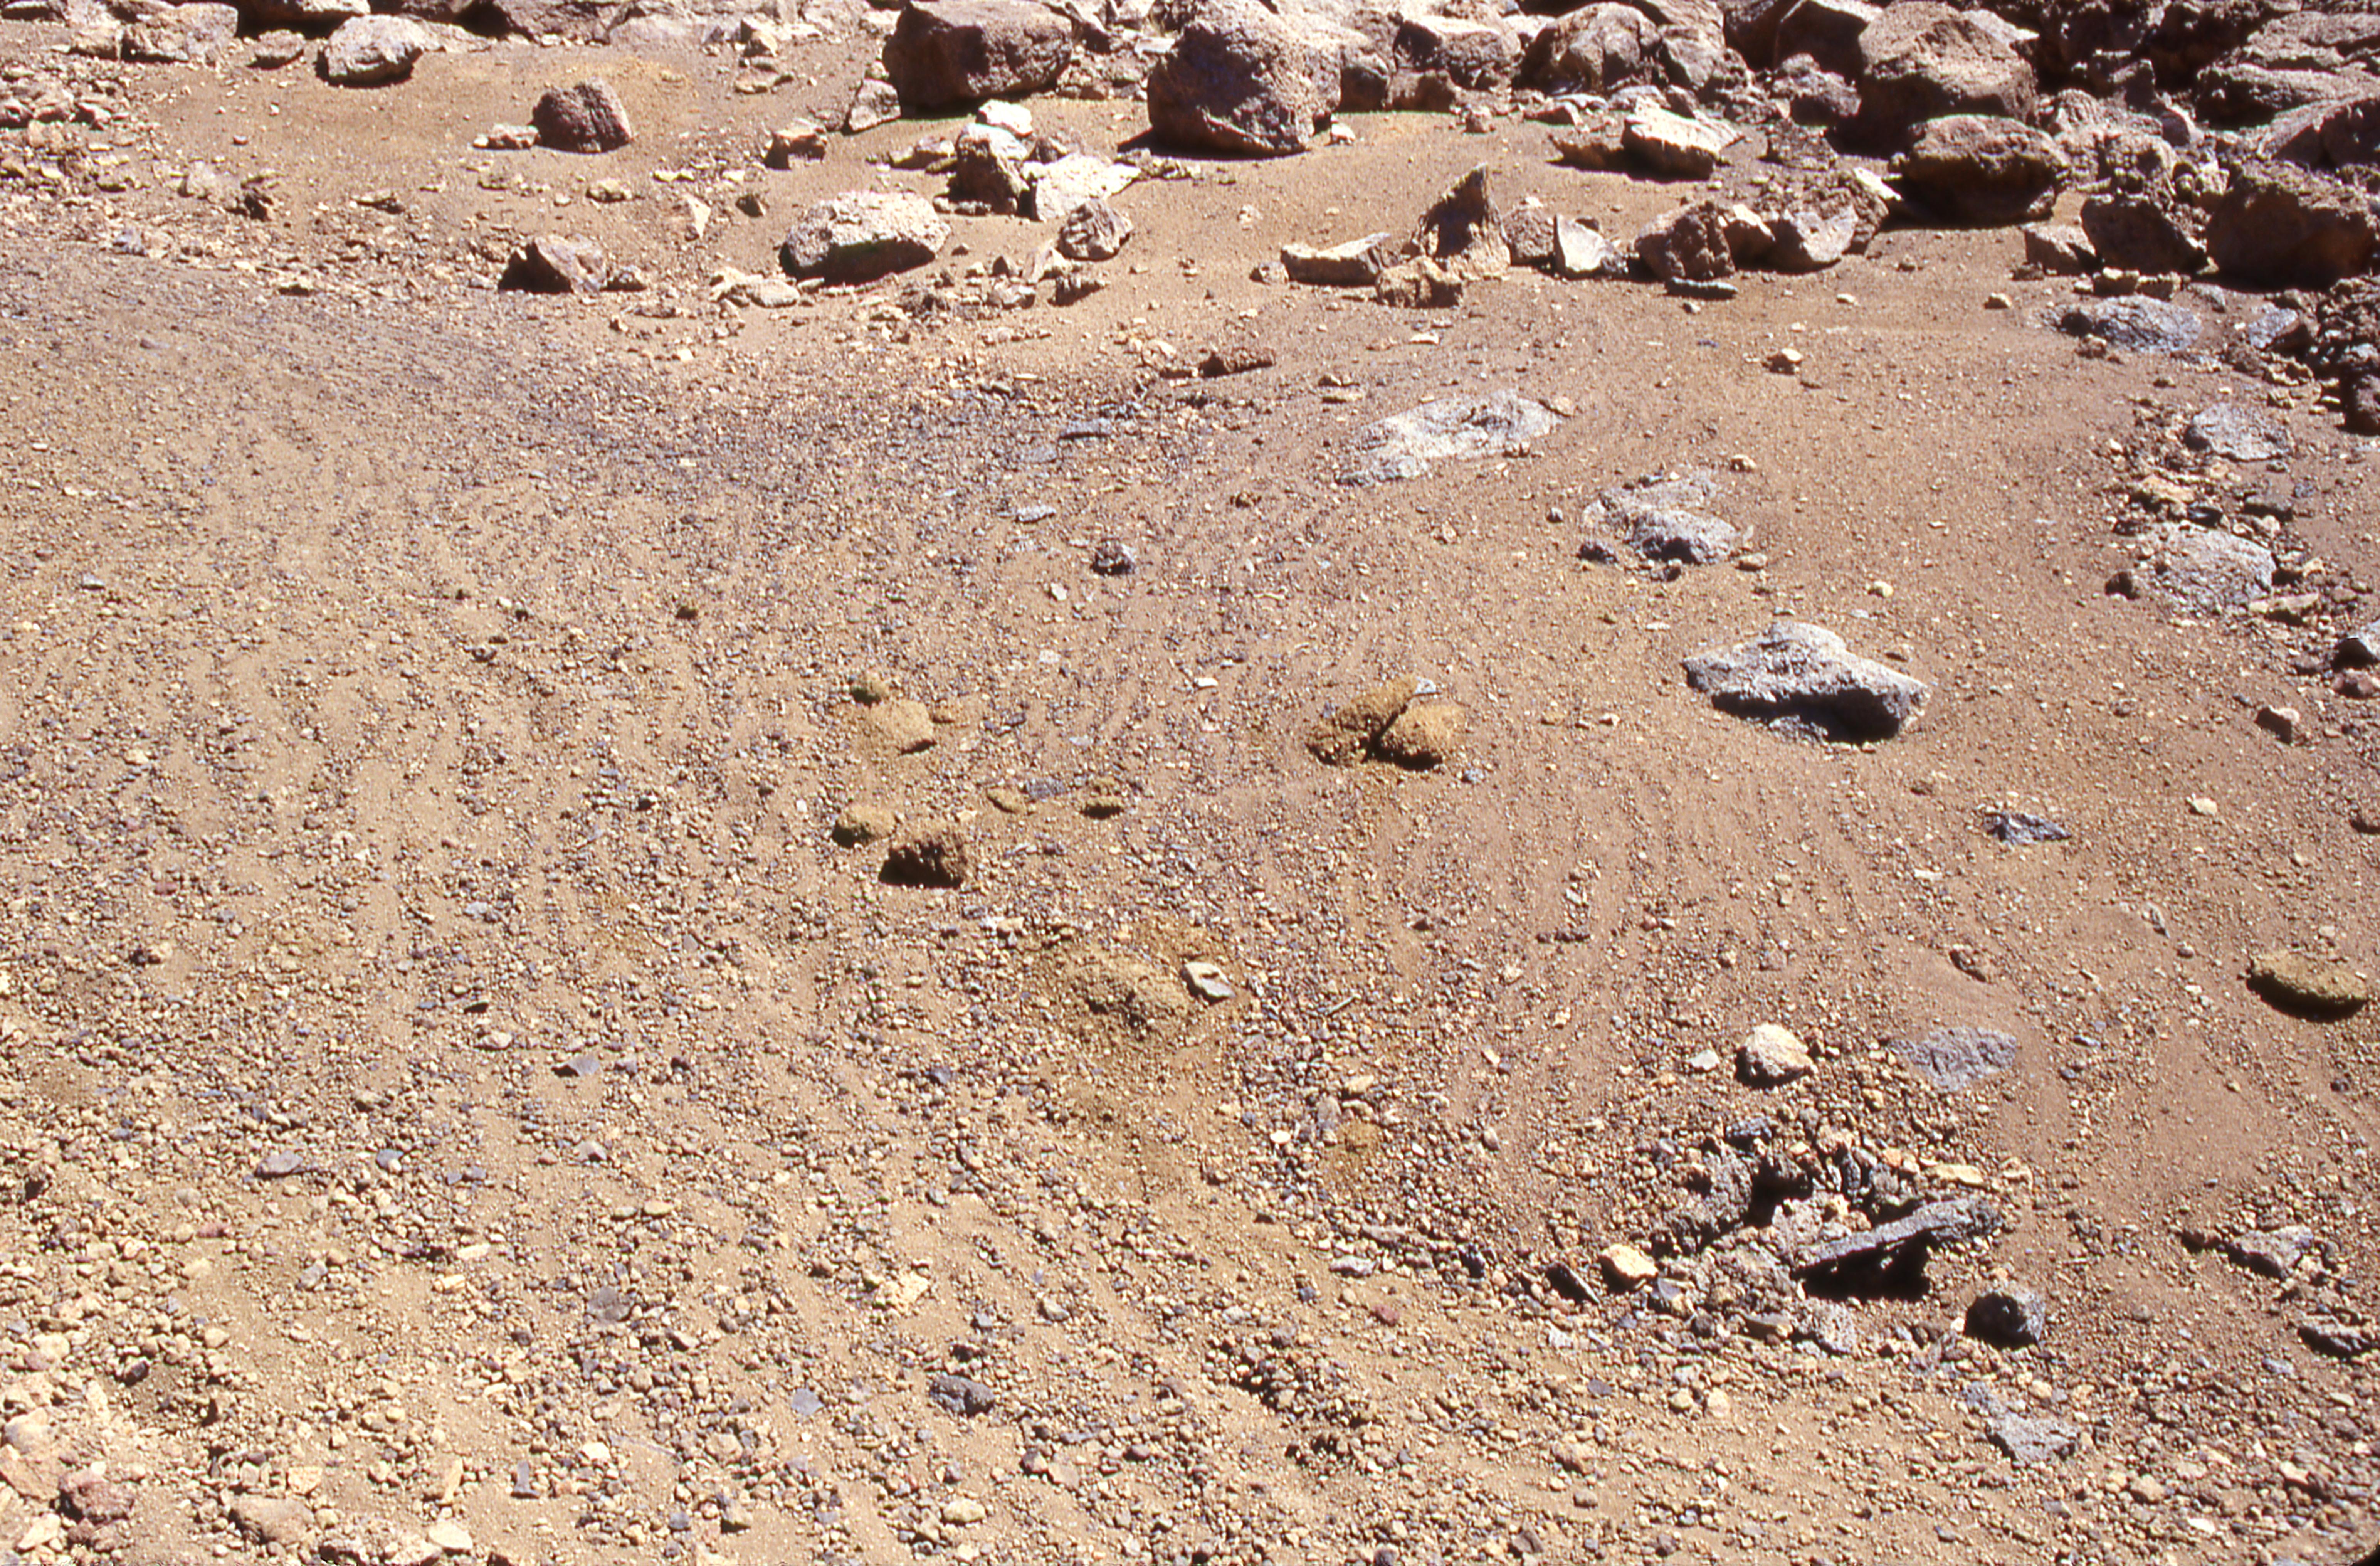
2018-02-15 |
Earth
|
|
|
6176x4063x3 |
|
-
PIA22219:
-
Rock Stripe Pattern on Hawaii's Mauna Kea
Full Resolution:
TIFF
(75.31 MB)
JPEG
(3.928 MB)
|
|
|
2018-02-21 |
Earth
|
ARIA
|
|
4568x3022x3 |

|
-
PIA22257:
-
Tonga Cyclone Damage Mapped by NASA's ARIA Team
Full Resolution:
TIFF
(22.99 MB)
JPEG
(1.141 MB)
|
|
|
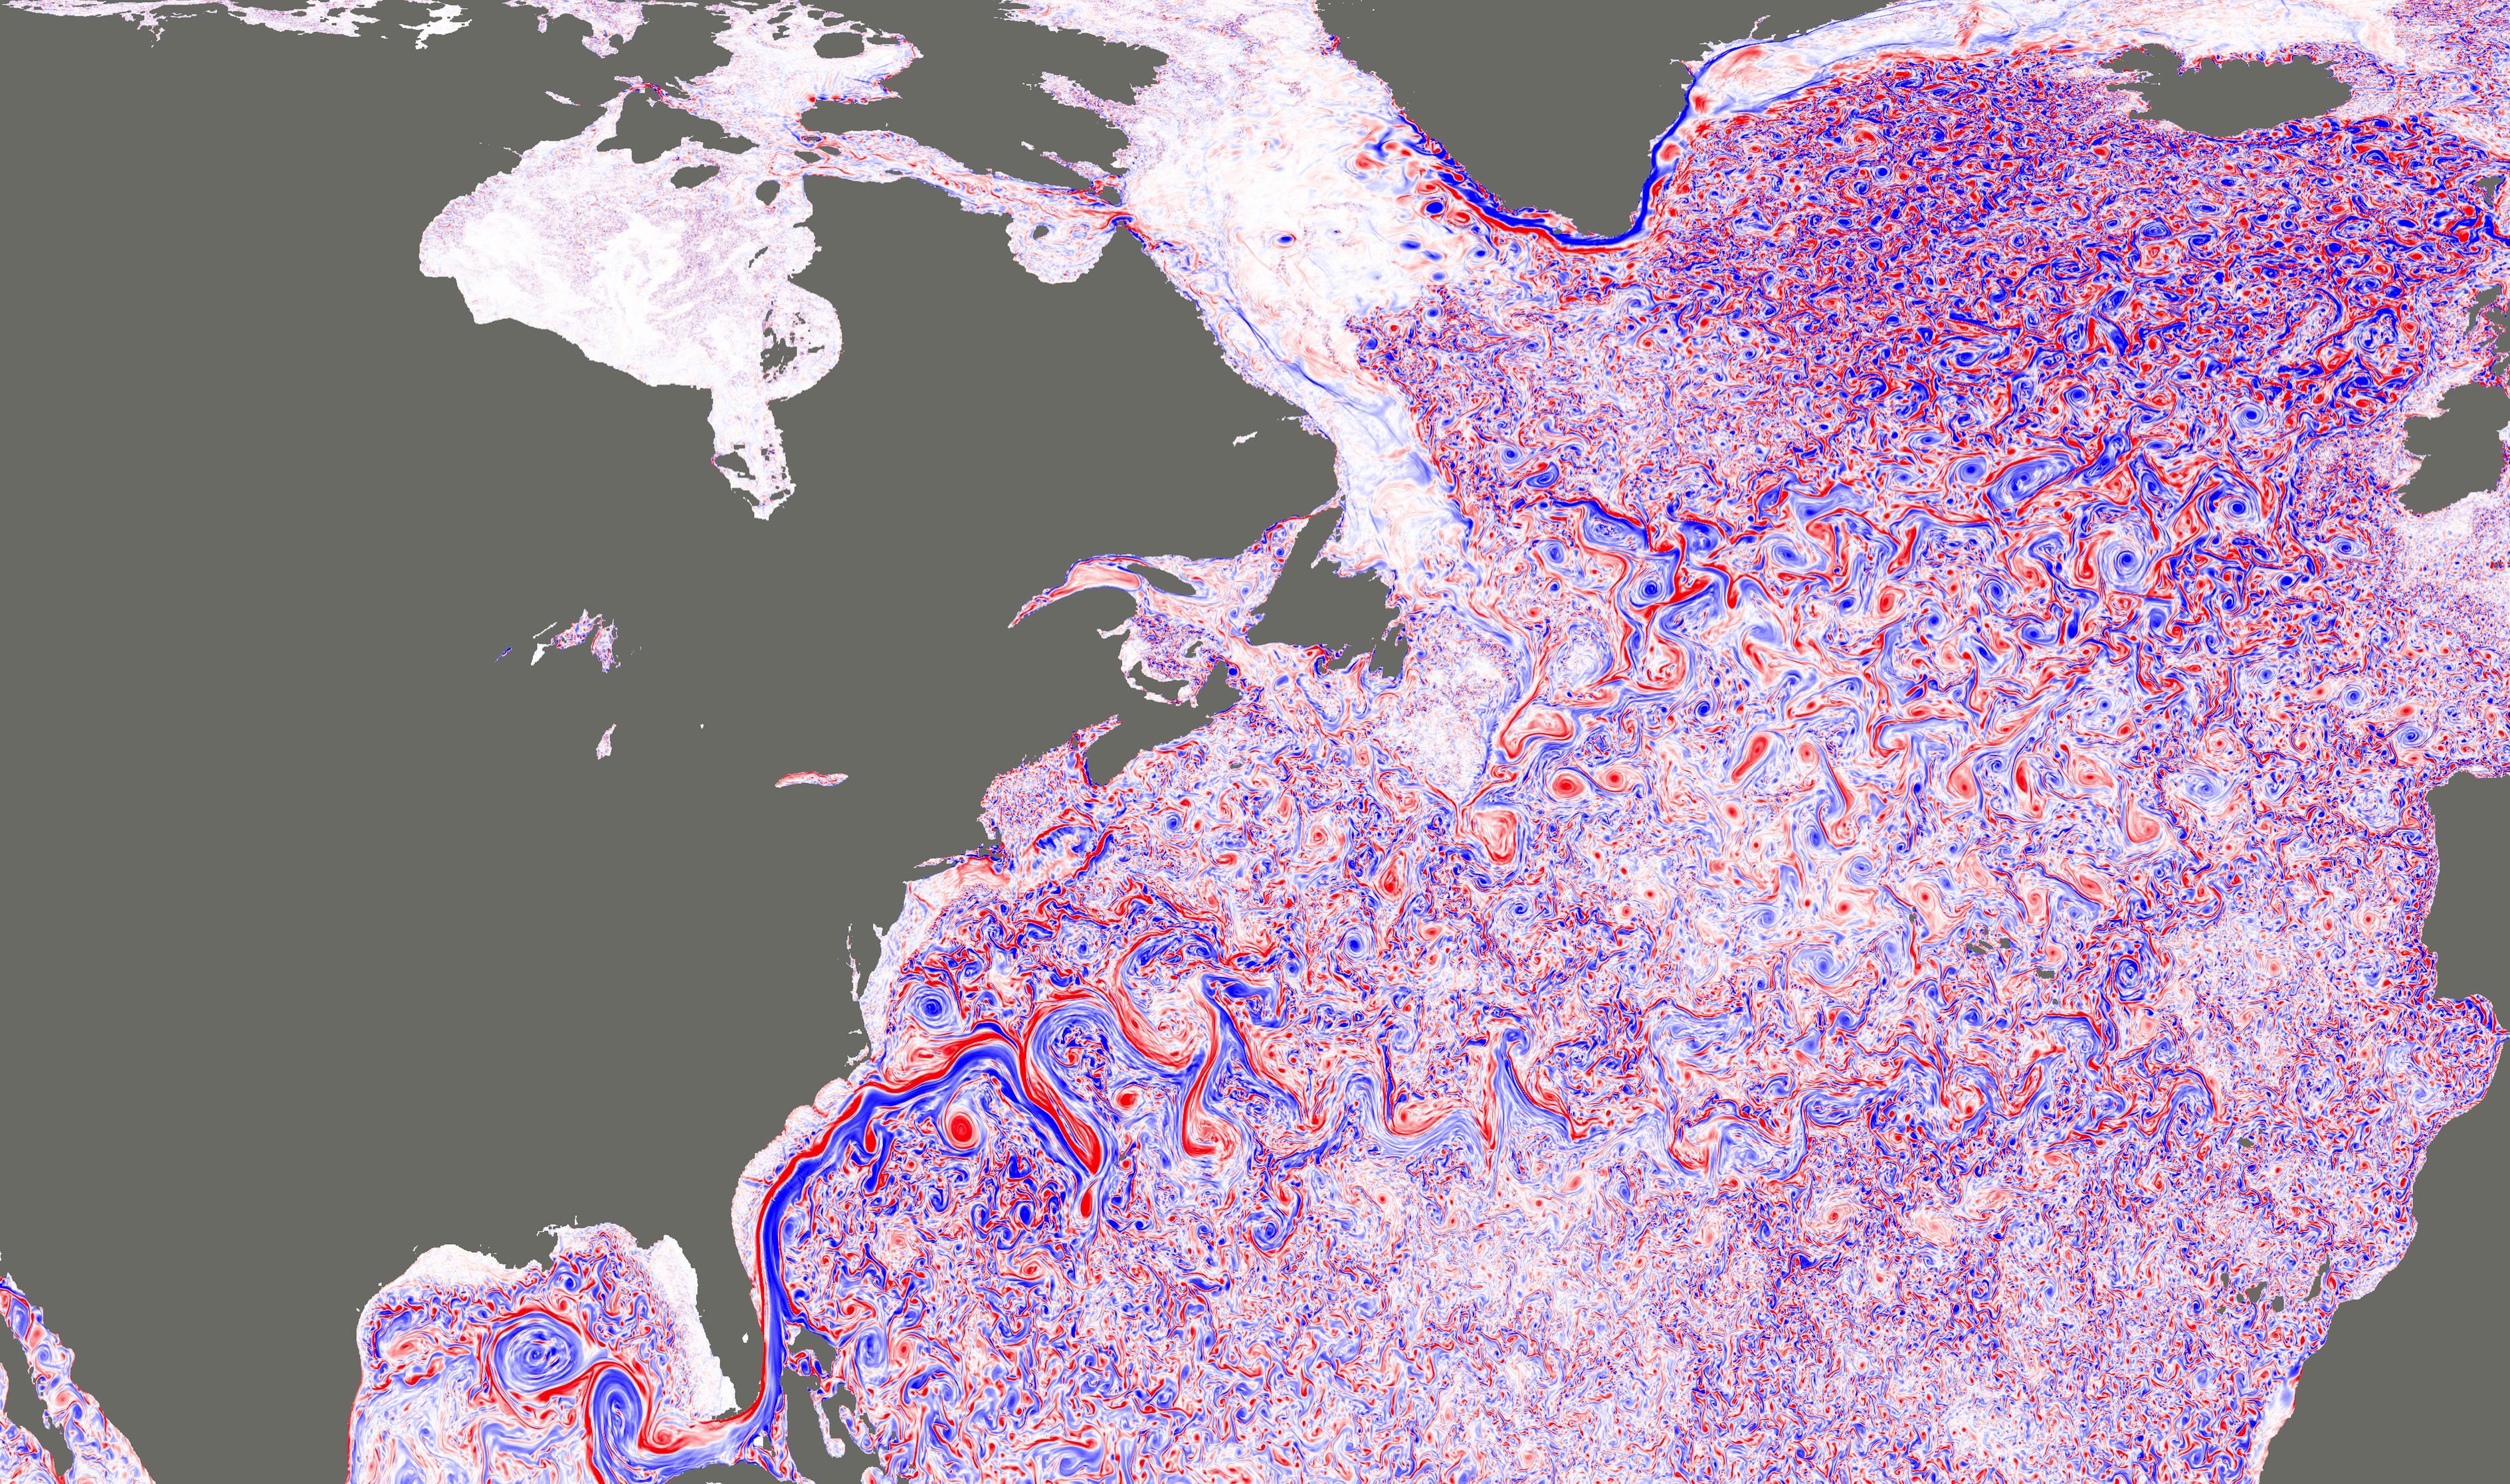
2018-02-21 |
Earth
|
|
|
3778x2234x3 |
|
-
PIA22256:
-
NASA Simulation Shows Ocean Turbulence in the North Atlantic
Full Resolution:
TIFF
(17.06 MB)
JPEG
(2.186 MB)
|
|
|
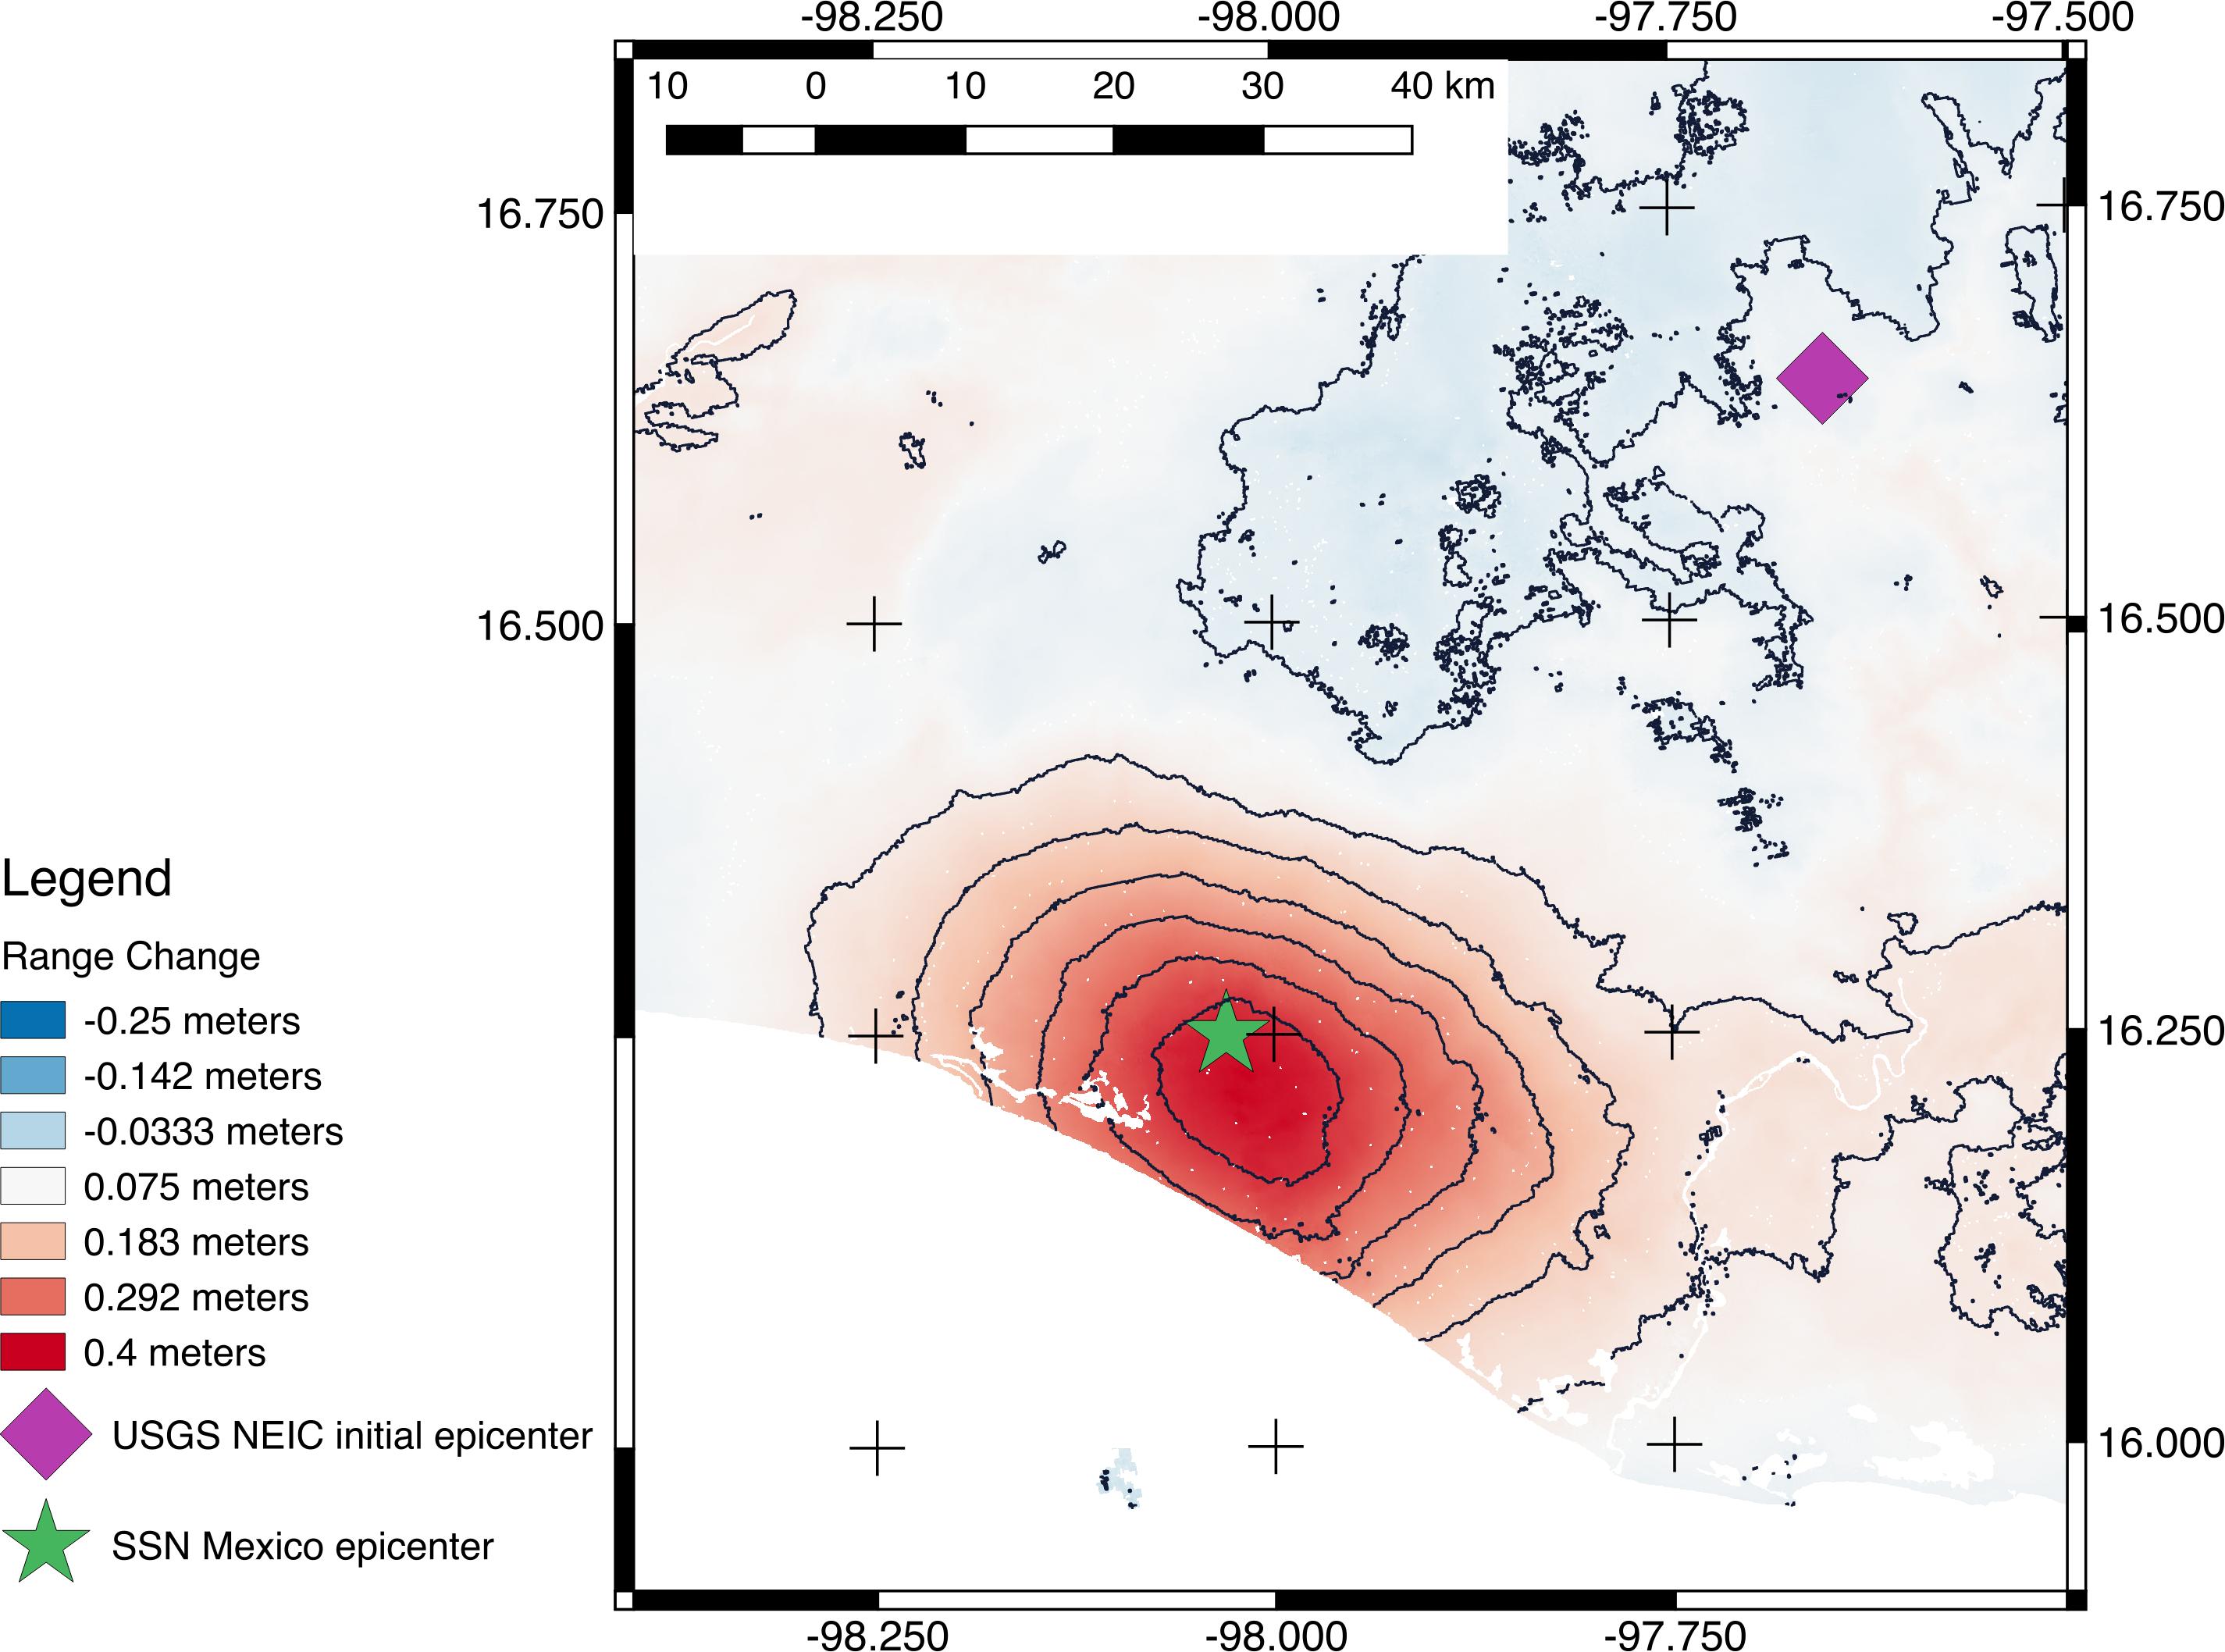
2018-02-22 |
Earth
|
ARIA
|
|
2850x2116x3 |
|
-
PIA22258:
-
NASA's ARIA Project Generates New Satellite-Derived Map of Ground Deformation from Latest Mexico Quake
Full Resolution:
TIFF
(3.572 MB)
JPEG
(449.5 kB)
|
|
|
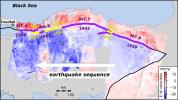
2018-03-15 |
Earth
|
|
|
1080x810x3 |
|
-
PIA22343:
-
Mapping the Extent of California's Deadly Jan. 2018 Mudflows
Full Resolution:
TIFF
(1.773 MB)
JPEG
(224.5 kB)
|
|
|
2018-04-12 |
Earth
|
ENVISAT
|
|
2367x1334x3 |
|
-
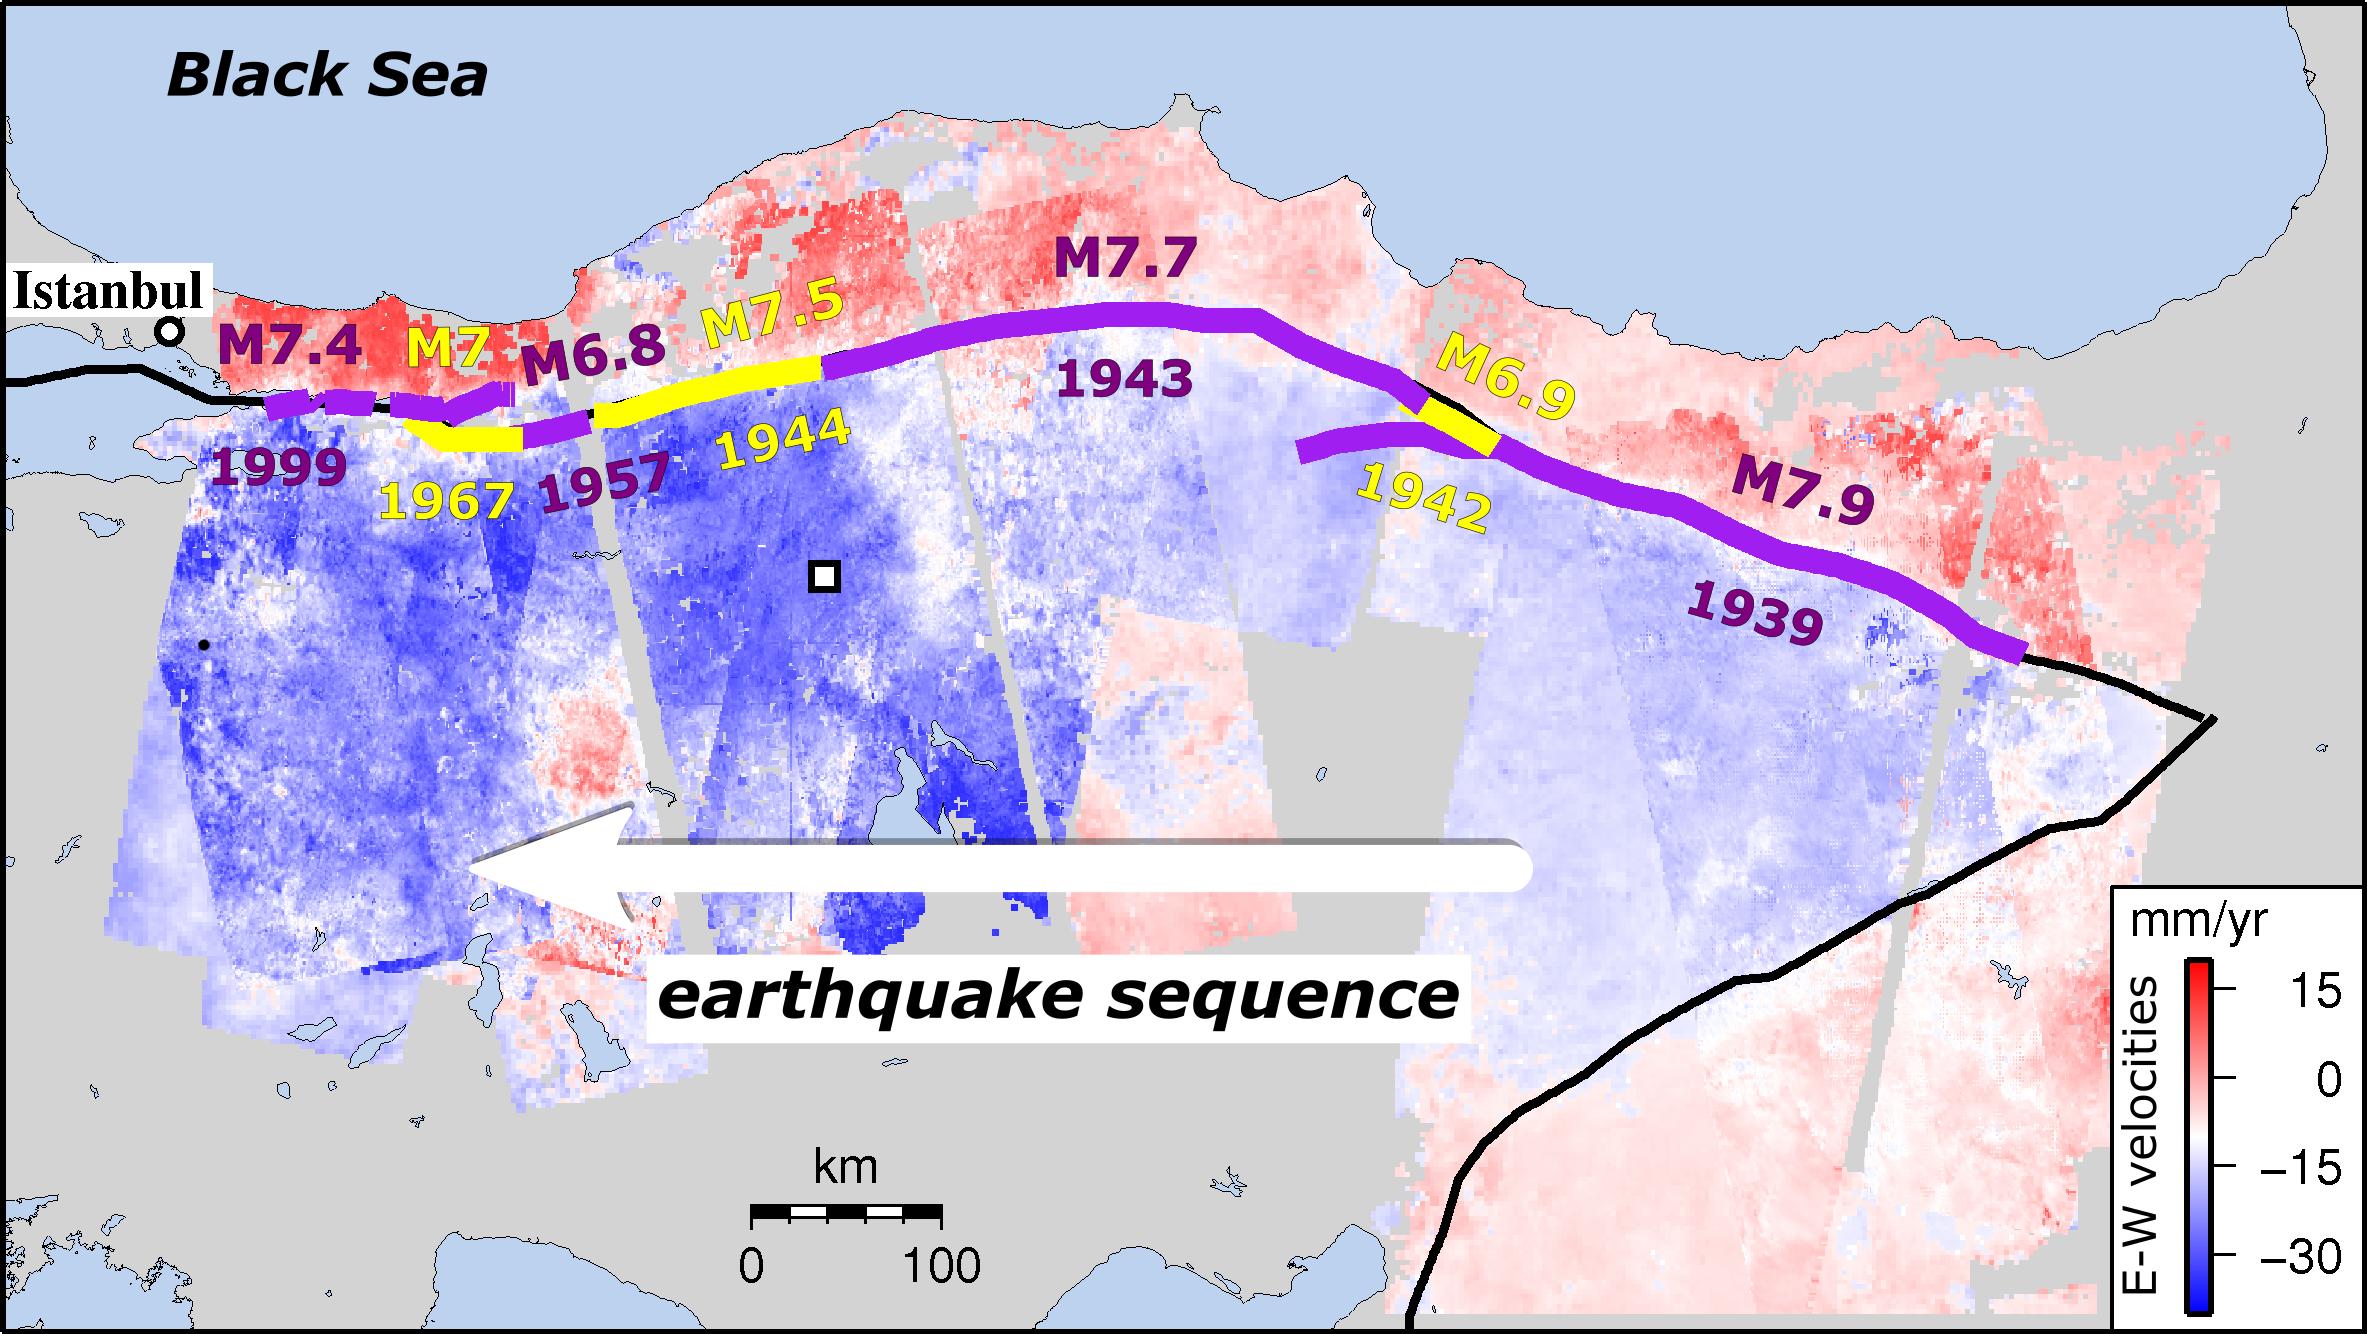
PIA22412:
-
Turkish Fault Reveals Seismic Steadiness
Full Resolution:
TIFF
(2.429 MB)
JPEG
(417.2 kB)
|
|
|
2018-05-15 |
Earth
|
MarCO
|
|
1151x734x3 |

|
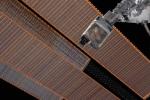
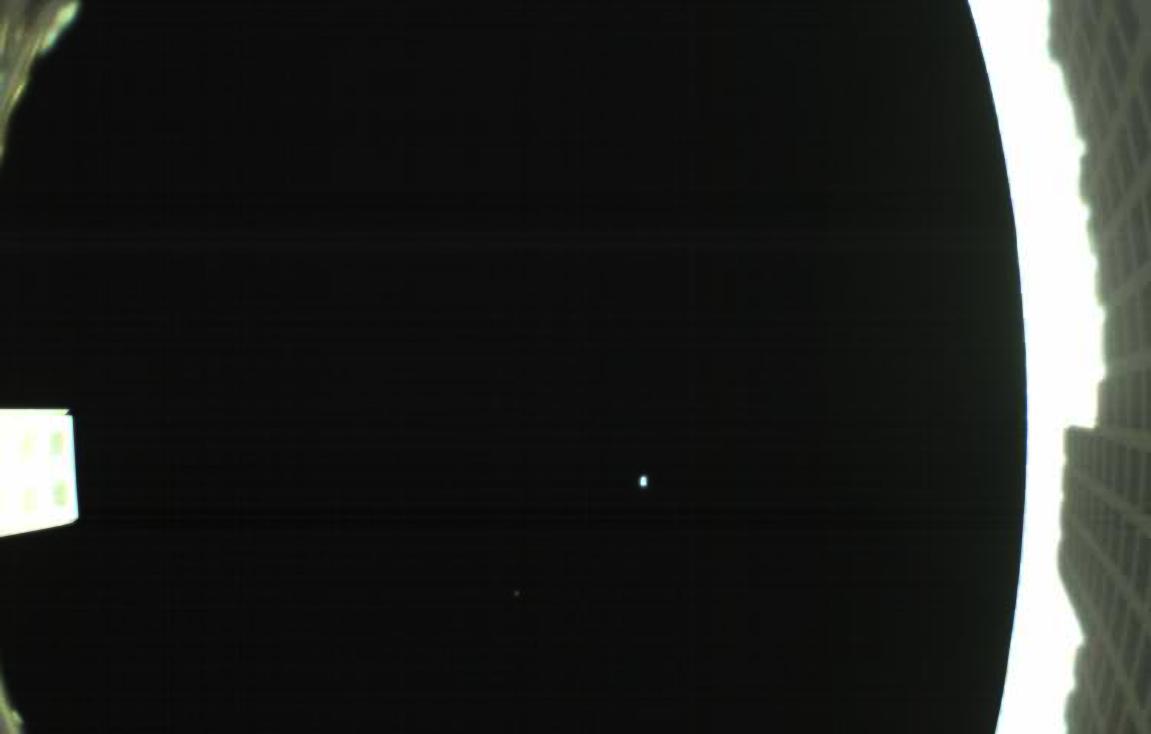
-
PIA22323:
-
First Image from MarCO-B
Full Resolution:
TIFF
(715.4 kB)
JPEG
(26.32 kB)
|
|
|
2018-06-06 |
Earth
|
Jason-3
|
|
3300x1555x3 |
|
-
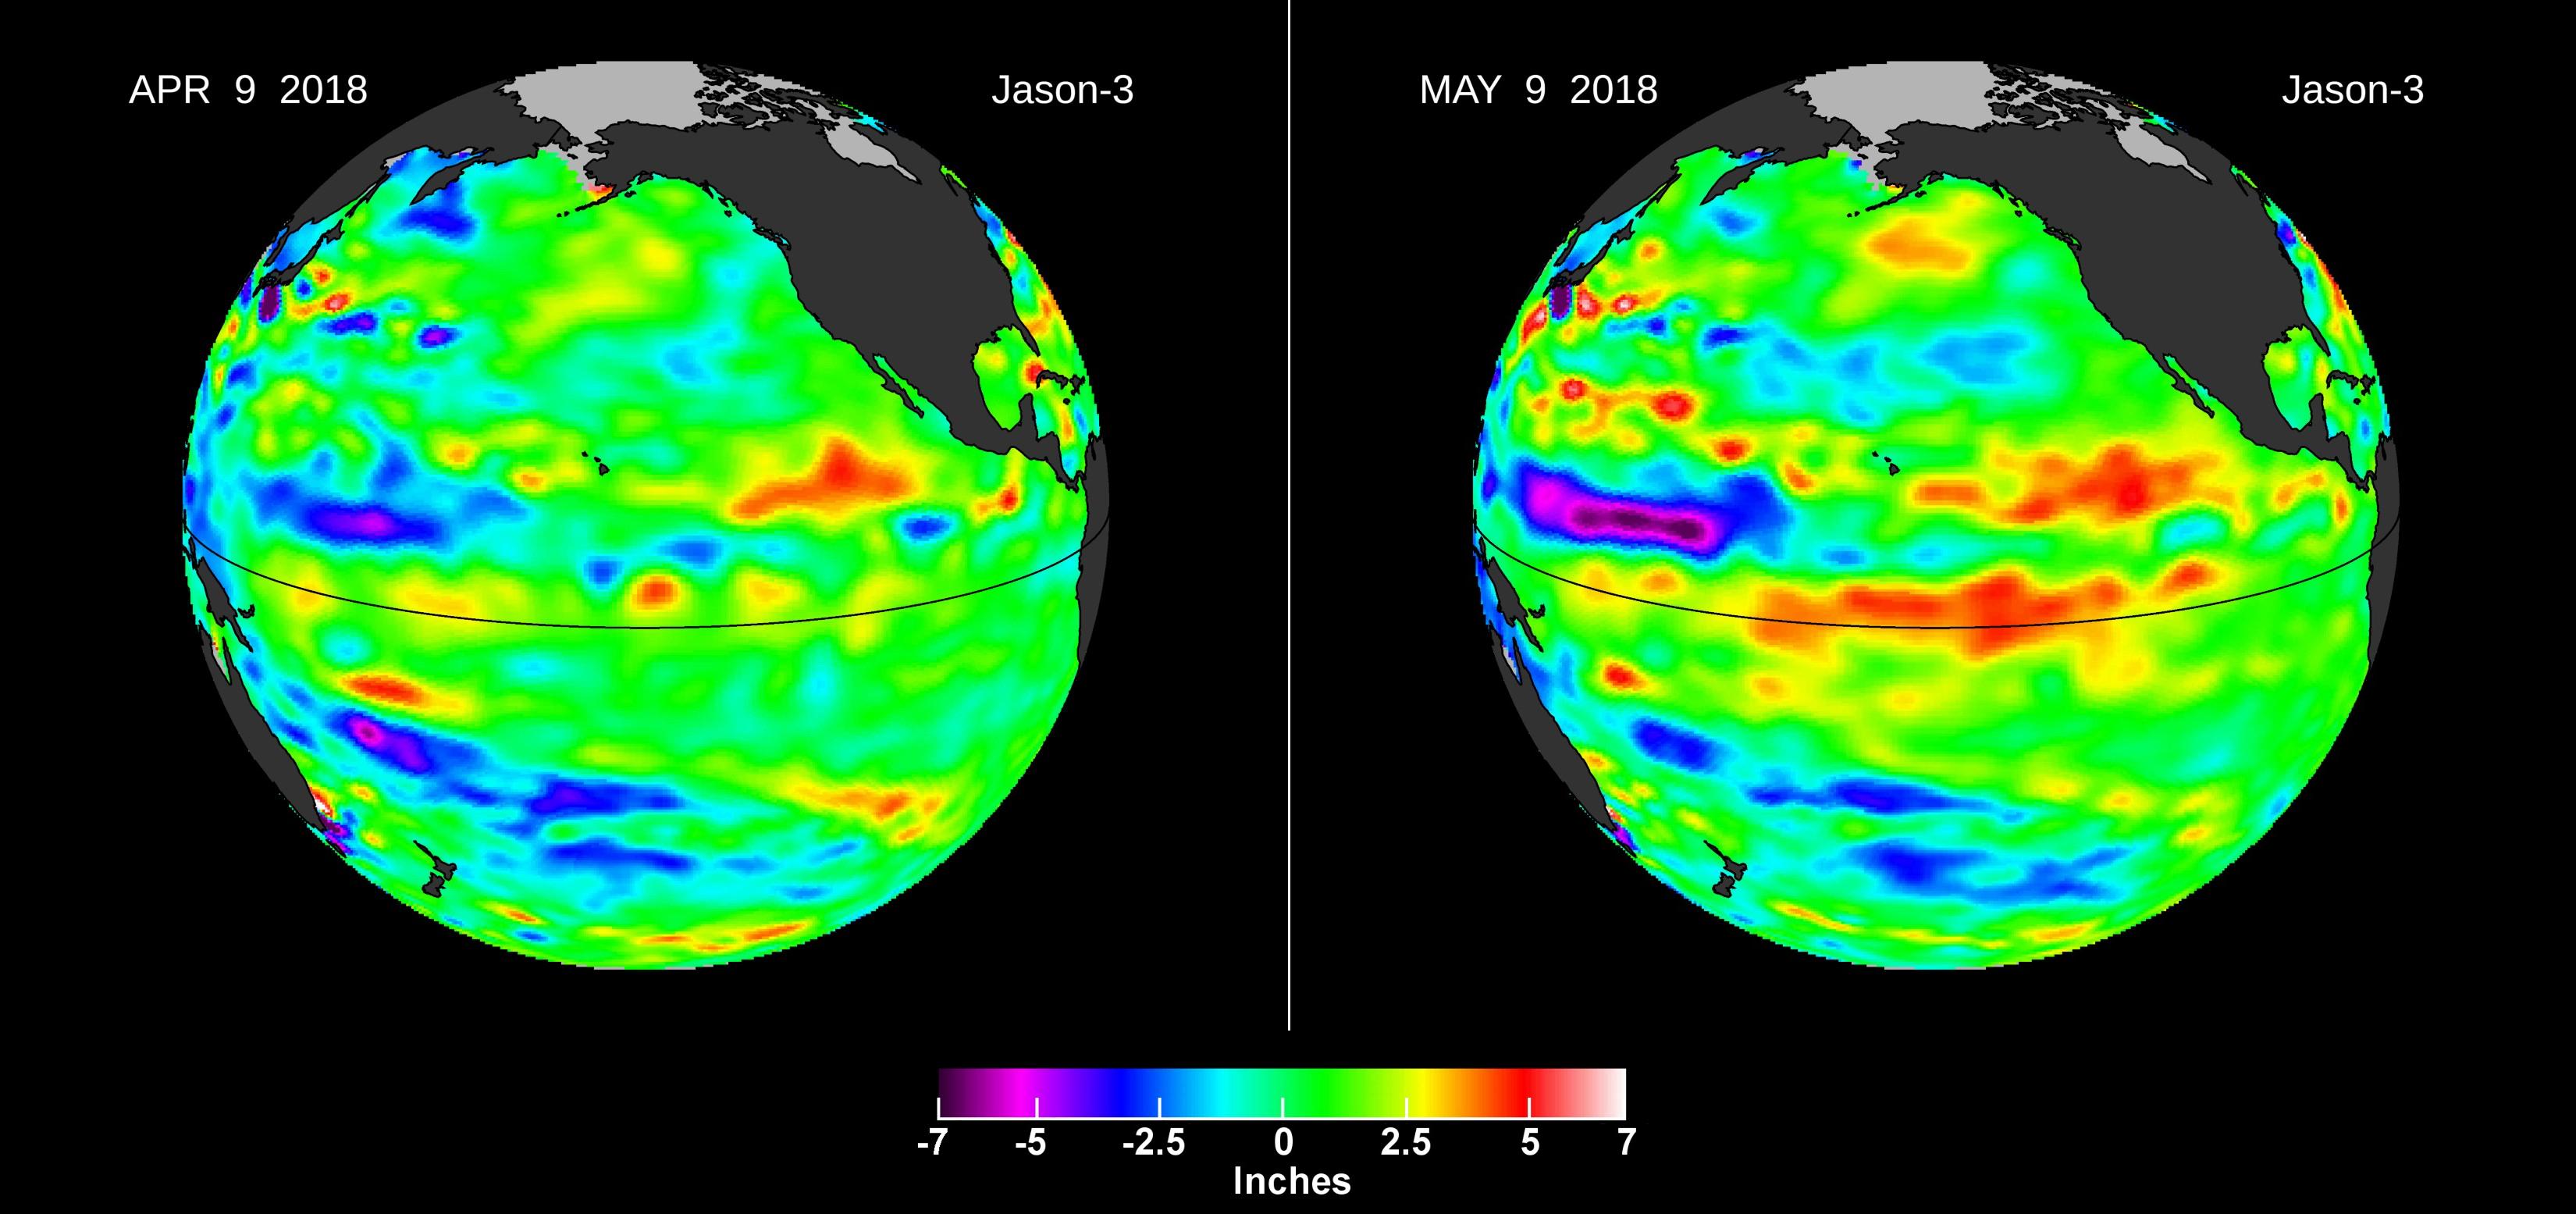
PIA22473:
-
Downwelling Kelvin Wave in the Pacific
Full Resolution:
TIFF
(5.931 MB)
JPEG
(352.9 kB)
|
|
|
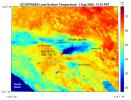
2018-07-23 |
Earth
|
ECOSTRESS
|
|
741x708x3 |
|
-
PIA22590:
-
NASA's ECOSTRESS First Light Image
Full Resolution:
TIFF
(1.575 MB)
JPEG
(116.3 kB)
|
|
|
2018-08-02 |
Earth
|
ECOSTRESS
|
|
740x697x3 |
|
-
PIA22490:
-
ECOSTRESS Detects Wildfires in Western U.S.
Full Resolution:
TIFF
(668.4 kB)
JPEG
(367.8 kB)
|
|
|
2018-08-08 |
Earth
|
ARIA
|
|
4135x2584x3 |
|
-
PIA22491:
-
NASA's ARIA Project Generates Satellite-Derived Map of Ground Deformation from Earthquake beneath Lombok, Indonesia
Full Resolution:
TIFF
(4.273 MB)
JPEG
(840 kB)
|
|
|
2018-09-13 |
Earth
|
SMAP
|
|
792x612x3 |
|
-
PIA22699:
-
Hurricane Florence seen by SMAP Imagery
Full Resolution:
TIFF
(573.5 kB)
JPEG
(81.67 kB)
|
|
|
2018-09-18 |
Earth
|
ECOSTRESS
|
|
1473x1105x3 |
|
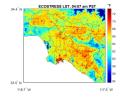
-
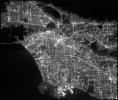
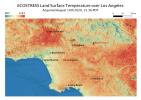
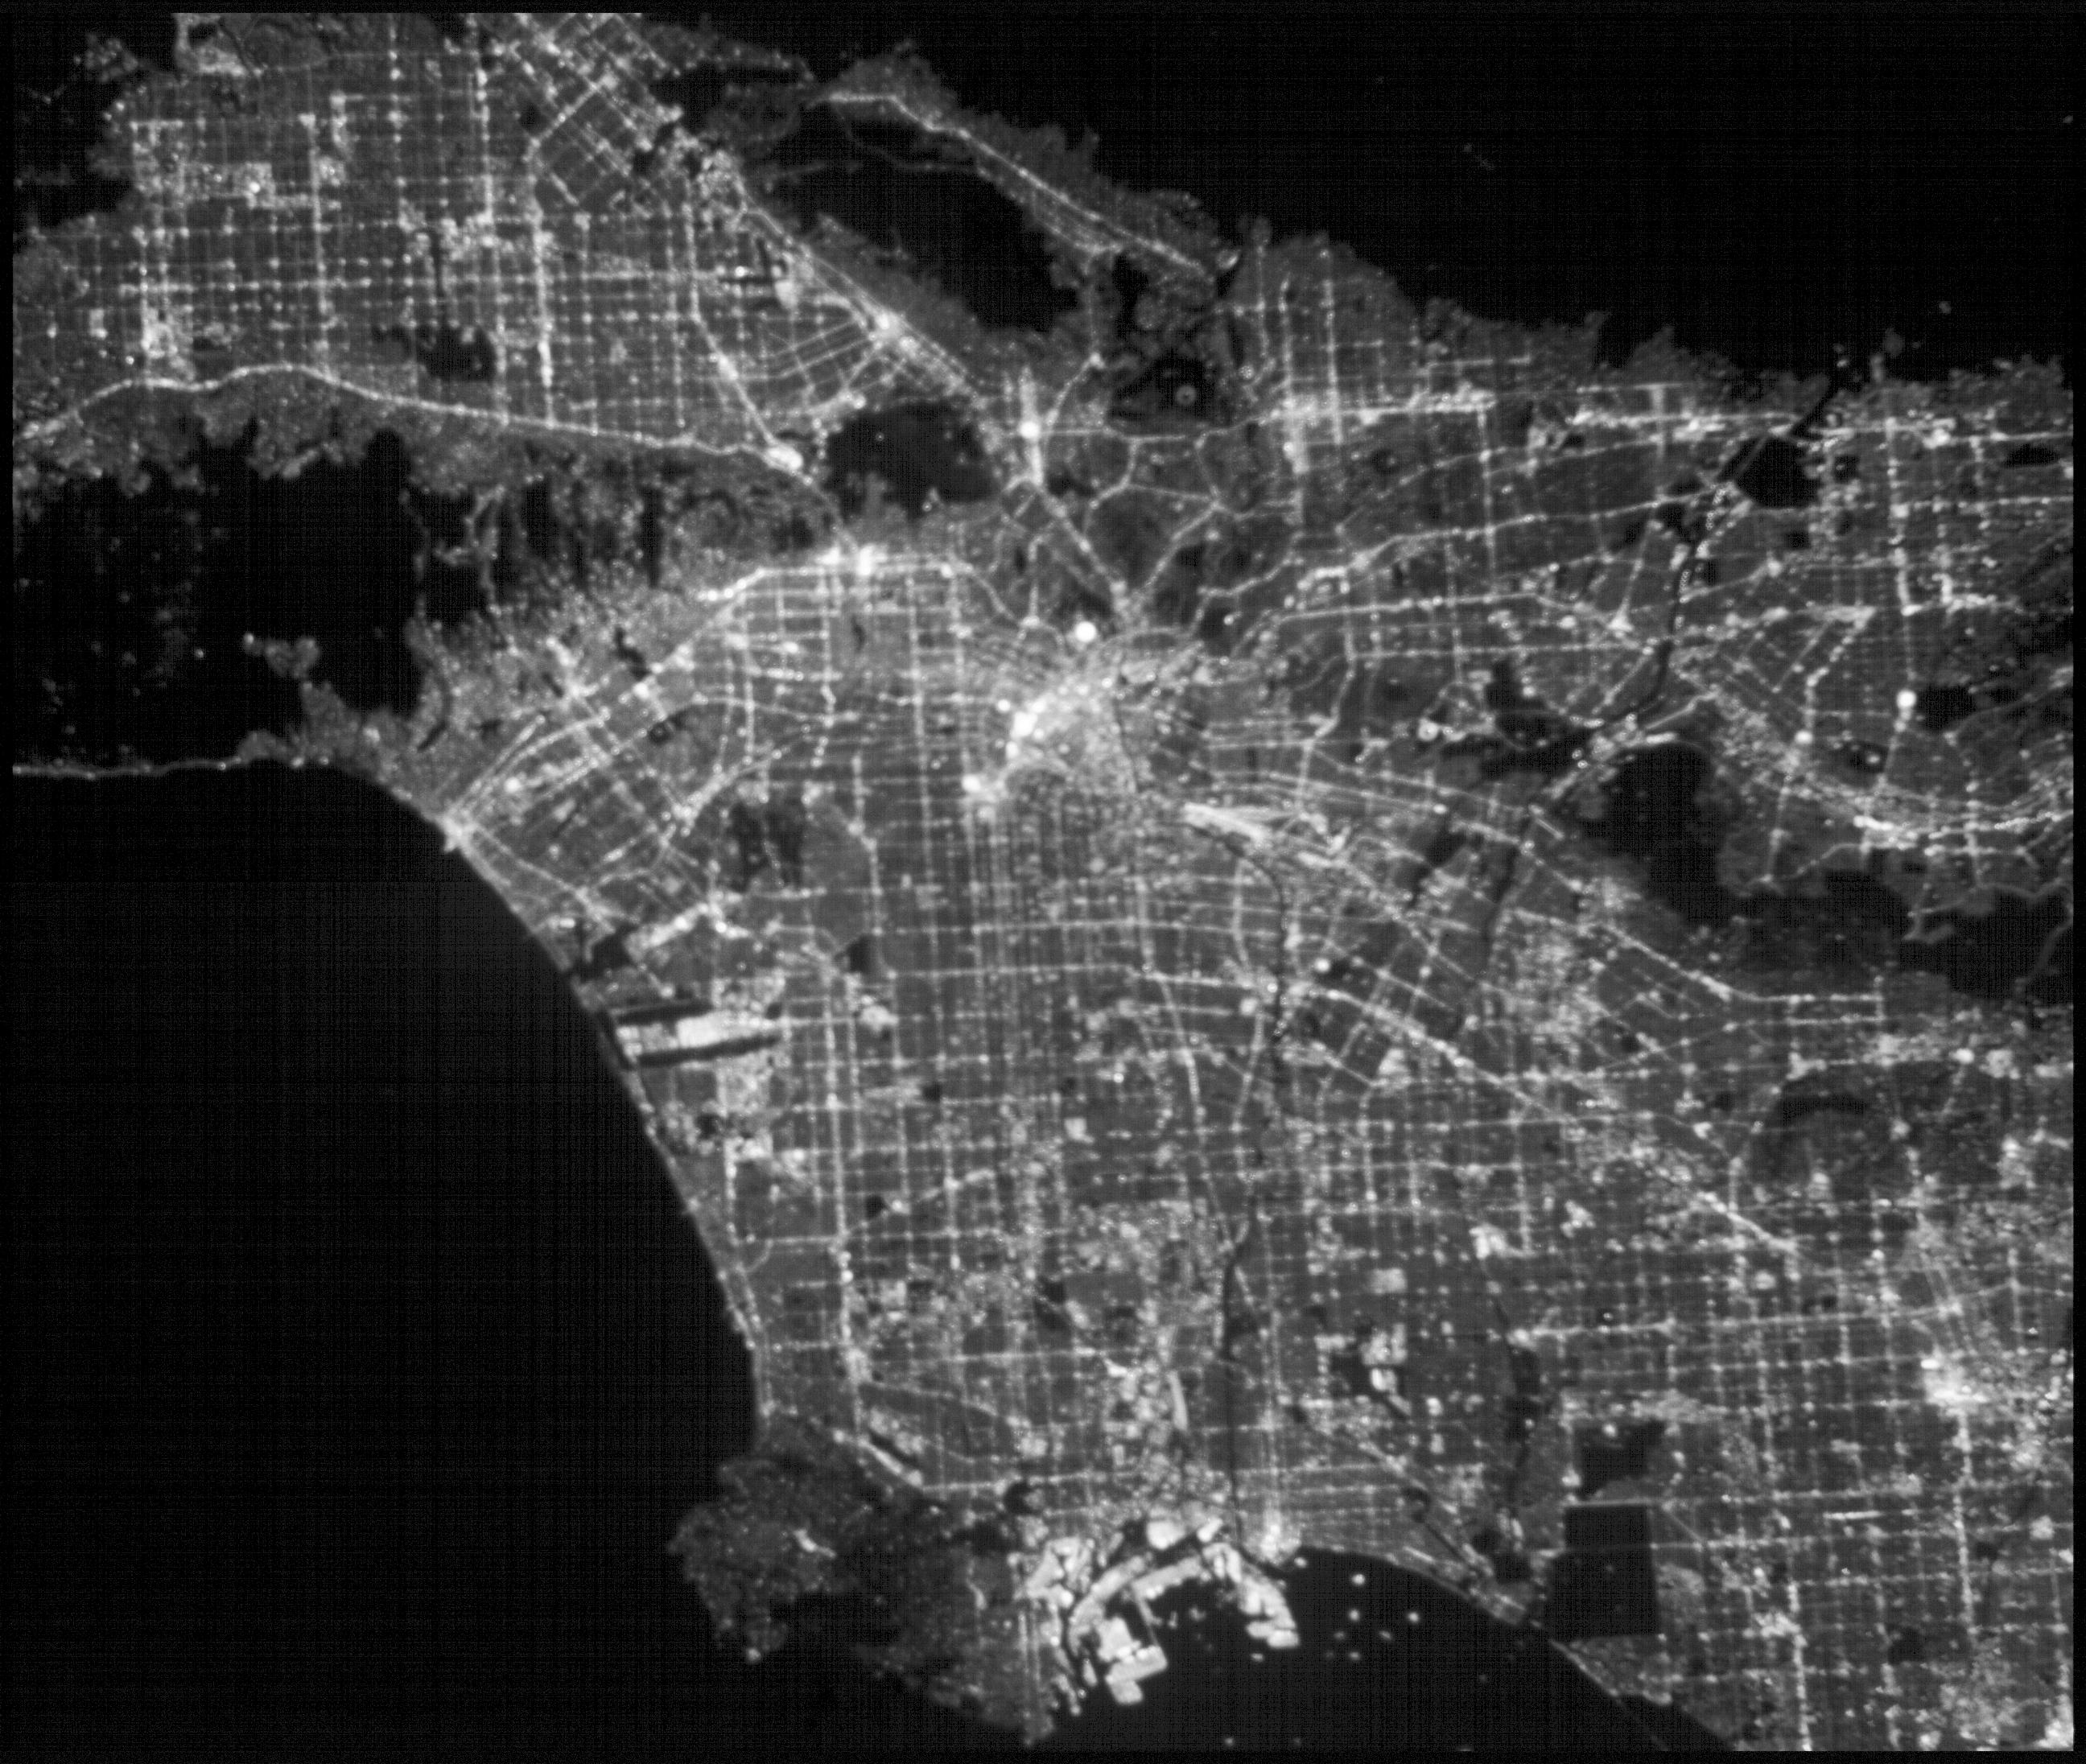
PIA22703:
-
NASA's ECOSTRESS Detects Surface Temperature Variations in Los Angeles
Full Resolution:
TIFF
(2.25 MB)
JPEG
(180.7 kB)
|
|
|
2018-09-20 |
Earth
|
CubeSat
|
|
790x787x3 |
|
-
PIA22652:
-
Hurricane Florence as Seen from a CubeSat

Full Resolution:
TIFF
(1.357 MB)
JPEG
(144.5 kB)
|
|
|
2018-09-25 |
Earth
|
CubeSat
|
|
478x318x3 |
|
-
PIA22653:
-
Mini Mission RainCube is Sent into Earth Orbit
Full Resolution:
TIFF
(330.8 kB)
JPEG
(210.5 kB)
|
|
|
2018-09-25 |
Earth
|
CubeSat
|
|
1280x434x3 |
|
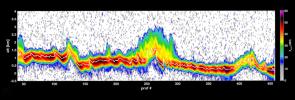
-
PIA22654:
-
RainCube Collects First Storm Data
Full Resolution:
TIFF
(759.9 kB)
JPEG
(106.9 kB)
|
|
|
2018-10-09 |
Earth
|
SMAP
|
|
792x612x3 |
|
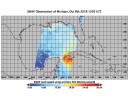
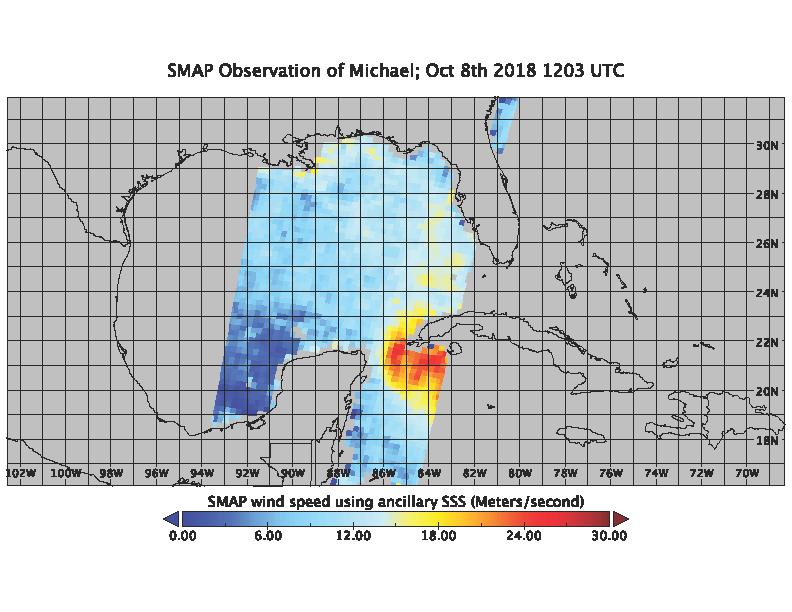
-
PIA22747:
-
SMAP Captures Hurricane Michael
Full Resolution:
TIFF
(209 kB)
JPEG
(89.97 kB)
|
|
|
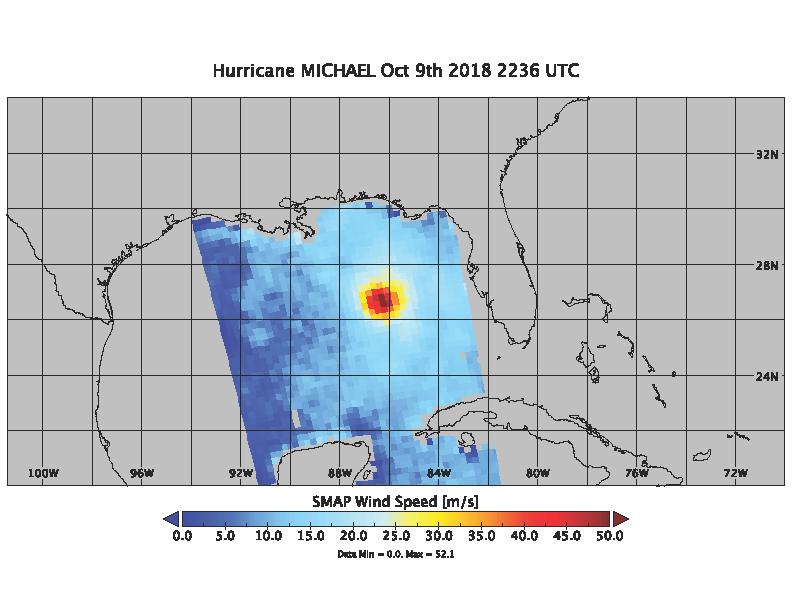
2018-10-10 |
Earth
|
SMAP
|
|
792x612x3 |

|
-
PIA22751:
-
Hurricane Michael as seen by SMAP
Full Resolution:
TIFF
(202.1 kB)
JPEG
(62.84 kB)
|
|
|
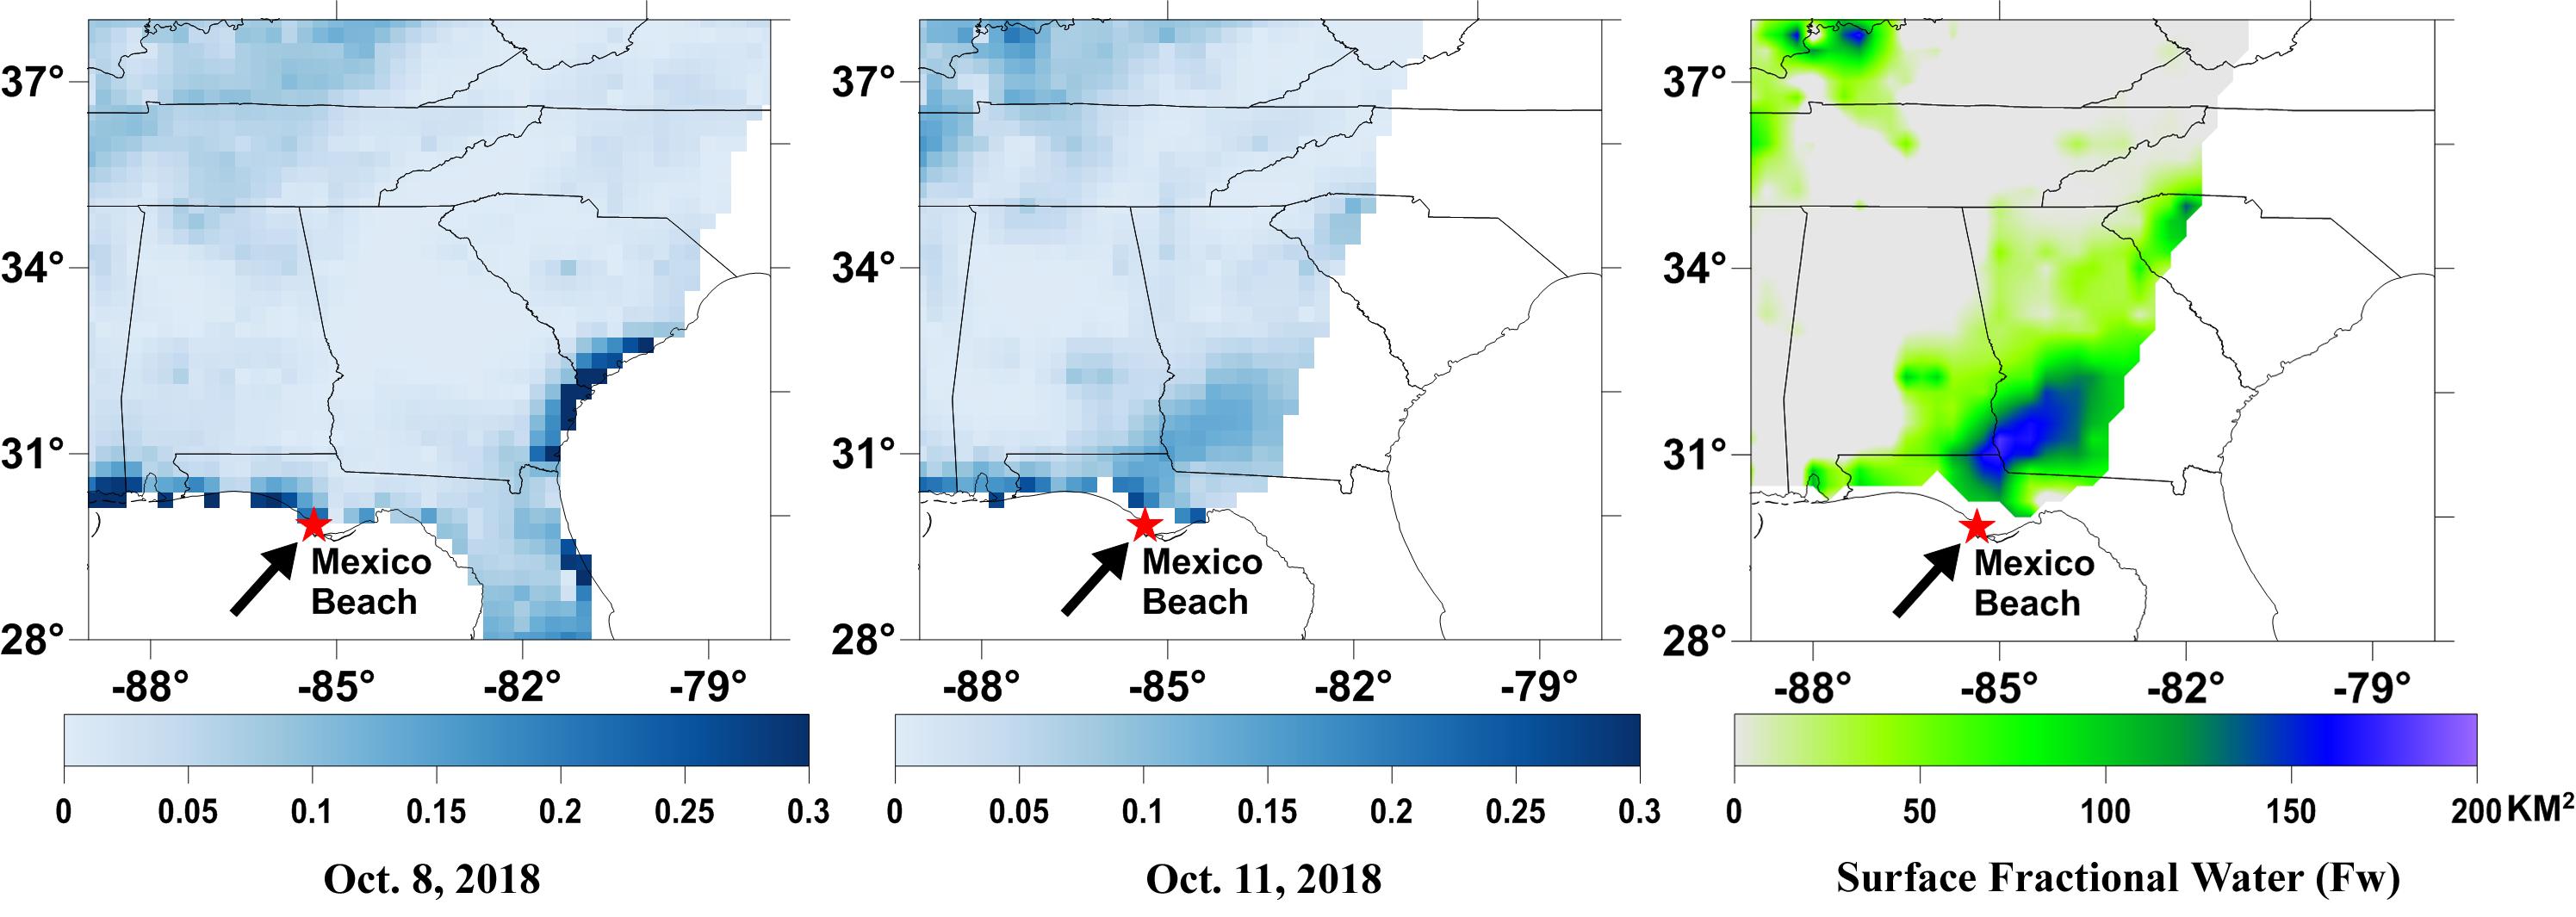
2018-10-11 |
Earth
|
SMAP
|
|
2991x1065x3 |
|
-
PIA22754:
-
NASA's SMAP Detects Flooding from Hurricane Michael
Full Resolution:
TIFF
(1.747 MB)
JPEG
(255.8 kB)
|
|
|
2019-05-13 |
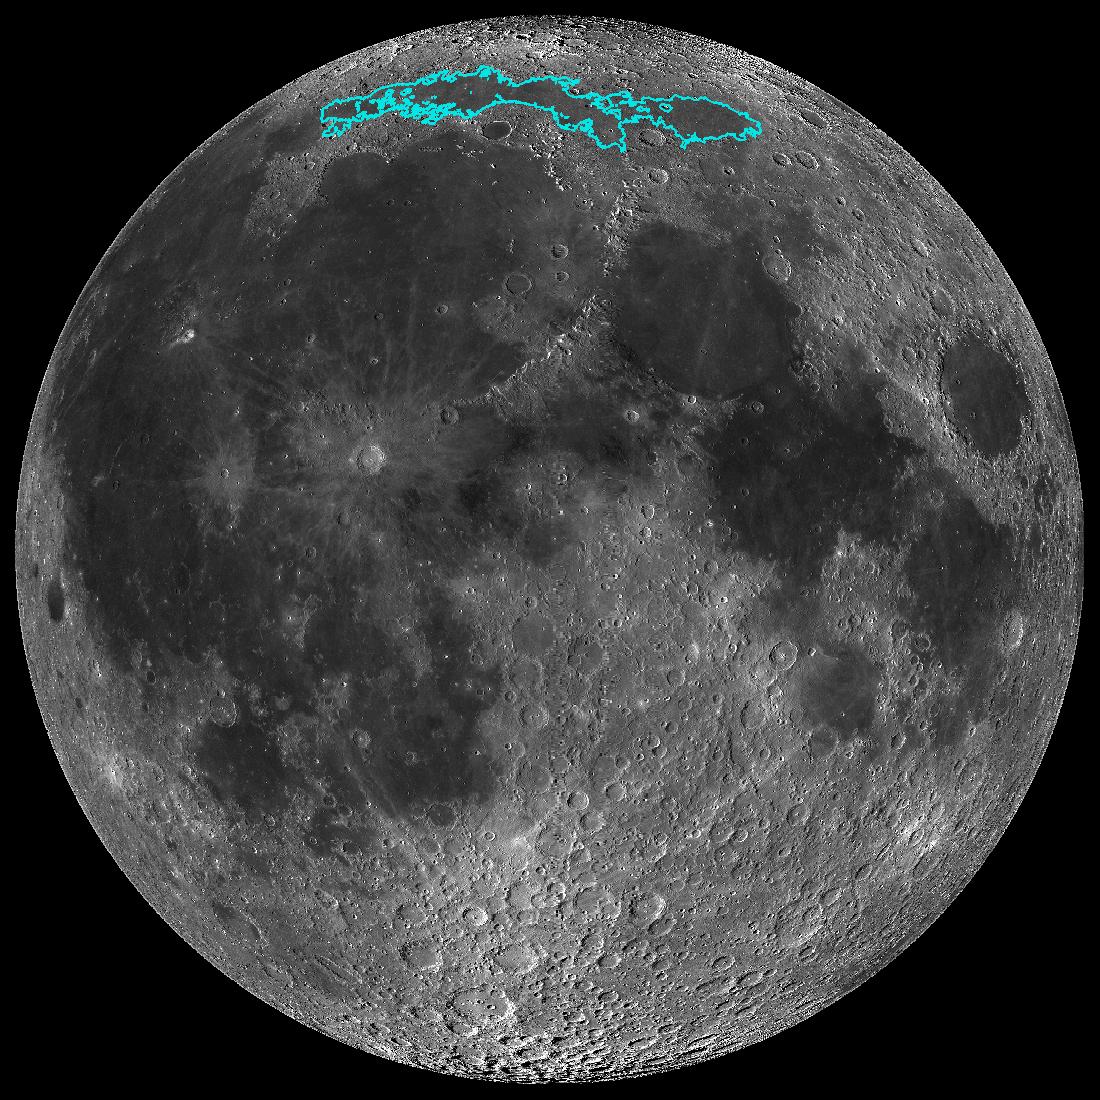
Moon
|
Lunar Reconnaissance Orbiter (LRO)
|
|
1100x1100x3 |
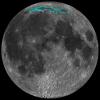
|
-
PIA23209:
-
The Moon's Mare Frigoris
Full Resolution:
TIFF
(1.288 MB)
JPEG
(268 kB)
|
|
|
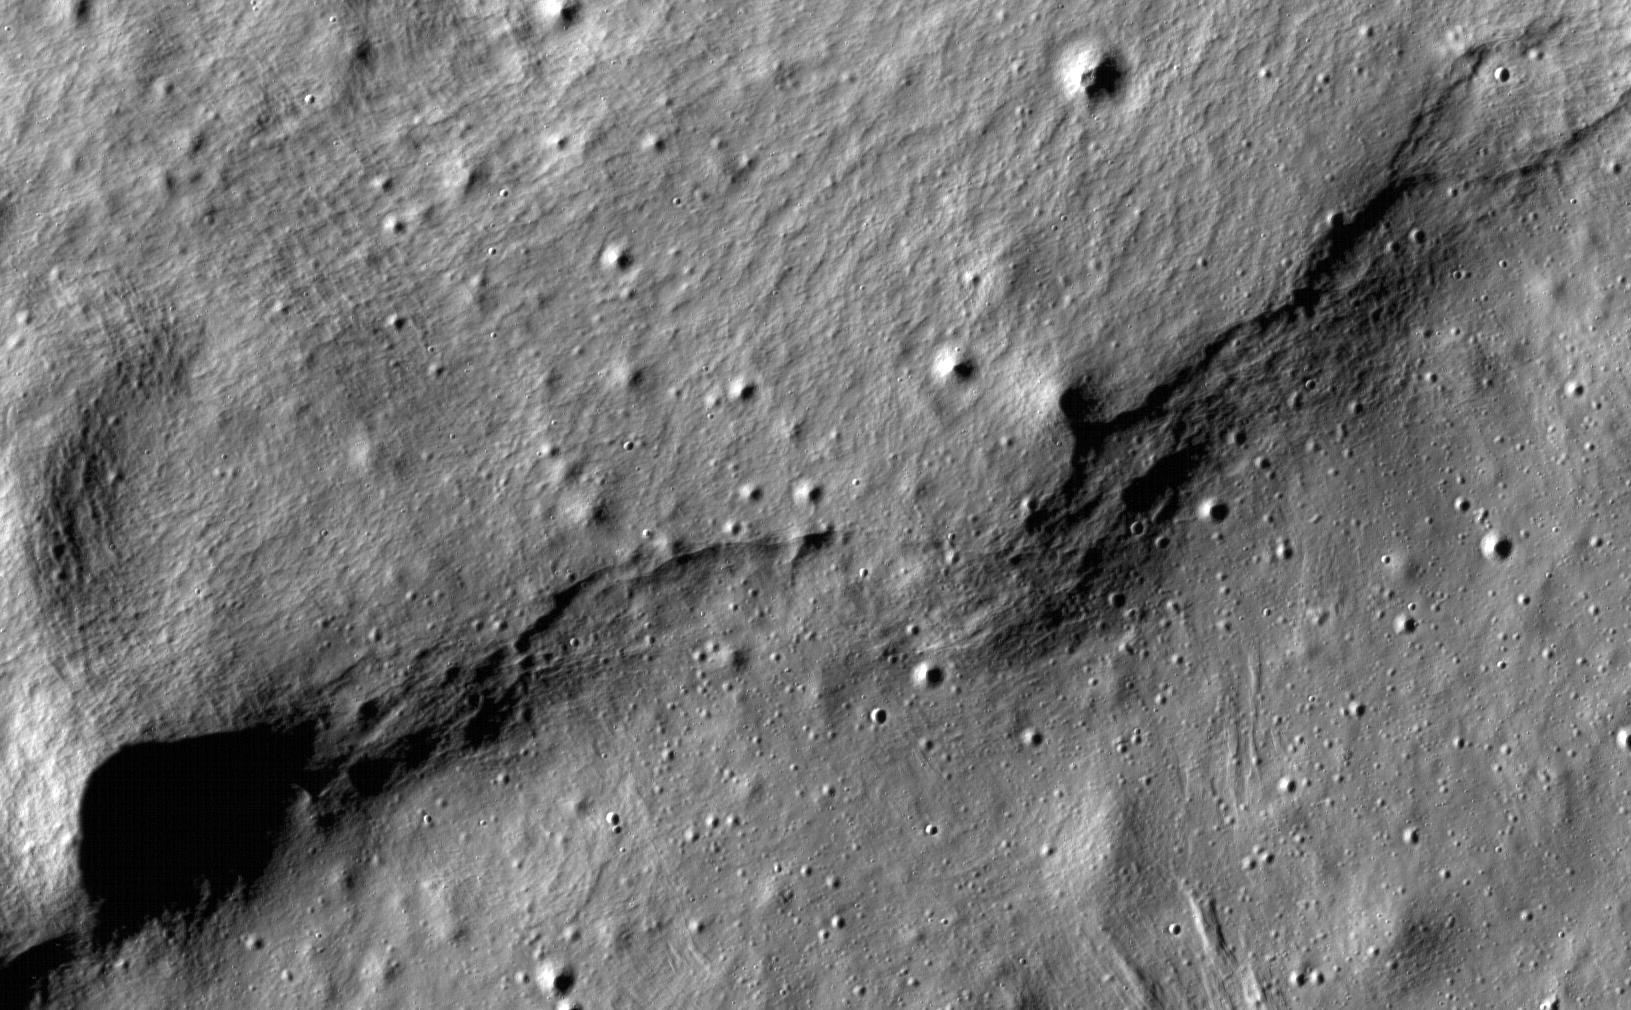
2019-05-13 |
Moon
|
Lunar Reconnaissance Orbiter (LRO)
|
|
1407x1009x1 |
|
-
PIA23210:
-
Wrinkle Ridges on the Moon
Full Resolution:
TIFF
(1.421 MB)
JPEG
(195.6 kB)
|
|
|
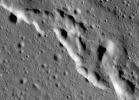
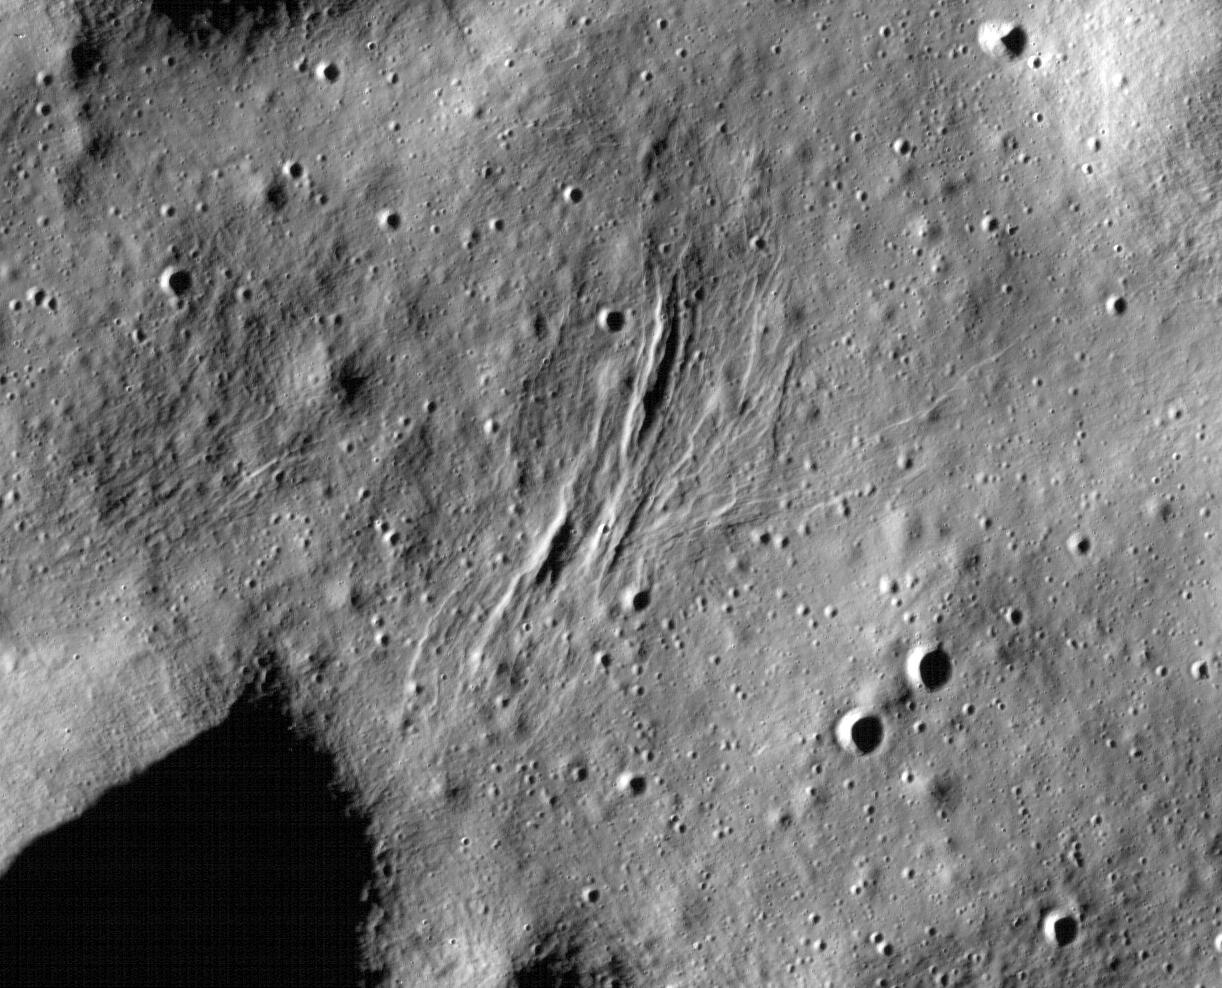
2019-05-13 |
Moon
|
Lunar Reconnaissance Orbiter (LRO)
|
|
1631x1010x1 |

|
-
PIA23236:
-
Lobate Scarps on the Moon
Full Resolution:
TIFF
(1.649 MB)
JPEG
(267.7 kB)
|
|
|
2019-05-13 |
Moon
|
Lunar Reconnaissance Orbiter (LRO)
|
|
1222x988x1 |

|
-
PIA23237:
-
Graben on the Moon
Full Resolution:
TIFF
(1.209 MB)
JPEG
(200.8 kB)
|
|
|
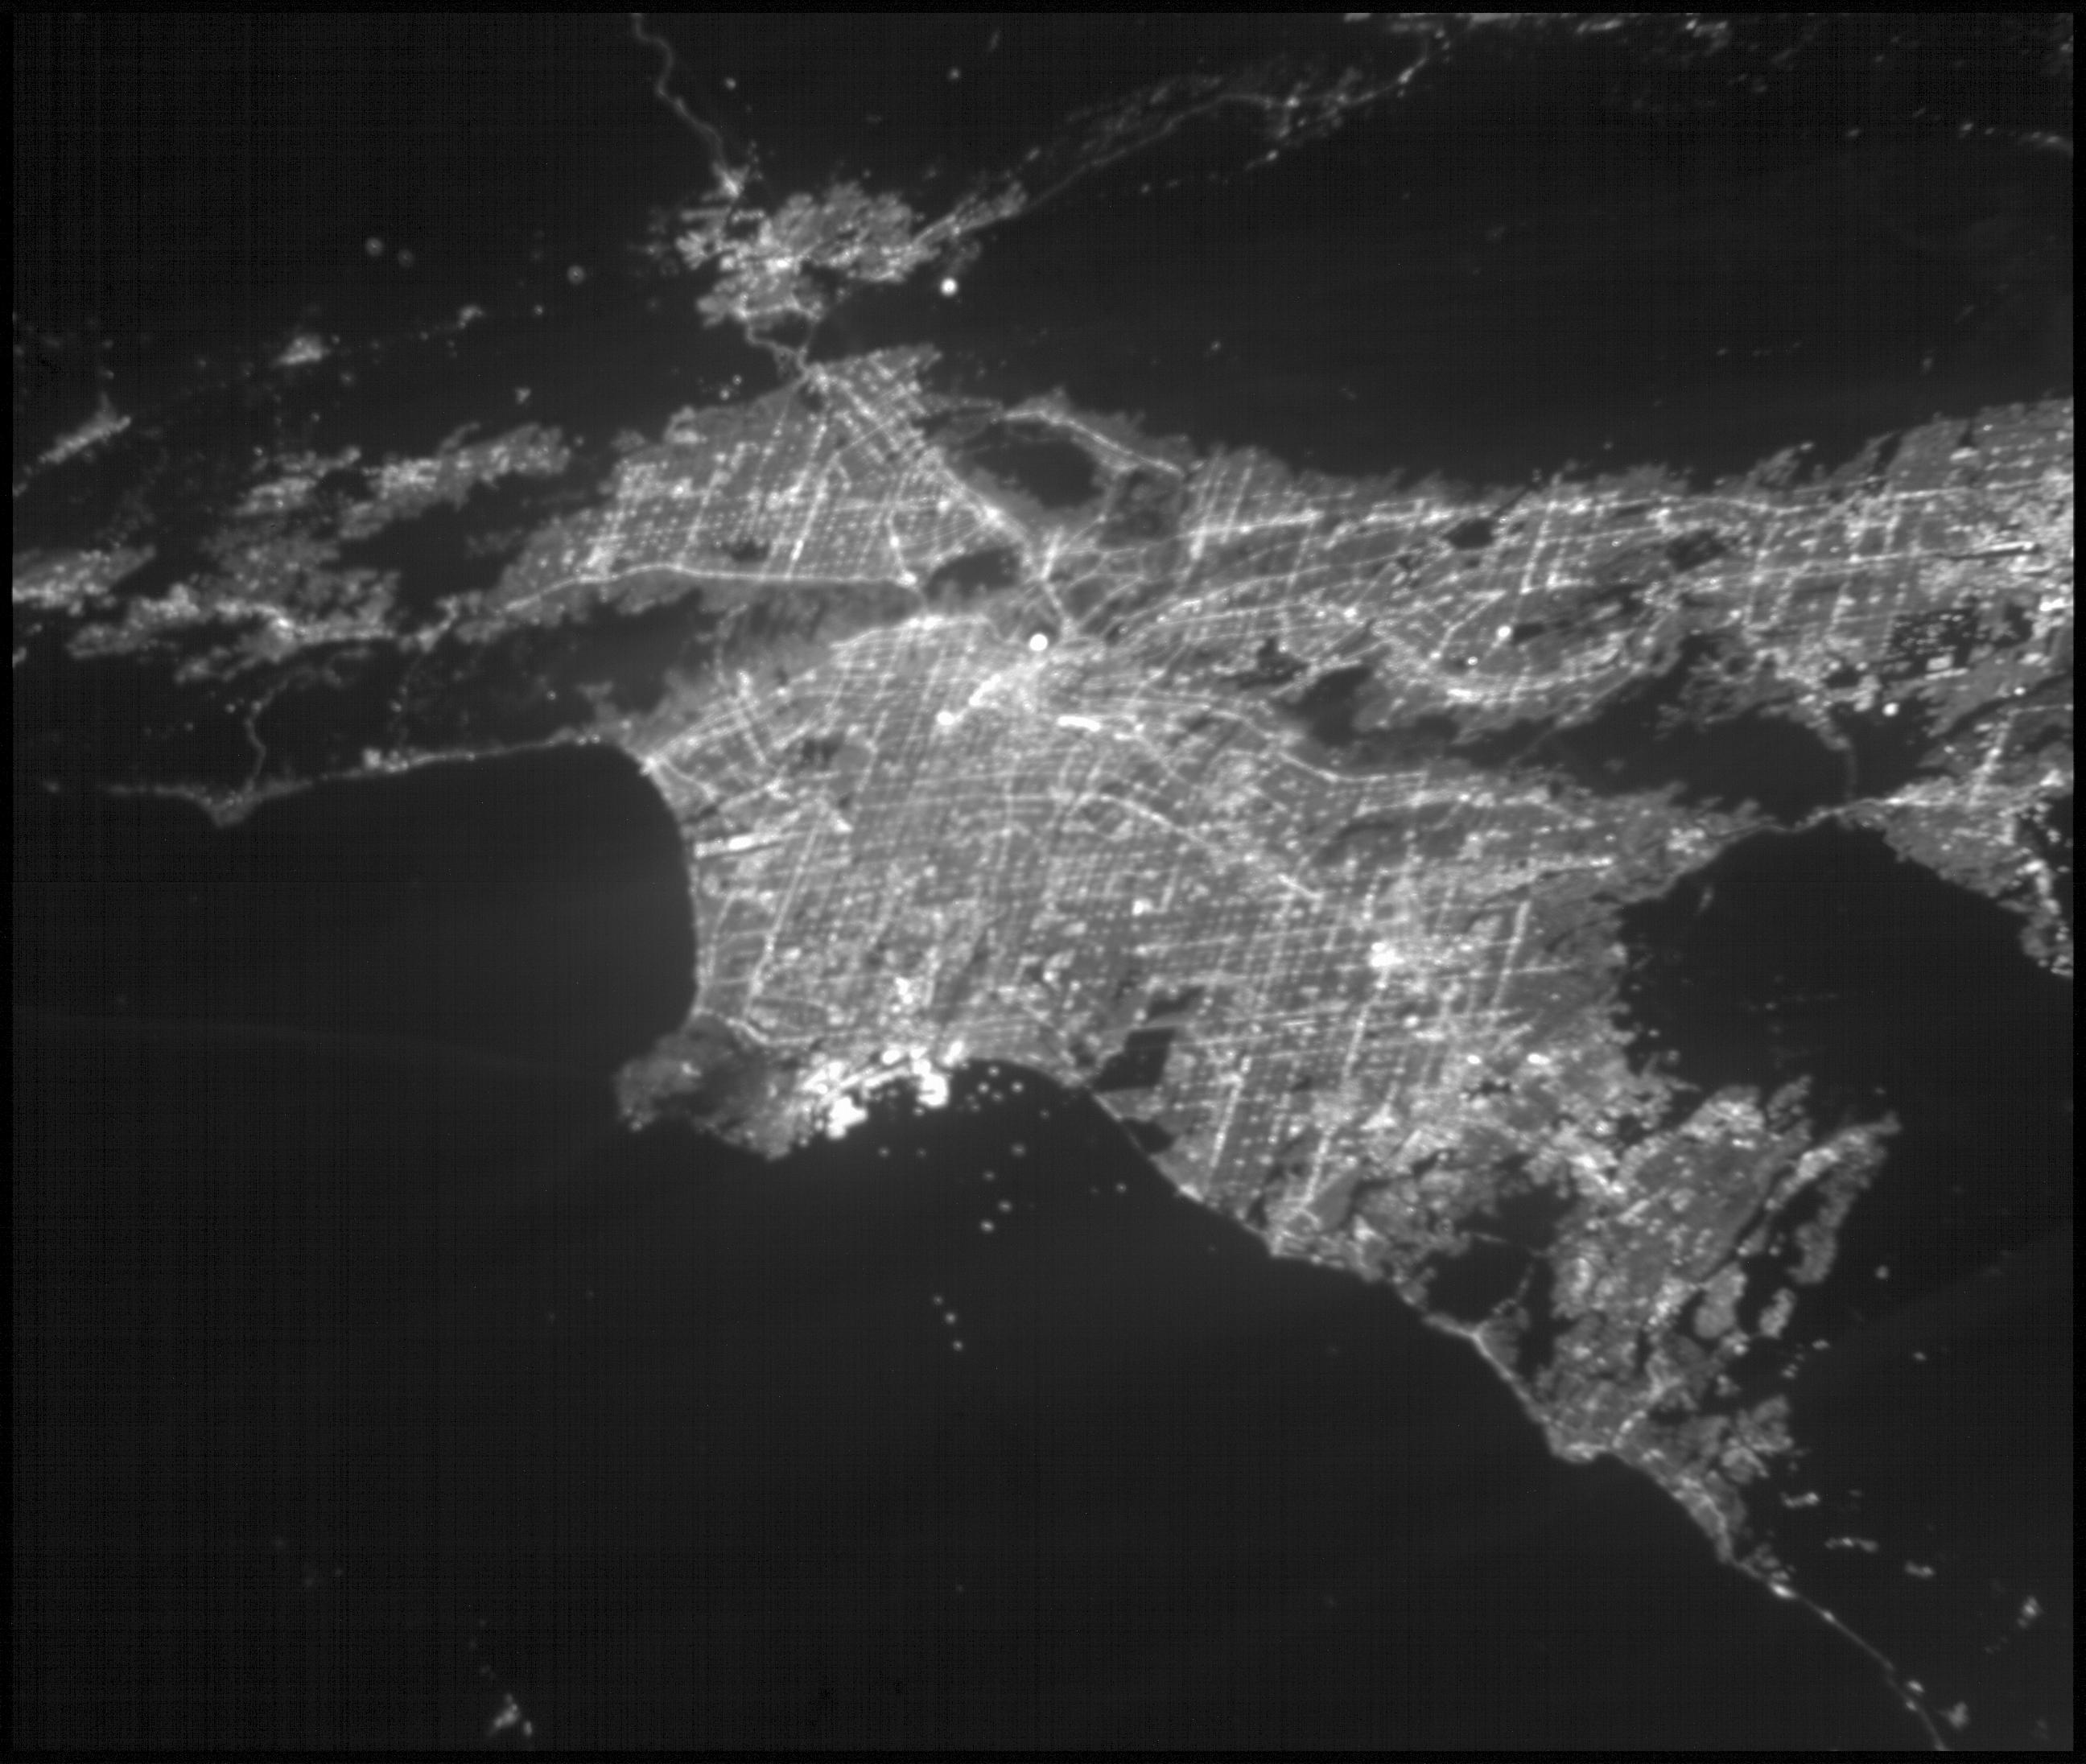
2019-05-16 |
Earth
|
CubeSat
|
|
2592x2192x1 |
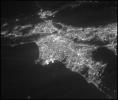
|
-
PIA23124:
-
ASTERIA Image of Los Angeles 1
Full Resolution:
TIFF
(4.729 MB)
JPEG
(440.4 kB)
|
|
|
2019-05-16 |
Earth
|
CubeSat
|
|
2592x2192x1 |
|
-
PIA23125:
-
ASTERIA Image of Los Angeles 2
Full Resolution:
TIFF
(4.963 MB)
JPEG
(831.4 kB)
|
|
|
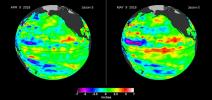
2019-05-17 |
Earth
|
SMAP
|
|
1400x787x3 |
|
-
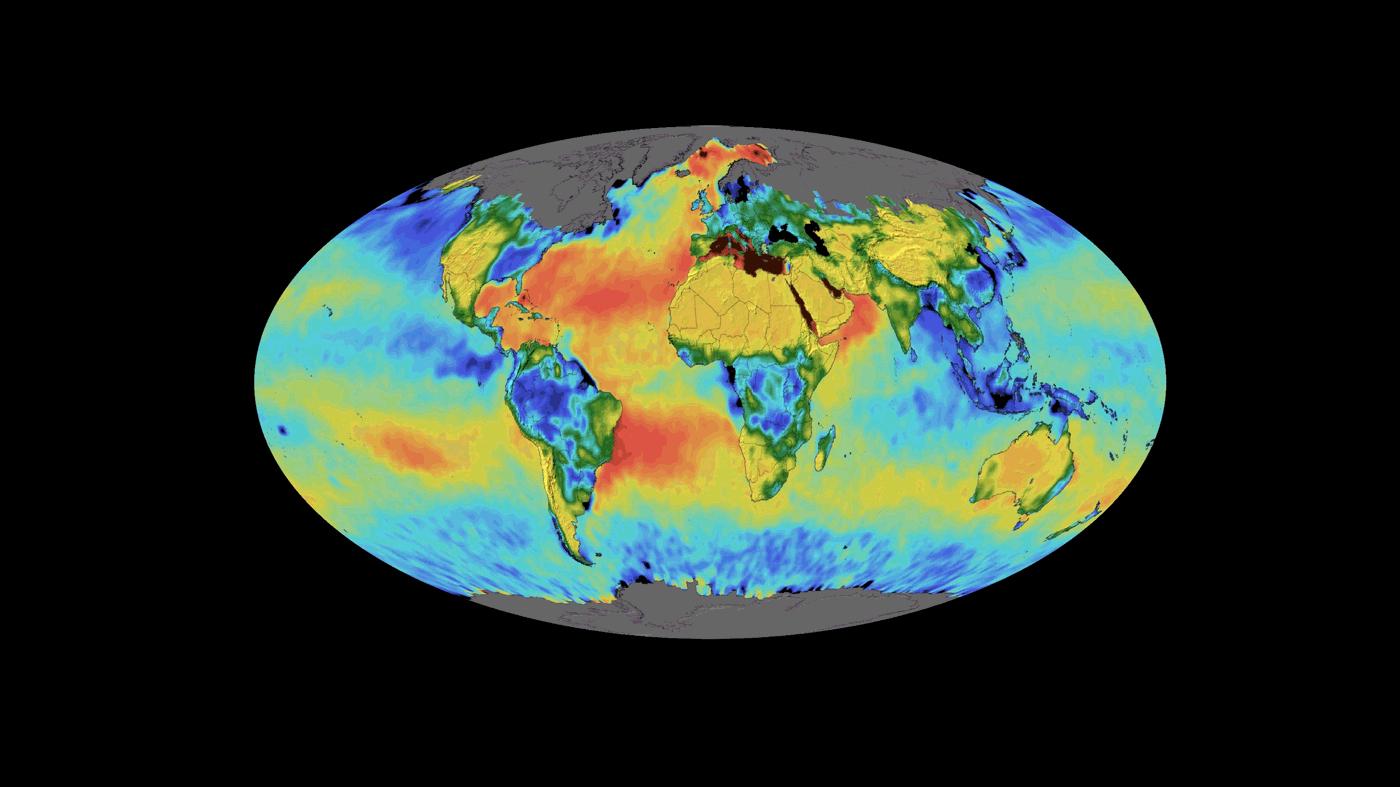
PIA23146:
-
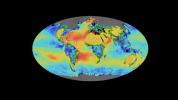
SMAP Sea Surface Salinity and Soil Moisture Time Lapse
Full Resolution:
TIFF
(1.025 MB)
JPEG
(82.57 kB)
|
|
|
2019-07-02 |
Earth
|
ECOSTRESS
|
|
2258x2190x3 |
|
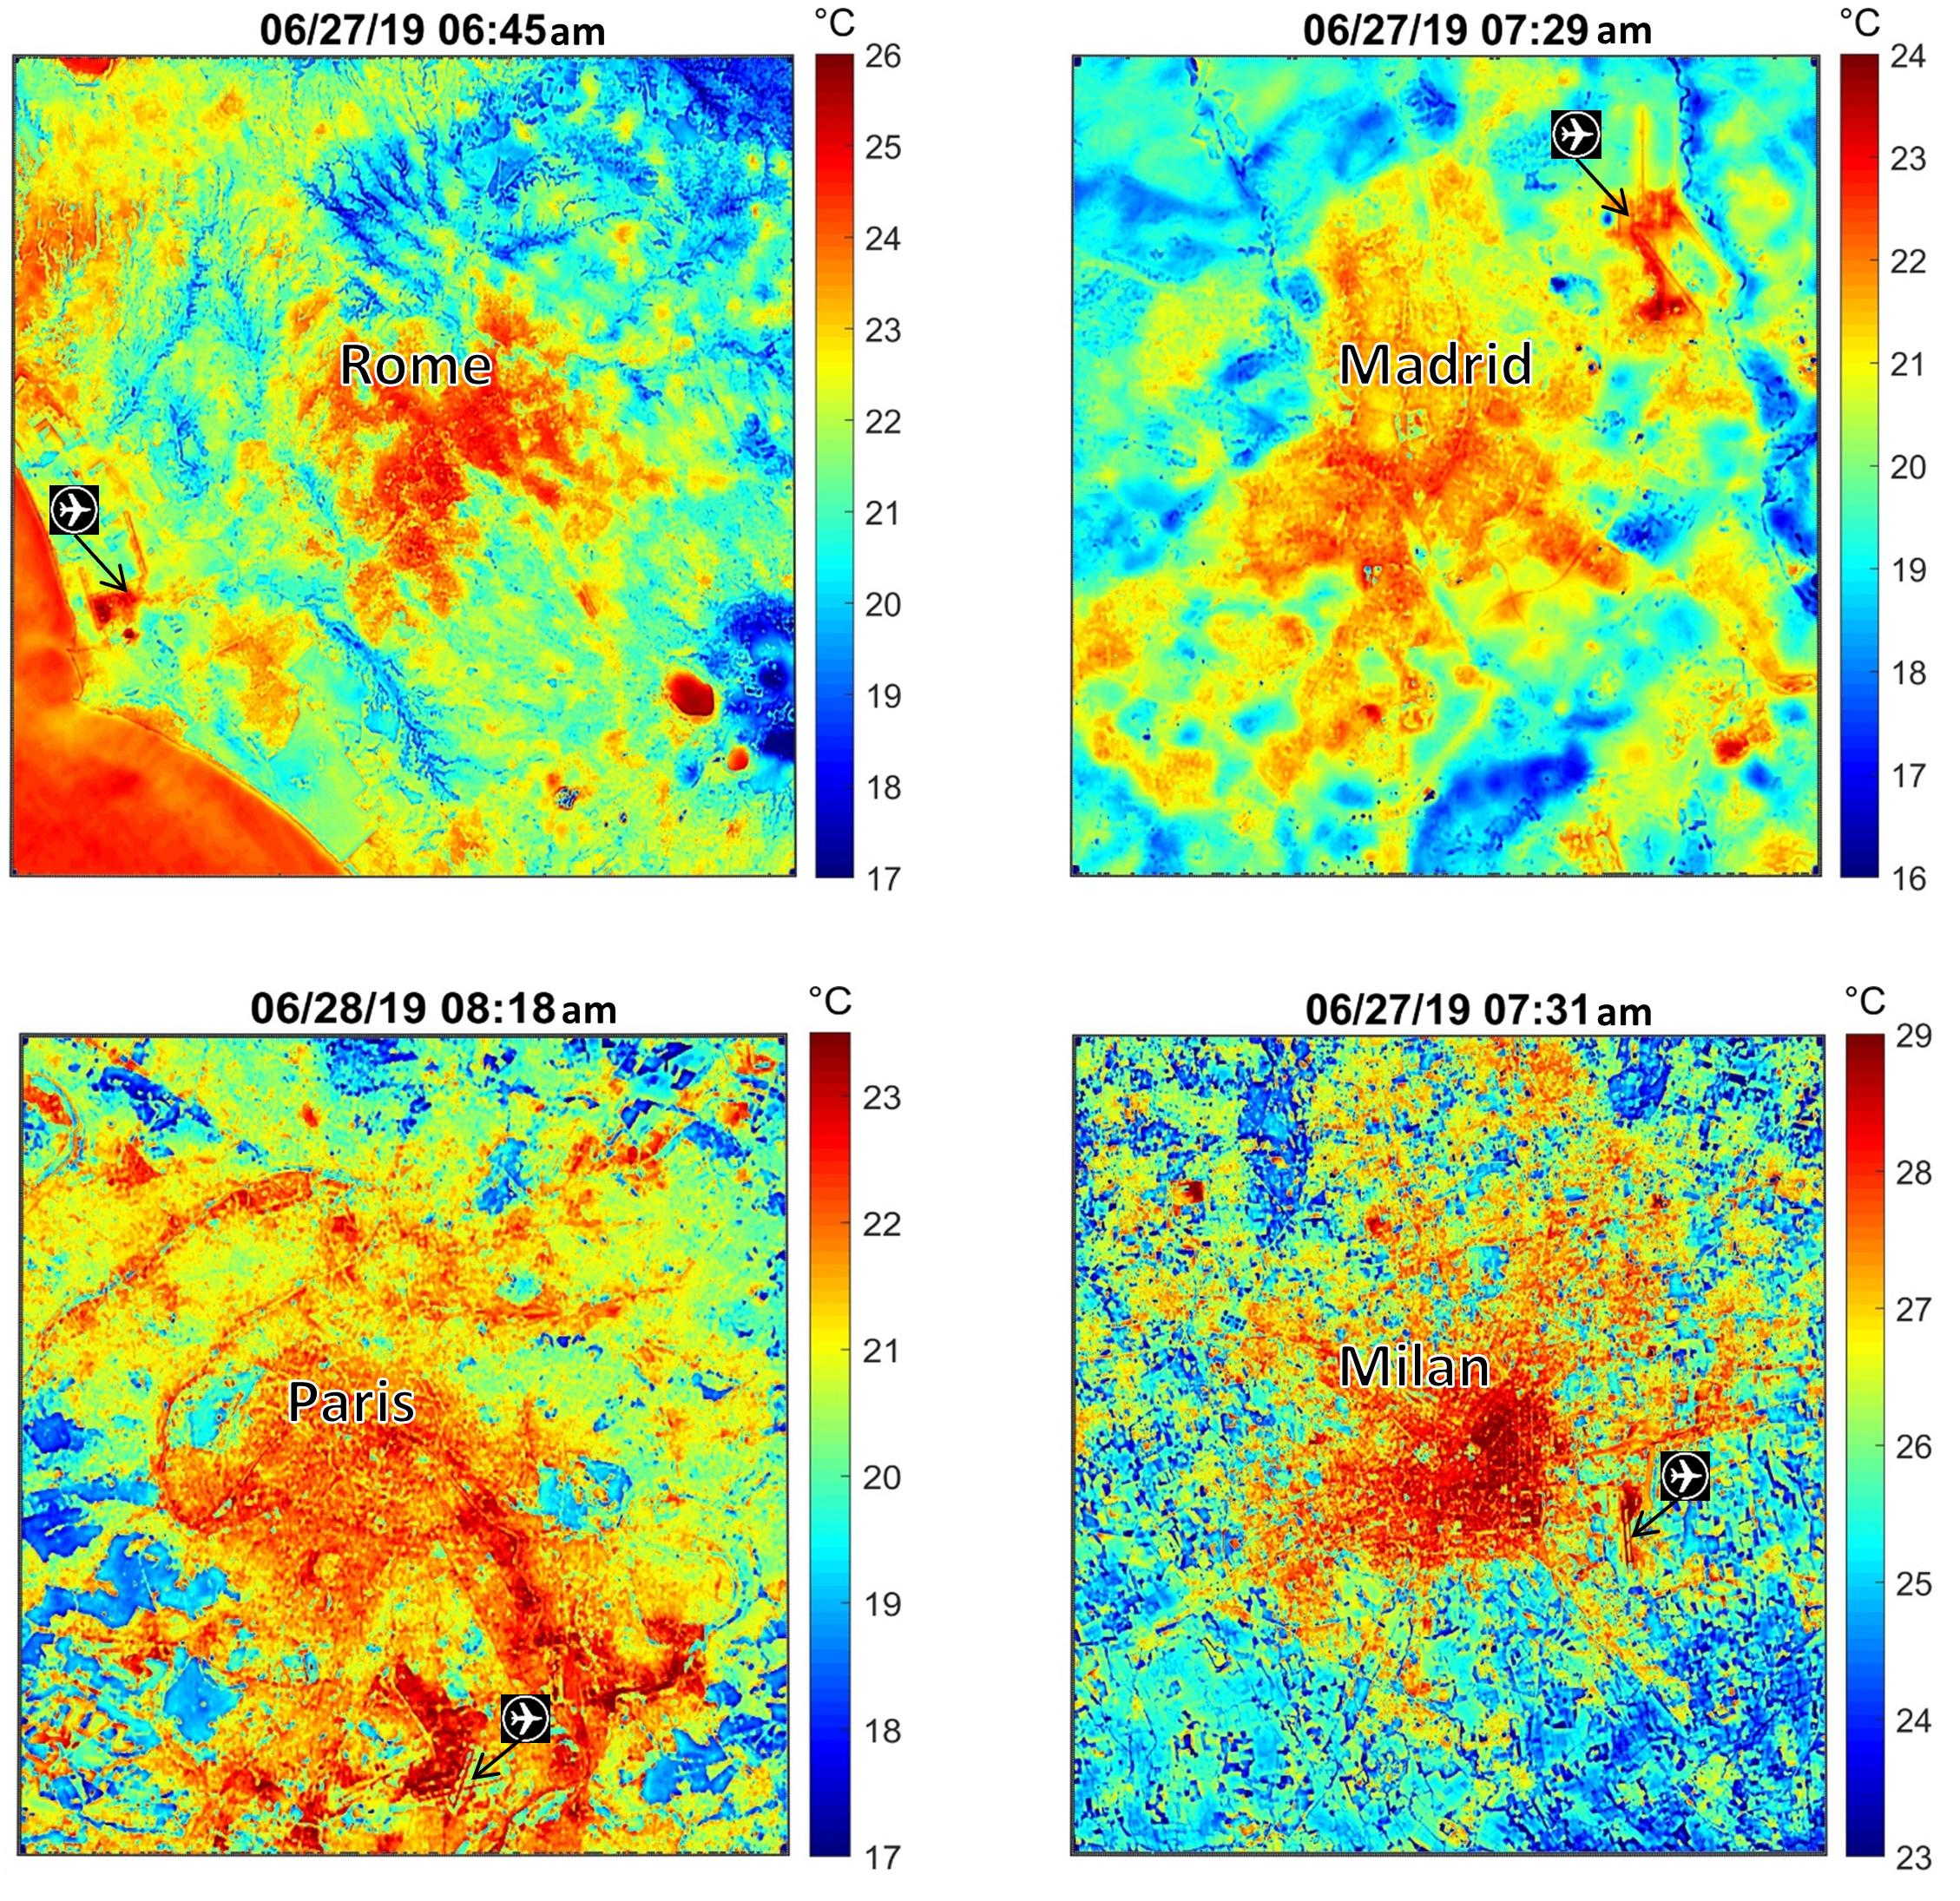
-
PIA23148:
-
NASA's ECOSTRESS Maps Europe Heat Wave
Full Resolution:
TIFF
(13.41 MB)
JPEG
(928.6 kB)
|
|
|
2019-07-11 |
Earth
|
ARIA
|
|
1754x1959x3 |
|
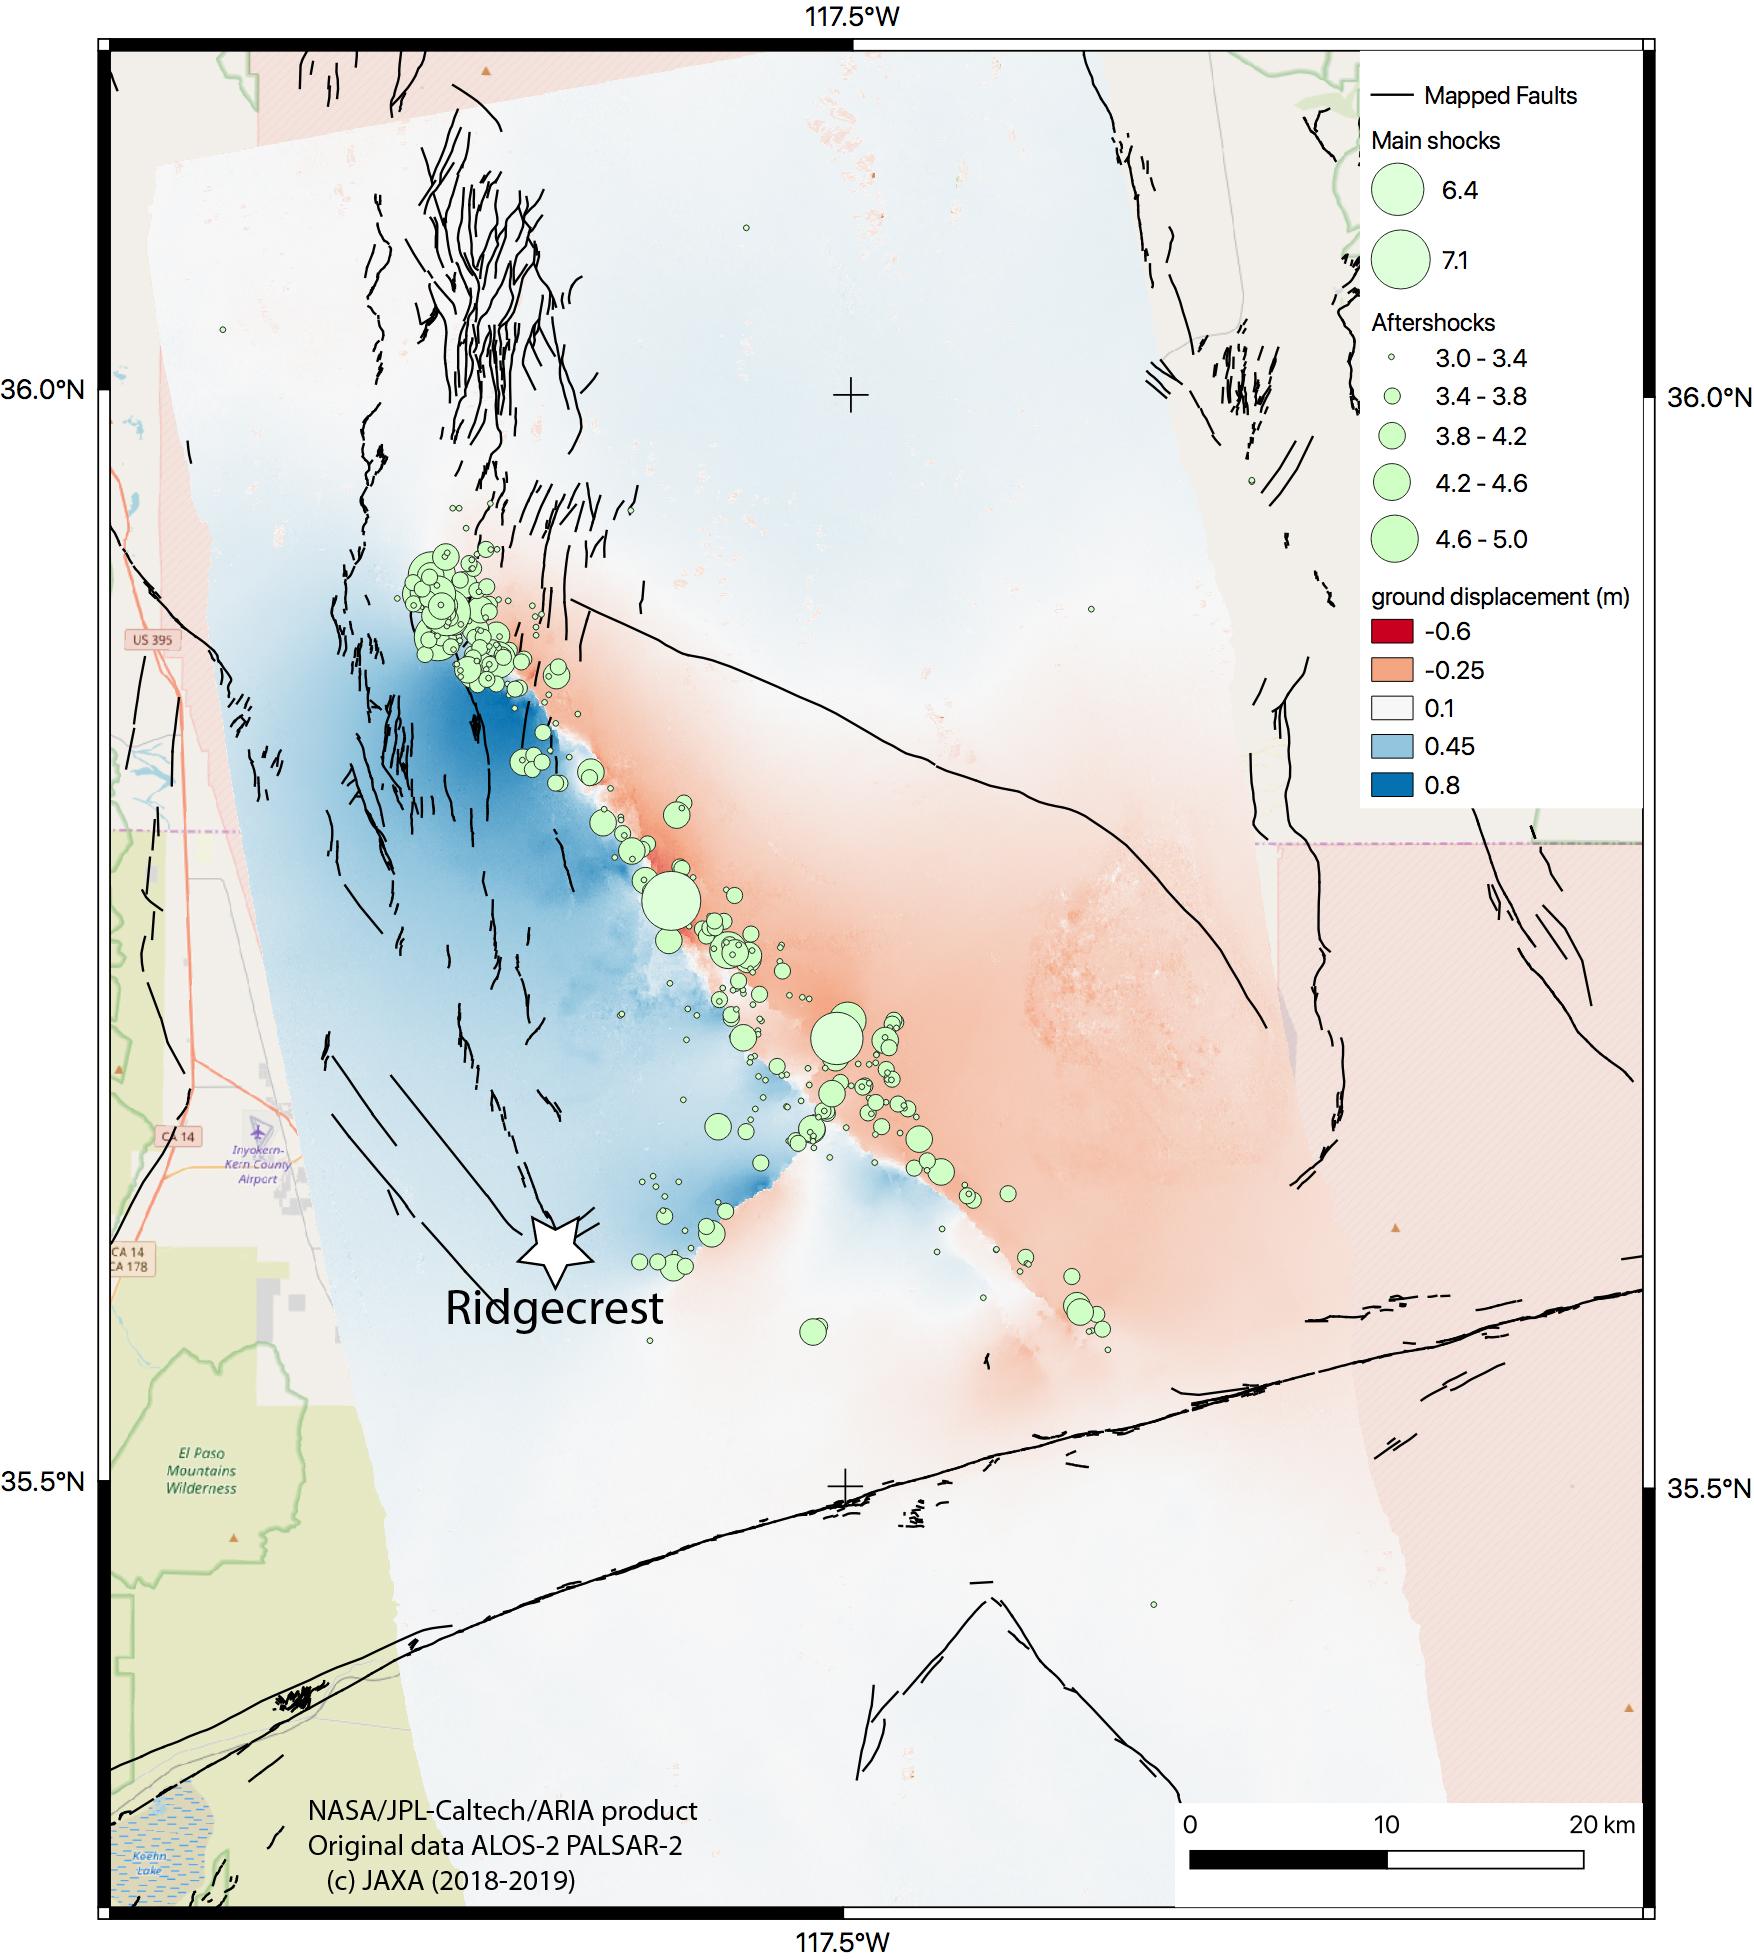
-
PIA23351:
-
NASA Map Shows Ground Movement from California Quakes
Full Resolution:
TIFF
(4.263 MB)
JPEG
(292.6 kB)
|
|
|
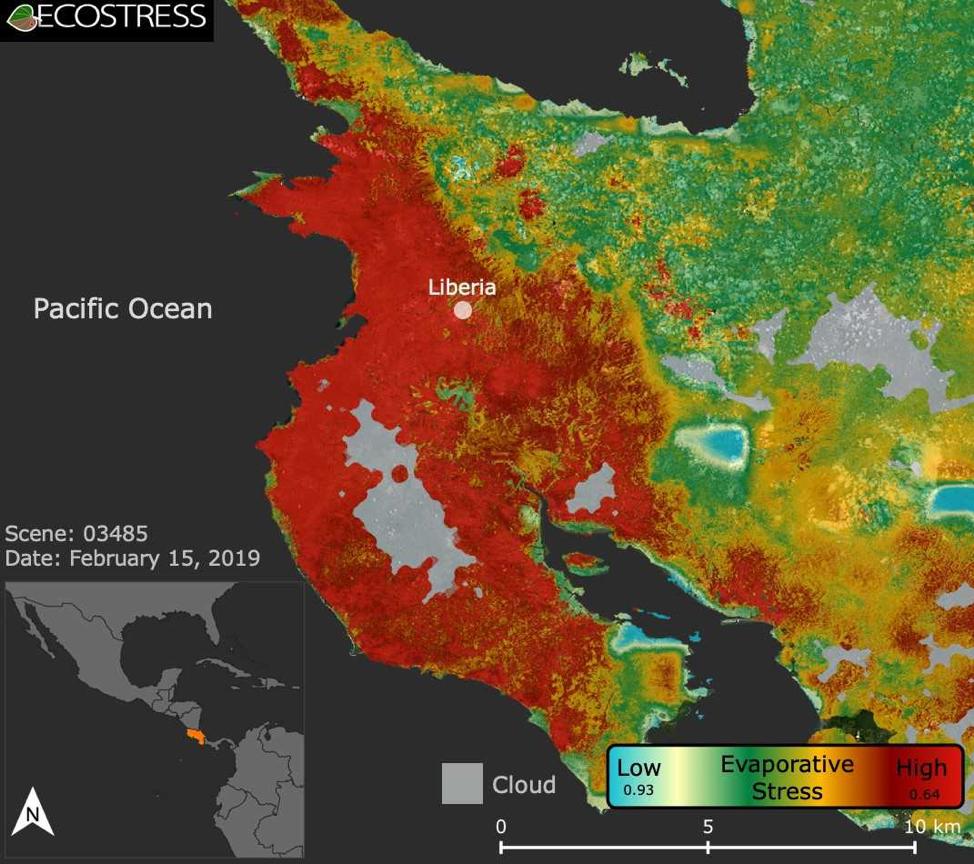
2019-08-08 |
Earth
|
ECOSTRESS
|
|
974x864x3 |
|
-
PIA22839:
-
ECOSTRESS Focuses on Costa Rican Drought
Full Resolution:
TIFF
(1.922 MB)
JPEG
(129.8 kB)
|
|
|
2019-08-29 |
Earth
|
CubeSat
|
|
1400x778x3 |
|
-
PIA23414:
-
Small Satellite TEMPEST-D Sees Hurricane Dorian off Coast
Full Resolution:
TIFF
(1.738 MB)
JPEG
(121.2 kB)
|
|
|
2019-09-04 |
Earth
|
CubeSat
|
|
1400x788x3 |
|
-
PIA23431:
-
TEMPEST-D CubeSat Sees Hurricane Dorian in 3D
Full Resolution:
TIFF
(1.581 MB)
JPEG
(105.9 kB)
|
|
|
2019-08-28 |
Earth
|
ECOSTRESS
|
|
1867x1132x3 |
|
-
PIA23357:
-
Amazon Fires Seen by NASA's ECOSTRESS
Full Resolution:
TIFF
(6.142 MB)
JPEG
(260.2 kB)
|
|
|
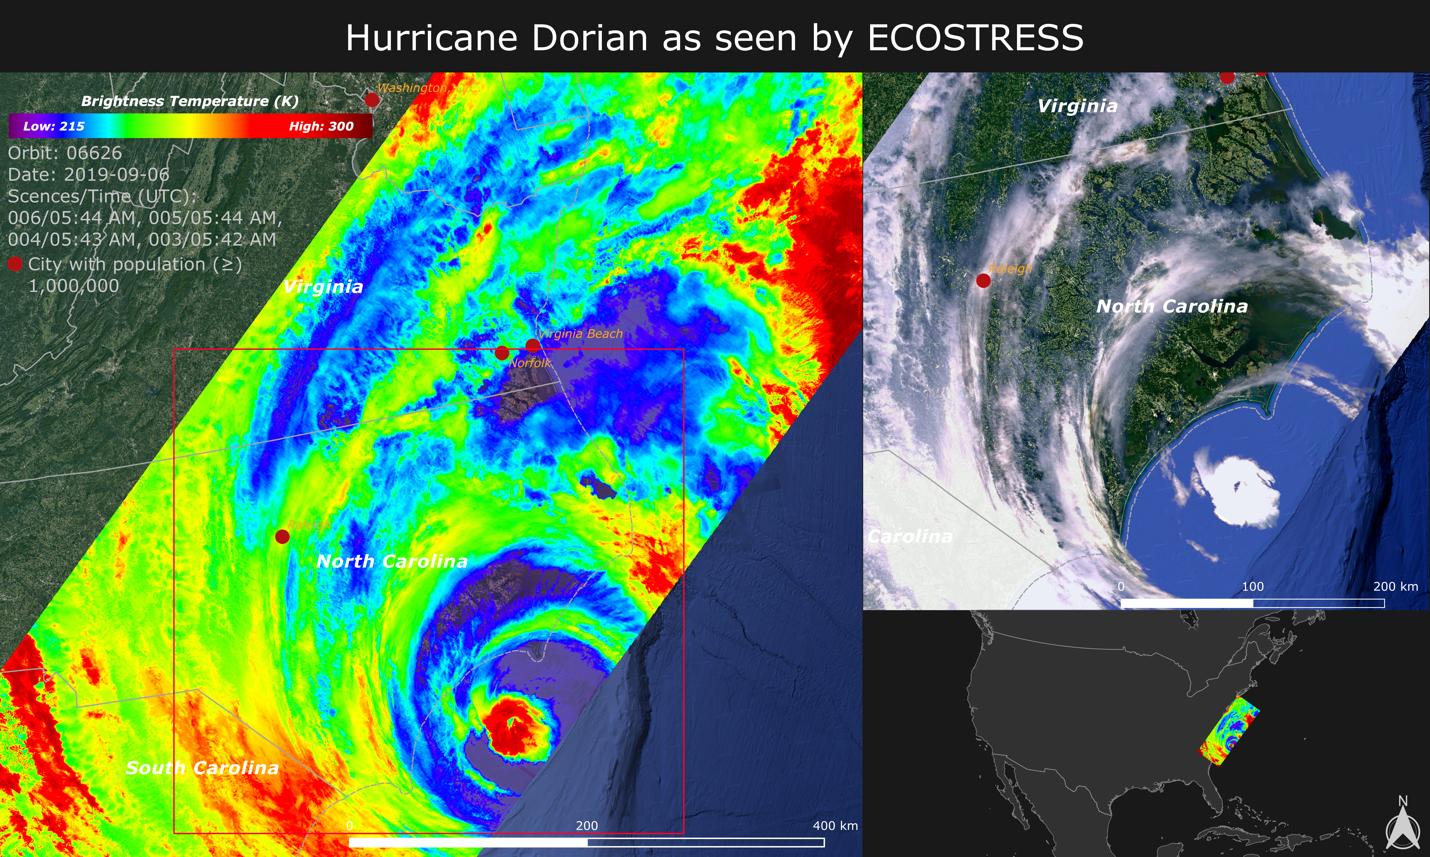
2019-09-18 |
Earth
|
ECOSTRESS
|
|
1430x857x3 |

|
-
PIA23422:
-
NASA Images Hurricane Dorian's Temperature from Space
Full Resolution:
TIFF
(3.196 MB)
JPEG
(252.8 kB)
|
|
|
2019-11-05 |
Earth
|
|
|
1440x960x3 |

|
-
PIA23425:
-
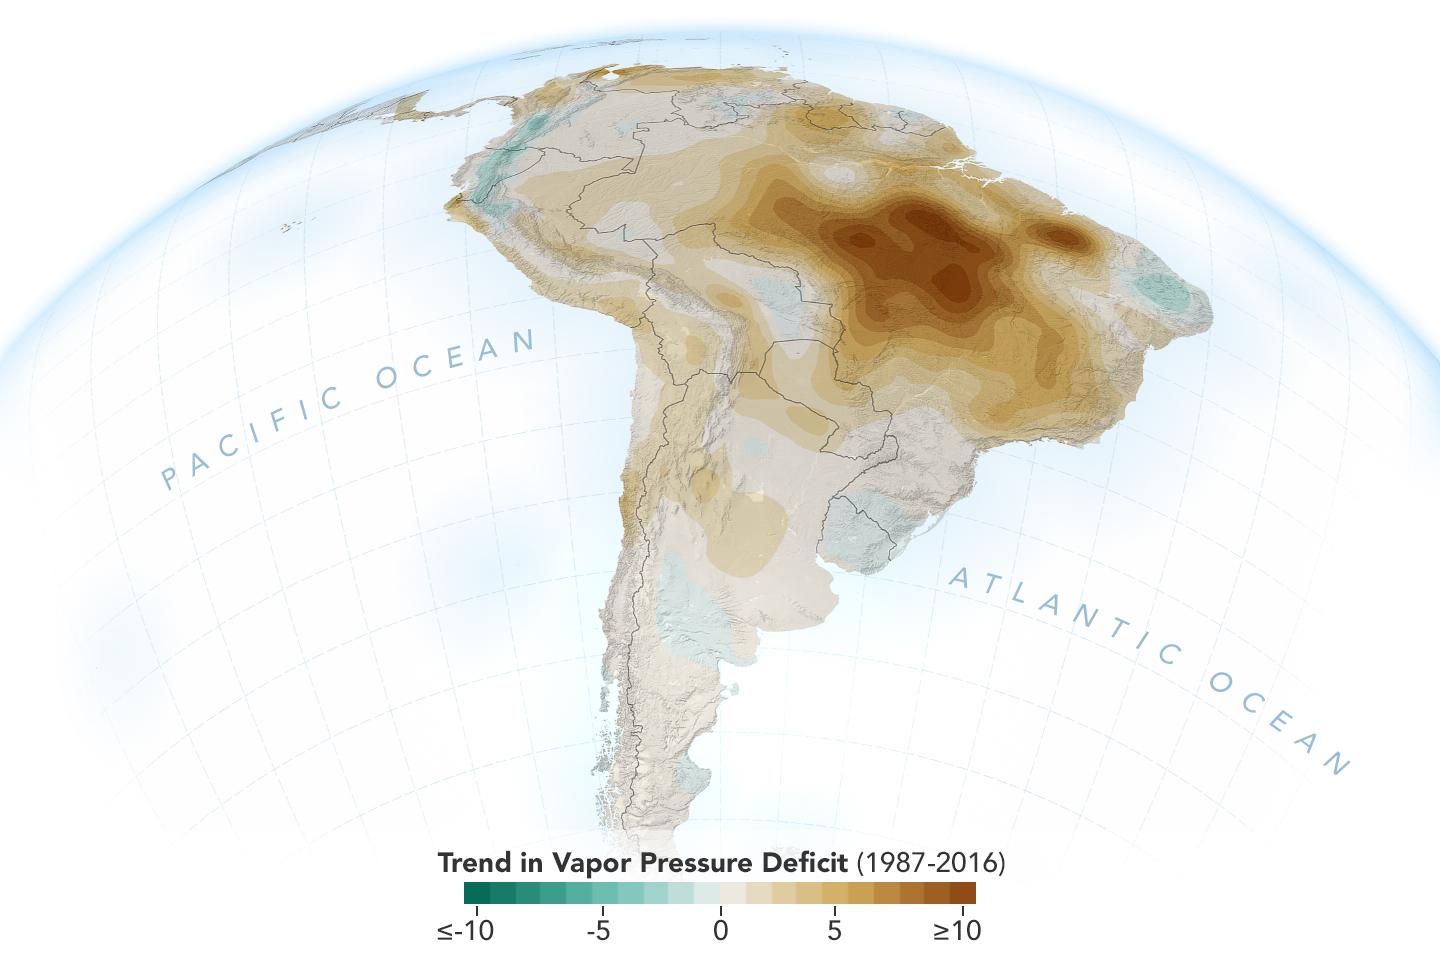
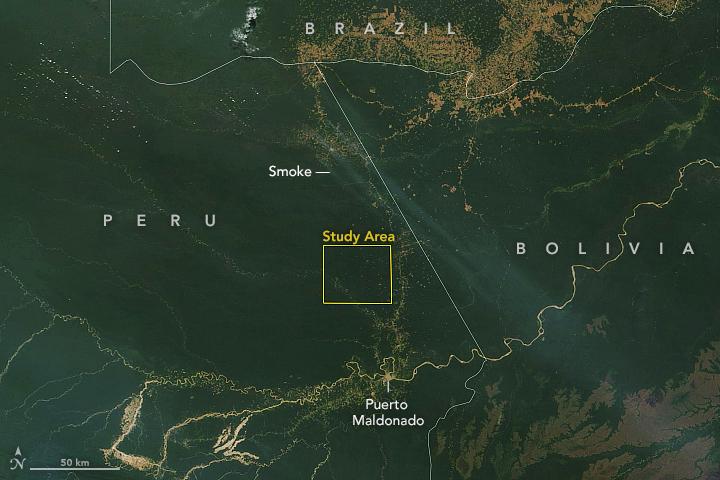
New Study Shows Atmosphere in the Amazon Drying Out
Full Resolution:
TIFF
(1.789 MB)
JPEG
(96.3 kB)
|
|
|
2019-11-05 |
Earth
|
ECOSTRESS
|
|
720x715x3 |
|
-
PIA23432:
-
Drought-Stressed Forest Fueled Amazon Fires
Full Resolution:
TIFF
(1.545 MB)
JPEG
(112.1 kB)
|
|
|
2019-11-05 |
Earth
|
Terra
|
|
720x480x3 |
|
-
PIA23546:
-
NASA Terra Satellite Sees Amazon Fires in Peru
Full Resolution:
TIFF
(855.7 kB)
JPEG
(51.57 kB)
|
|
|
2019-11-15 |
Earth
|
Mars 2020 Rover
|
|
4032x3024x3 |

|
-
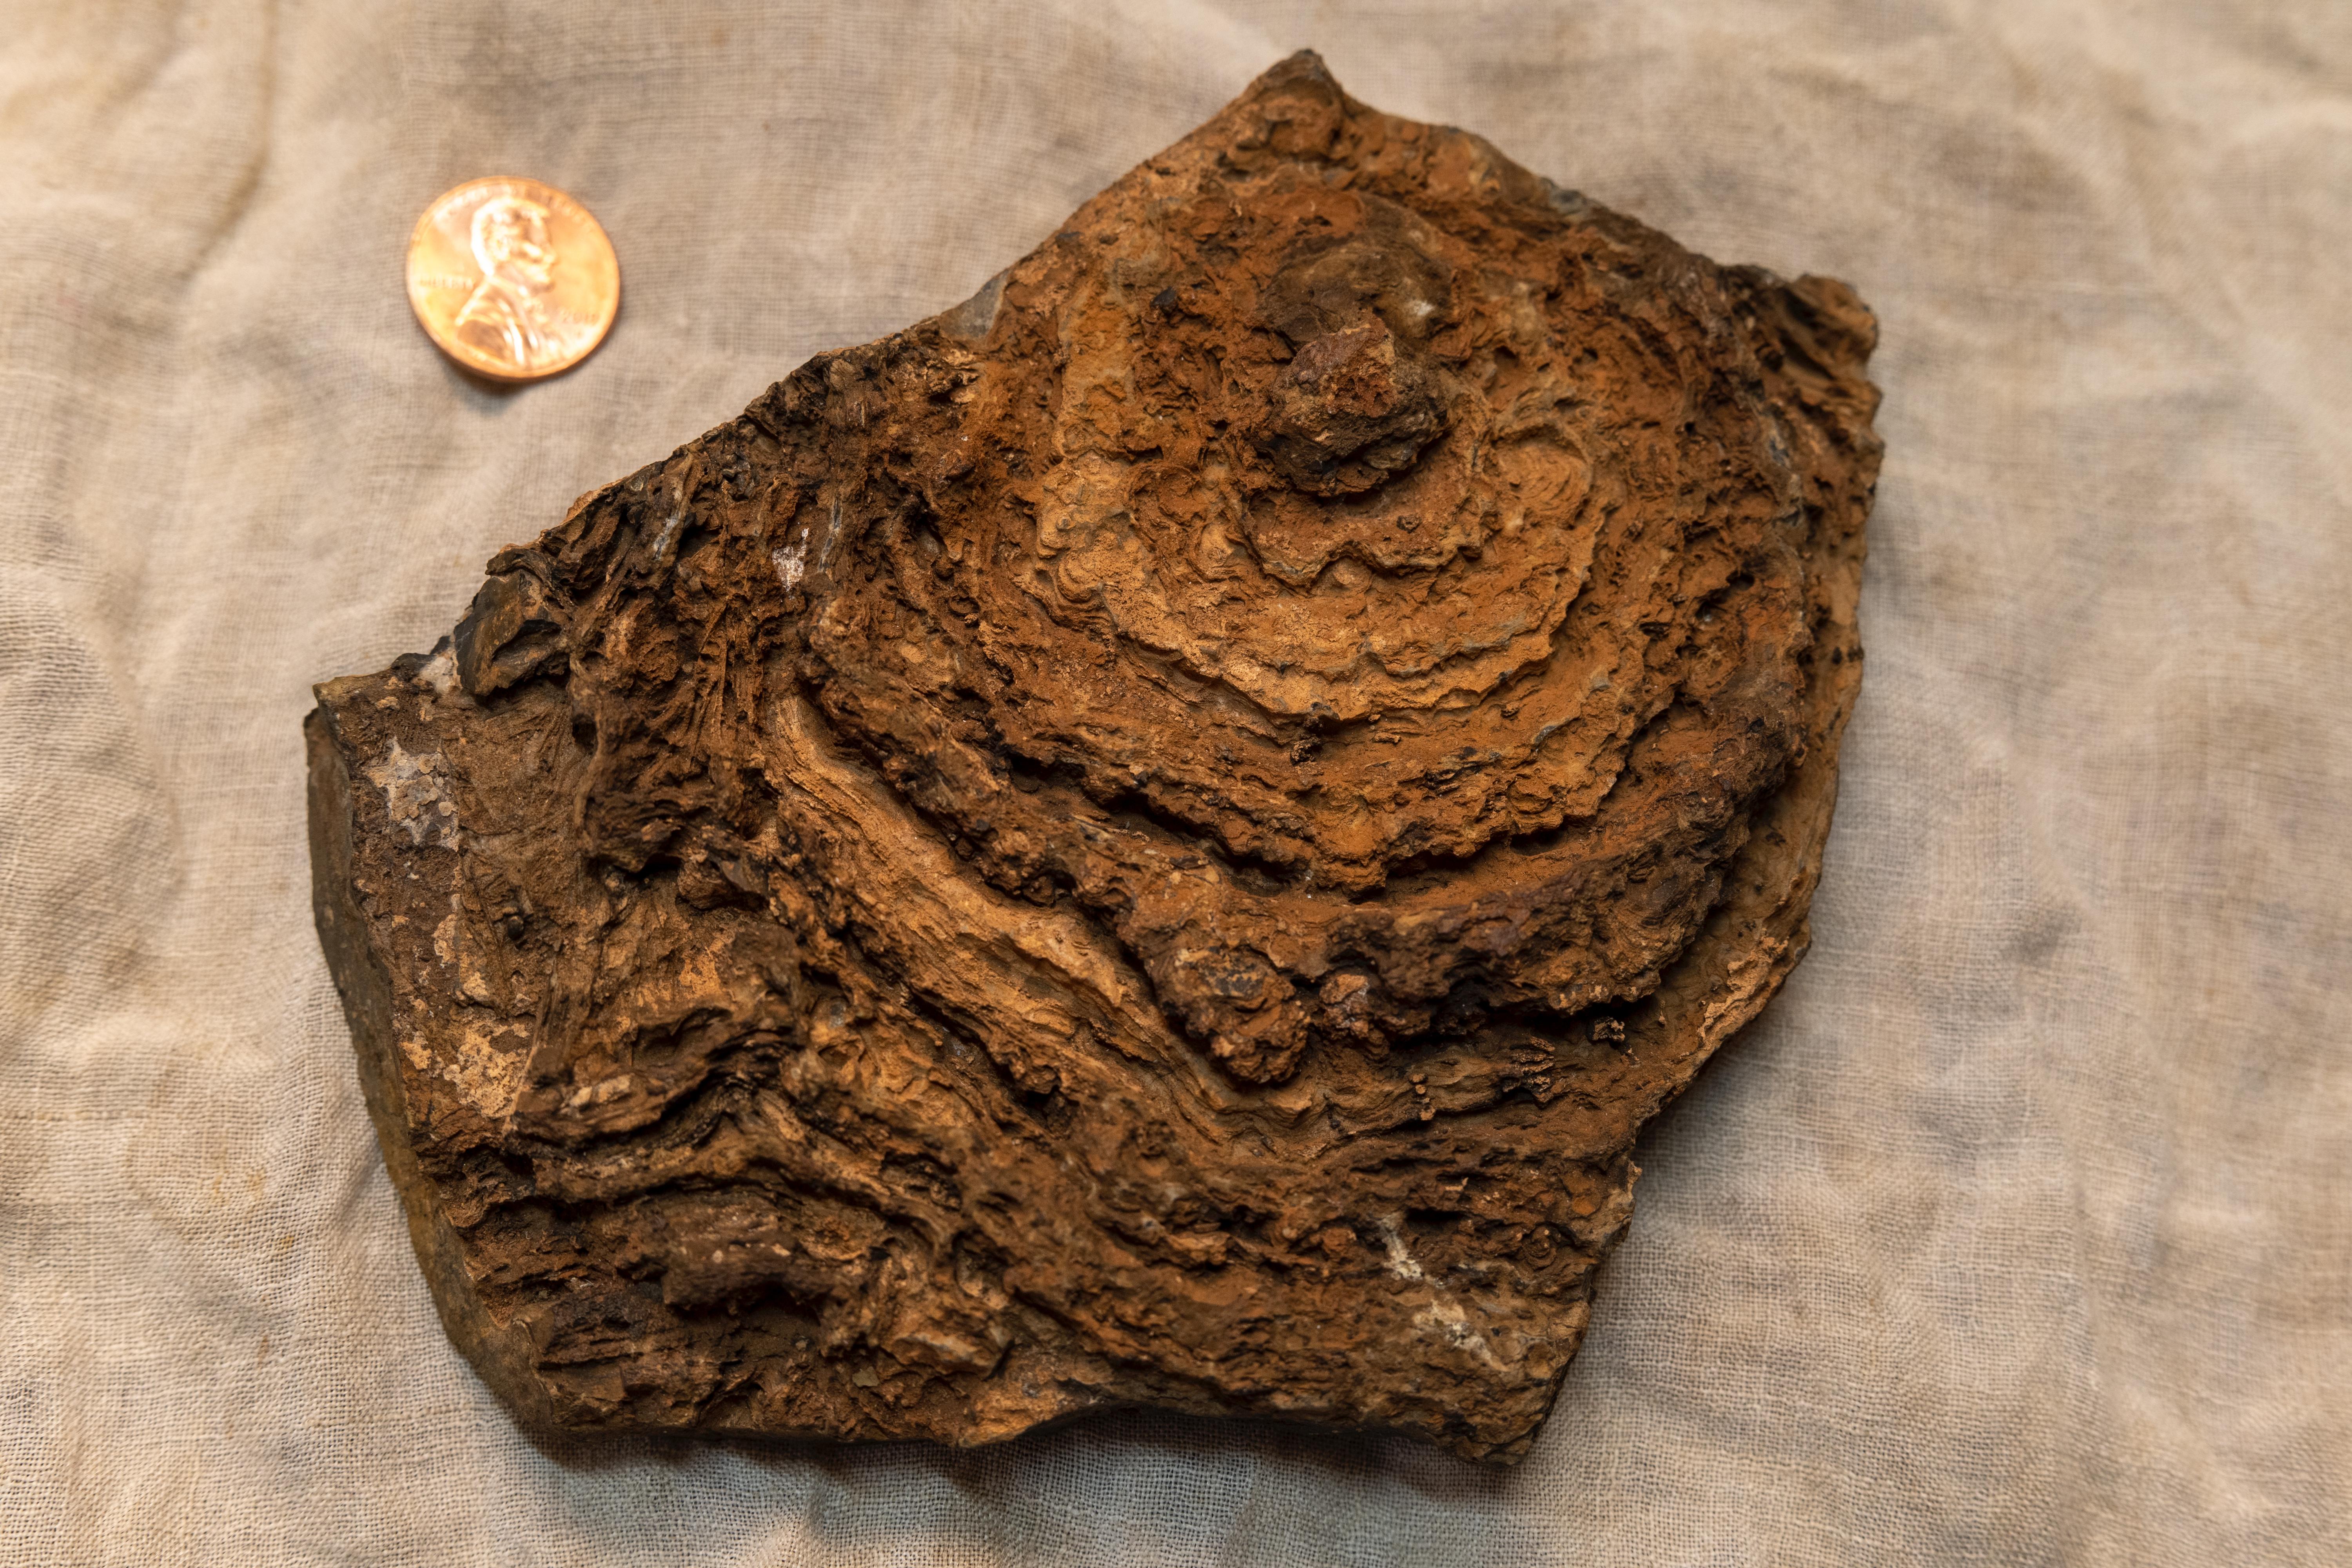
PIA23551:
-
Researching Outback Stromatolites
Full Resolution:
TIFF
(36.59 MB)
JPEG
(2.427 MB)
|
|
|
2019-11-20 |
Moon
|
Apollo 12
|
|
711x1113x3 |
|
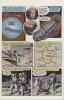
-
PIA23552:
-
Apollo 12 Graphic Novel
Full Resolution:
TIFF
(2.375 MB)
JPEG
(165.5 kB)
|
|
|
2019-12-16 |
Earth
|
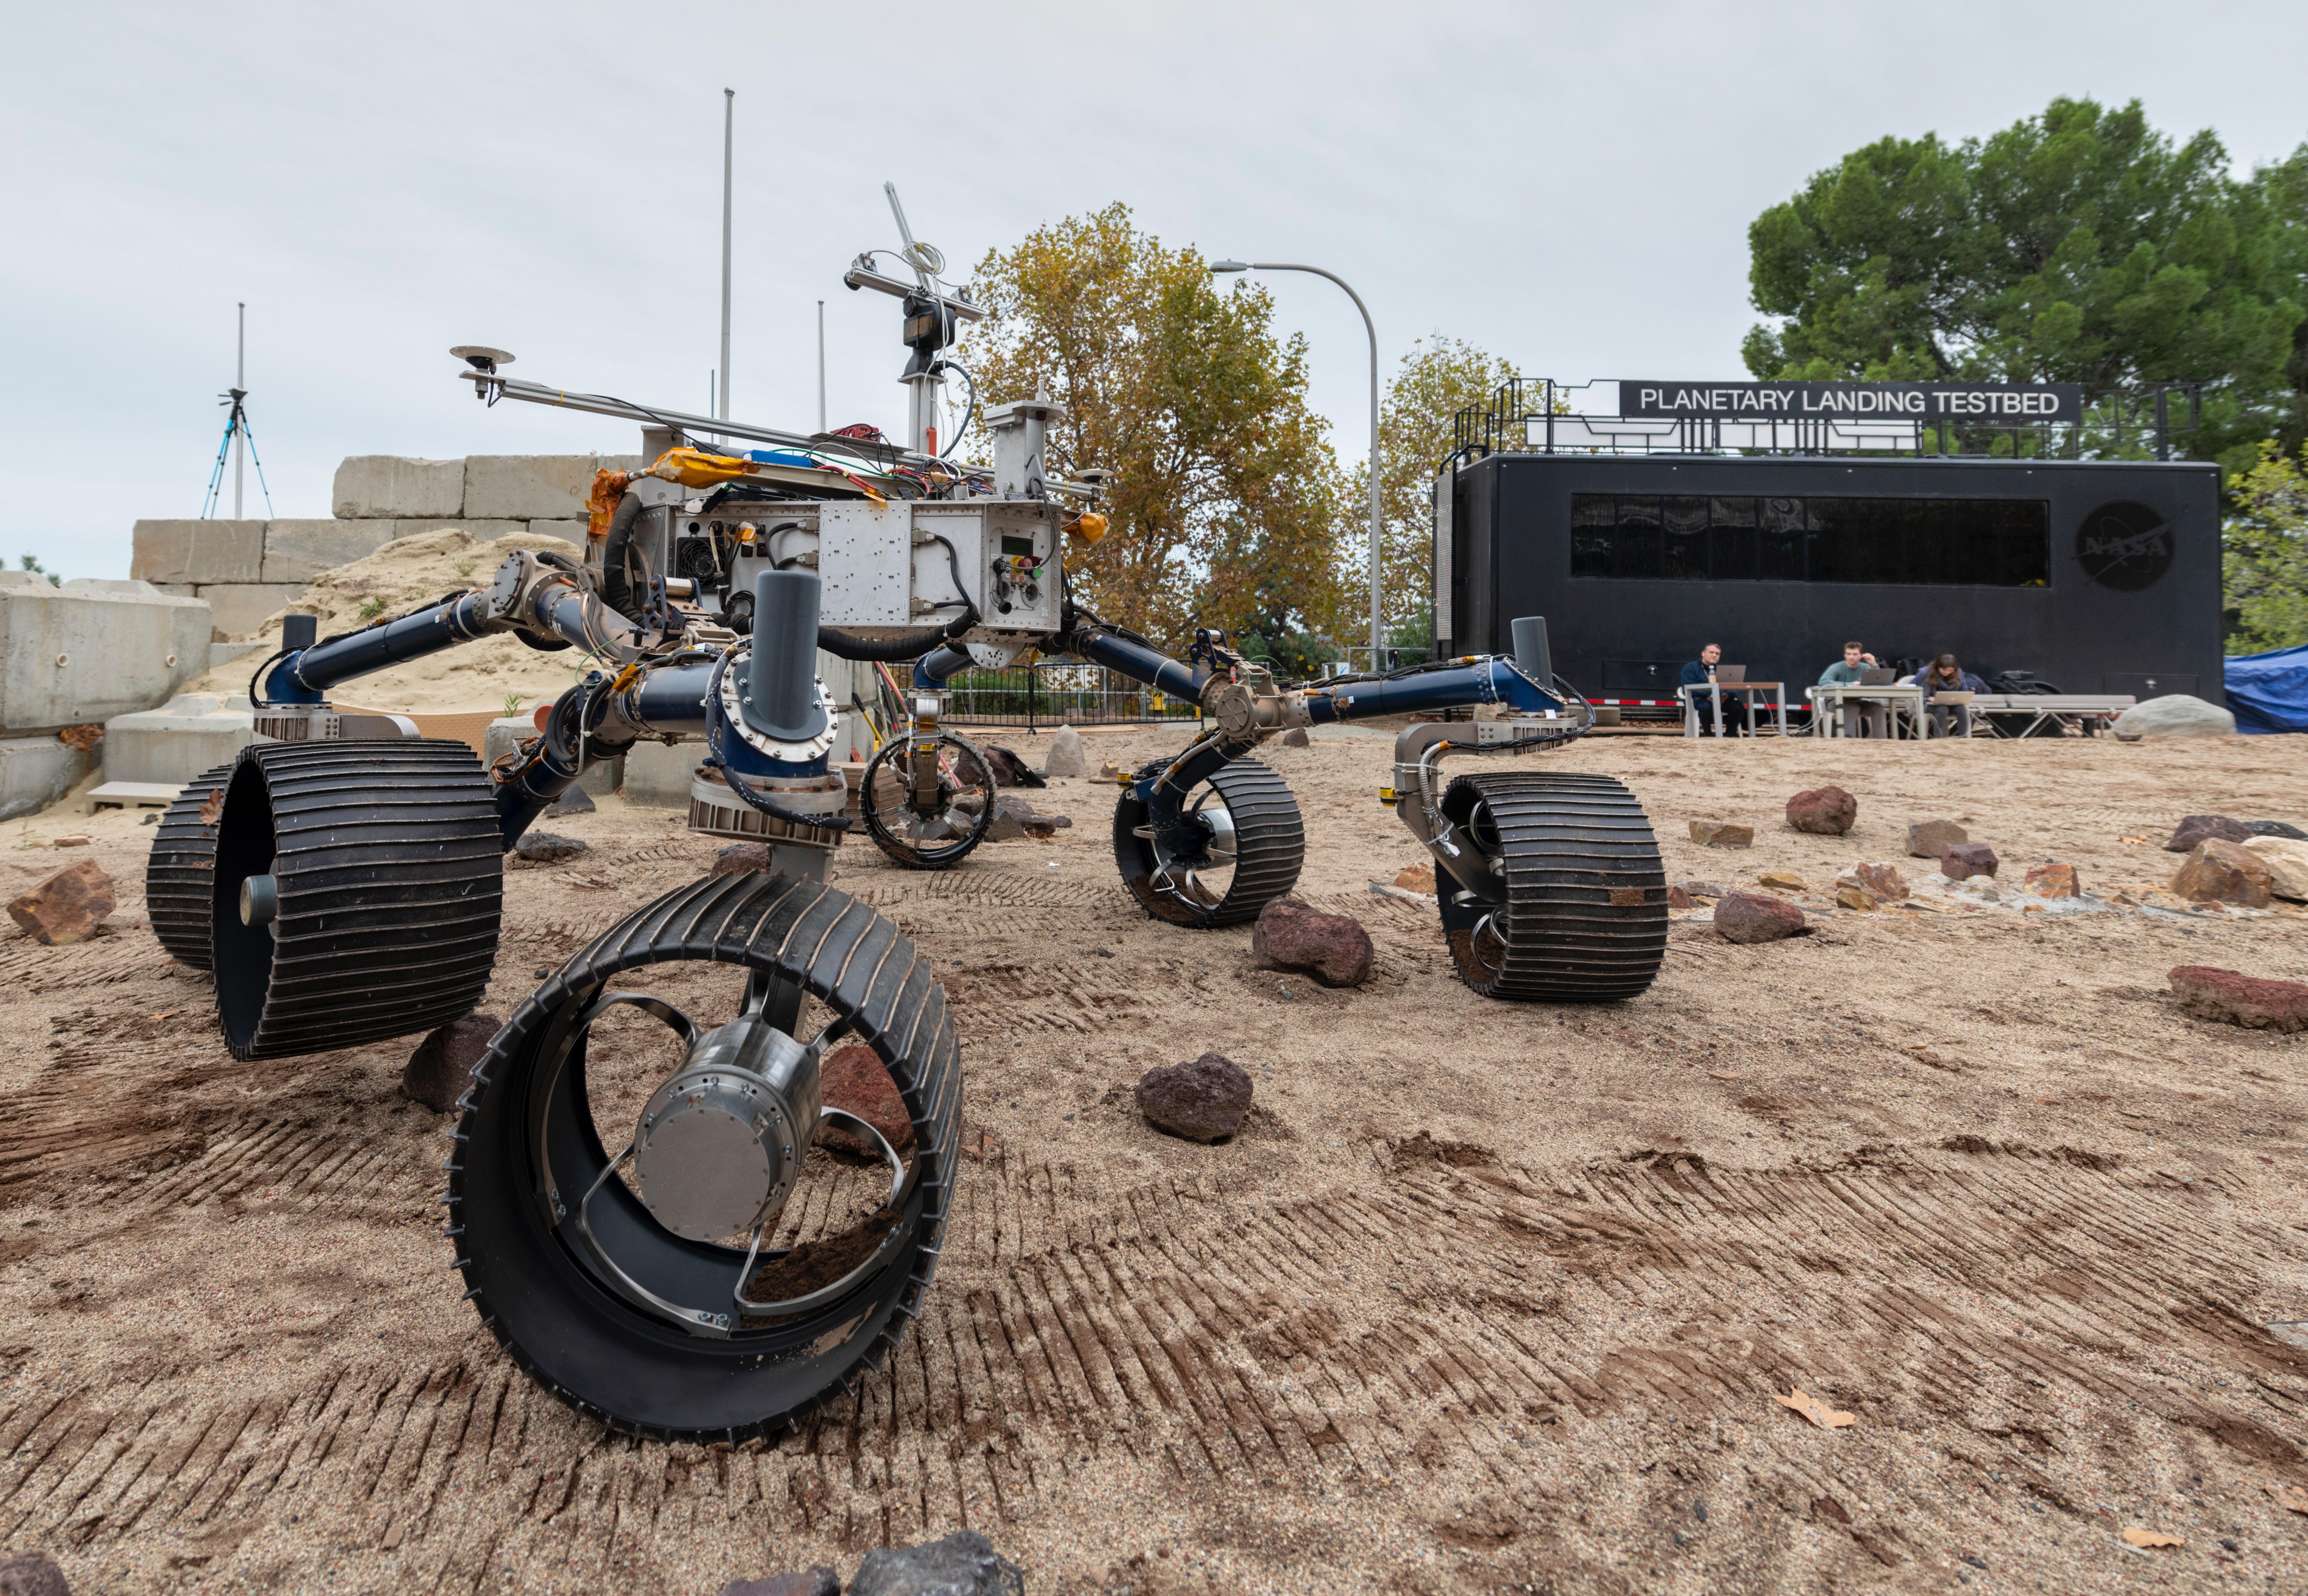
Mars 2020 Rover
|
|
6417x4437x3 |
|
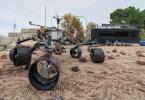
-
PIA23498:
-
Mars 2020 Makes Tracks for the Red Planet in the Mars Yard
Full Resolution:
TIFF
(73.43 MB)
JPEG
(3.678 MB)
|
|
|
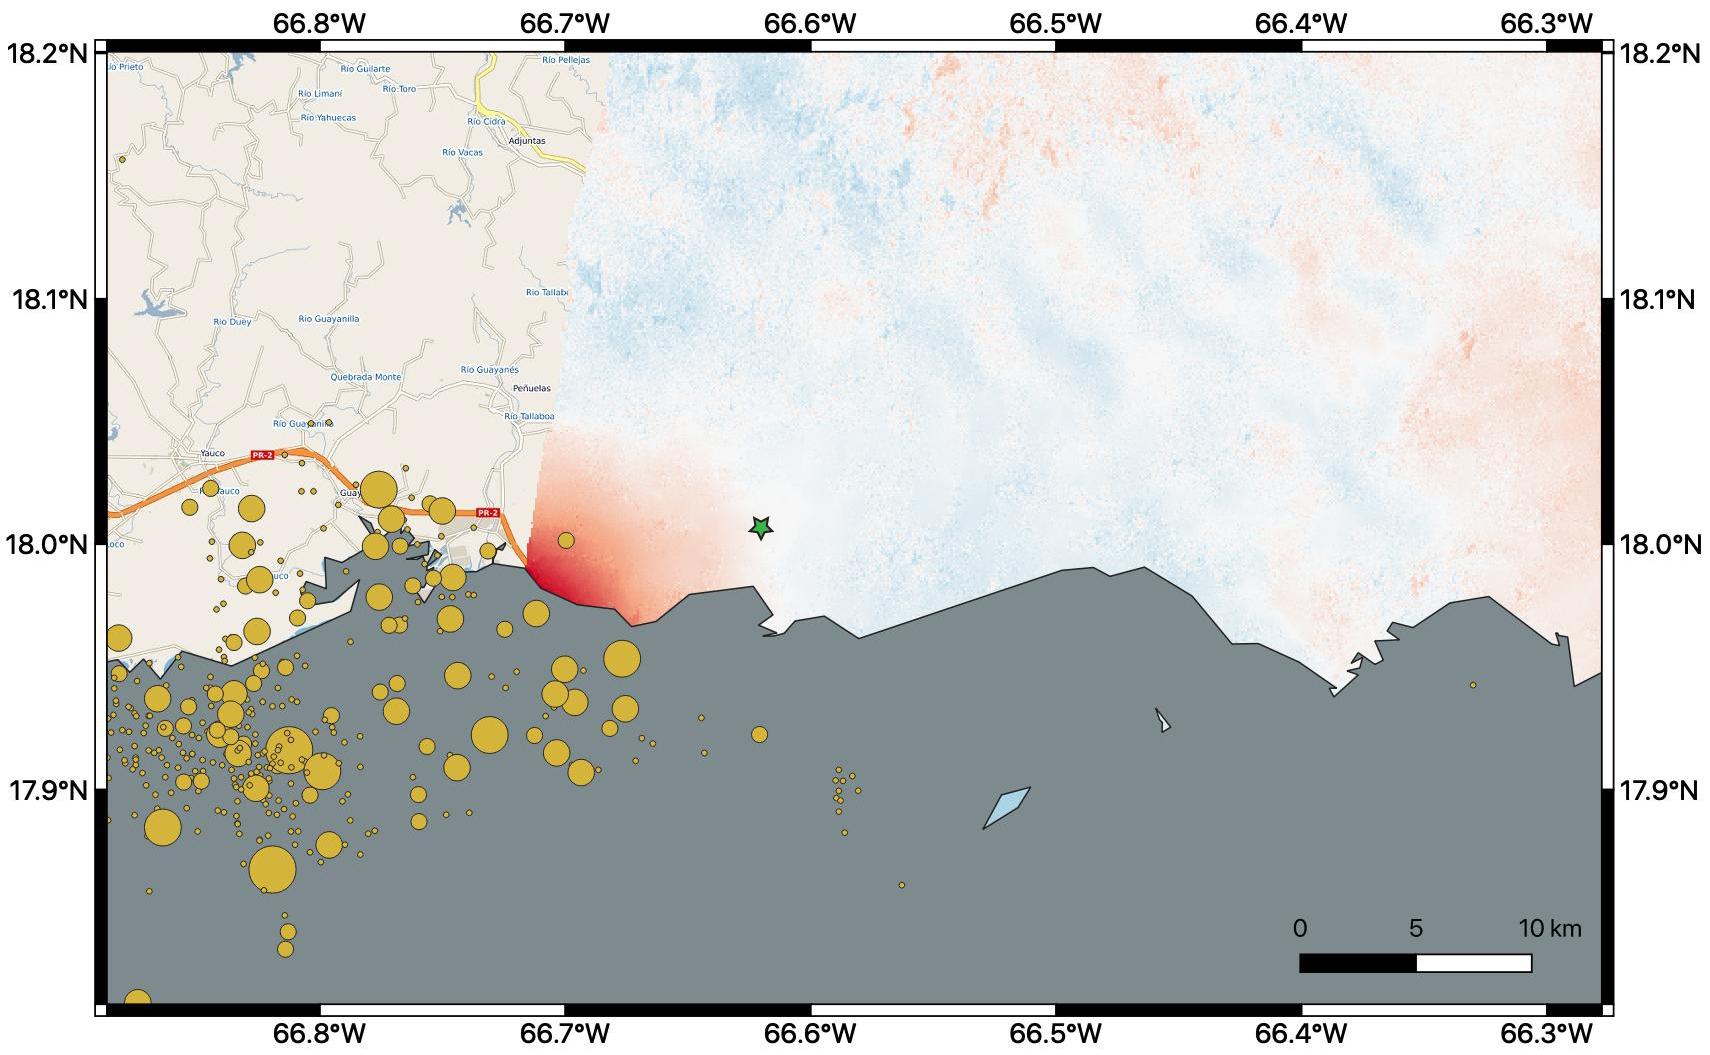
2020-01-10 |
Earth
|
ARIA
|
|
1710x1055x3 |
|
-
PIA23428:
-
Puerto Rico Quake Damage Visible From Space
Full Resolution:
TIFF
(2.476 MB)
JPEG
(189 kB)
|
|
|
2020-02-04 |
Earth
|
ECOSTRESS
|
|
772x440x3 |

|
-
PIA23430:
-
The ECOSTRESS Mission Spots Plants as They Wake Up
Full Resolution:
TIFF
(1.02 MB)
JPEG
(72.92 kB)
|
|
|
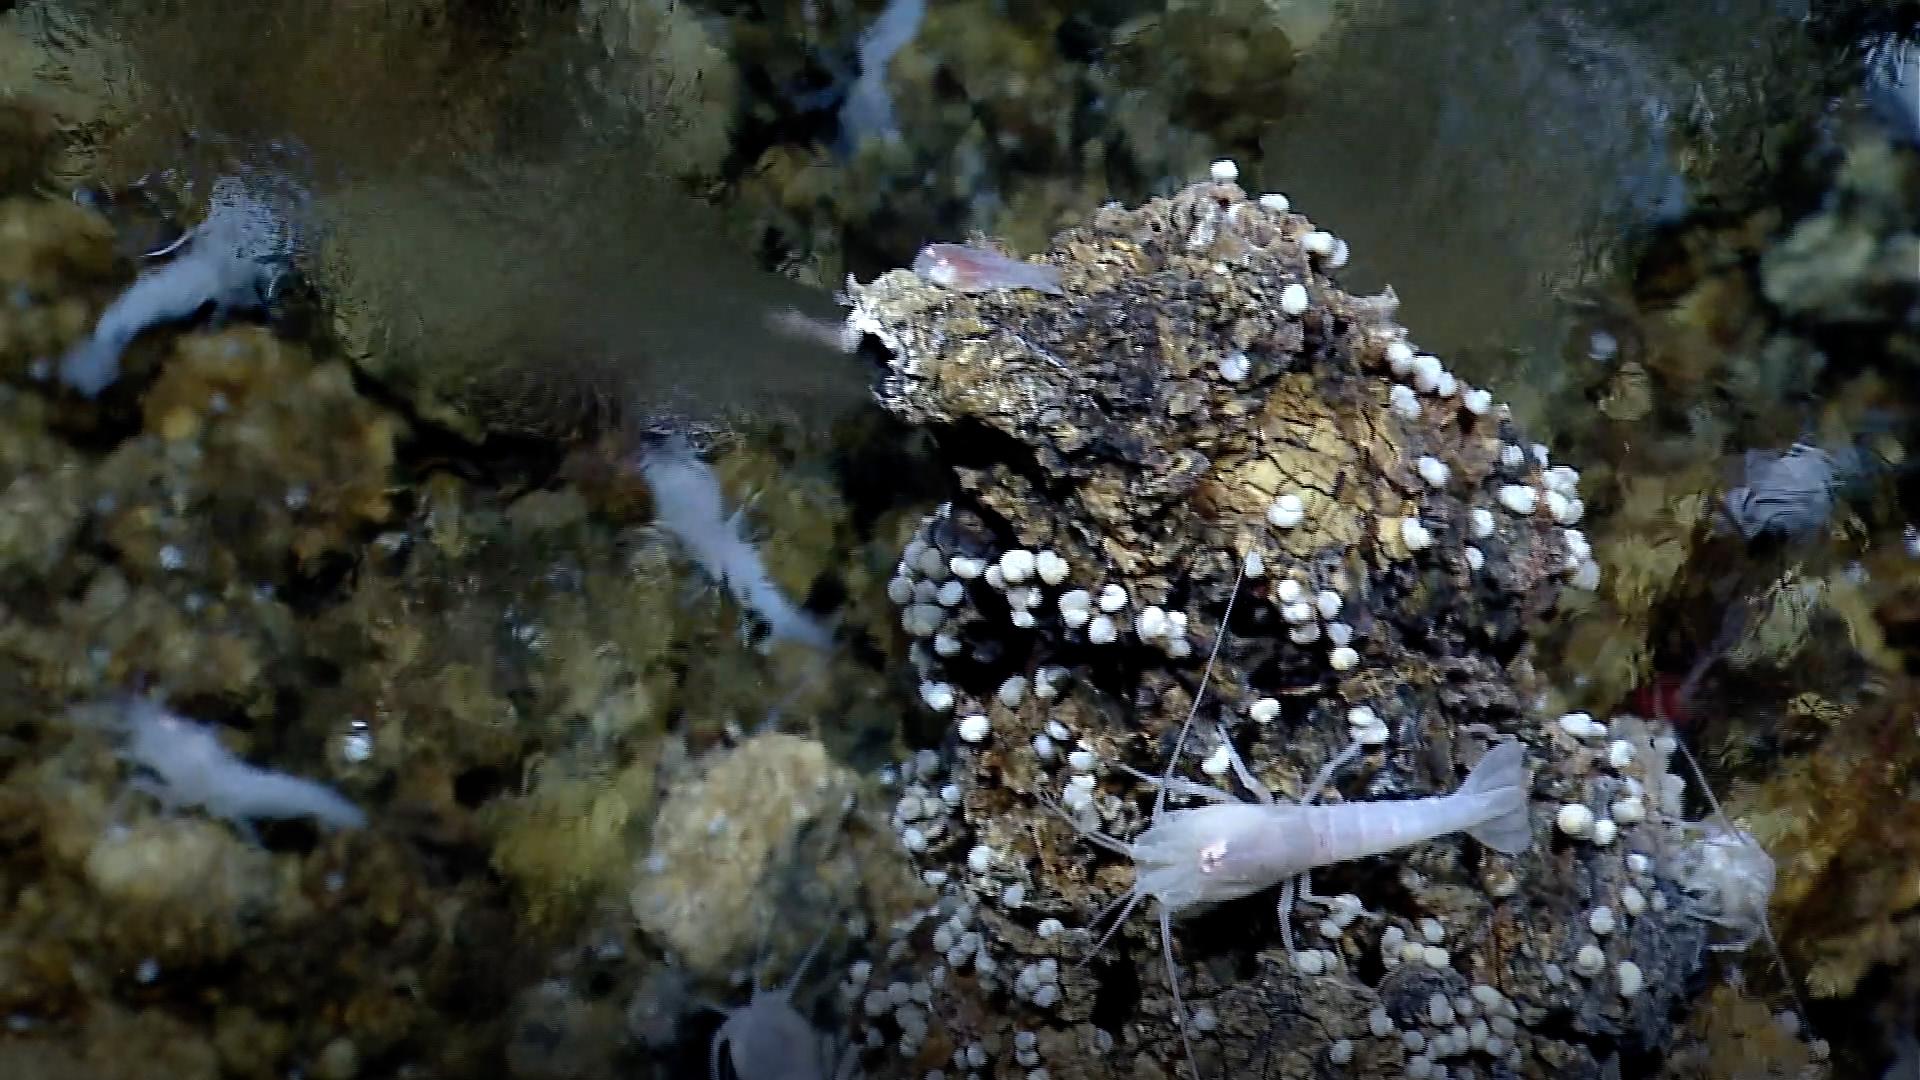
2020-04-15 |
Earth
|
|
|
1920x1080x3 |
|
-
PIA23686:
-
White Smoker Ocean Vents
Full Resolution:
TIFF
(6.172 MB)
JPEG
(270.2 kB)
|
|
|
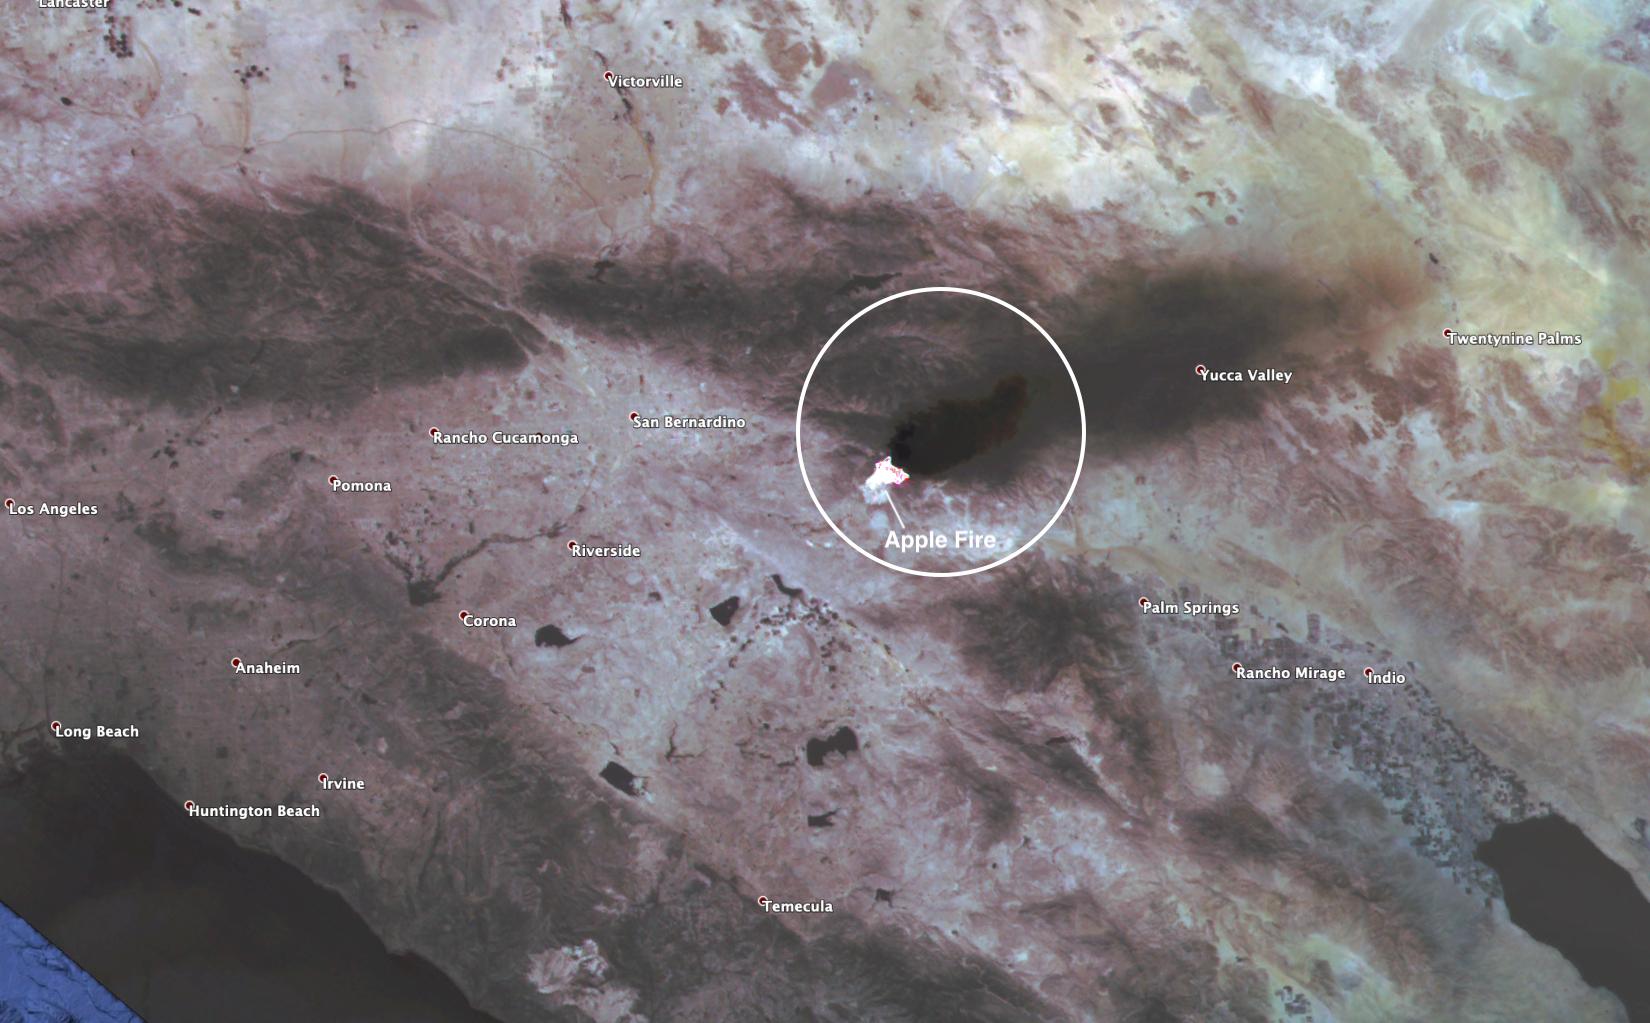
2020-08-03 |
Earth
|
ECOSTRESS
|
|
2908x2224x3 |
|
-
PIA23798:
-
ECOSTRESS Gauges the Apple Fire's Temperature From Space
Full Resolution:
TIFF
(14.41 MB)
JPEG
(620.1 kB)
|
|
|
2020-08-03 |
Earth
|
ECOSTRESS
|
|
1650x1023x3 |

|
-
PIA23799:
-
ECOSTRESS Spies Apple Fire's Smoke Plume
Full Resolution:
TIFF
(4.924 MB)
JPEG
(188.5 kB)
|
|
|
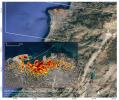
2020-08-07 |
Earth
|
ARIA
|
|
2944x2480x3 |
|
-
PIA23692:
-
ARIA Damage Map: Beirut Explosion Aftermath
Full Resolution:
TIFF
(19.6 MB)
JPEG
(1.471 MB)
|
|
|
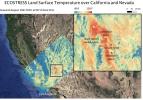
2020-08-19 |
Earth
|
ECOSTRESS
|
|
3507x2480x3 |
|
-
PIA23786:
-
Los Angeles Heat Wave
Full Resolution:
TIFF
(19.81 MB)
JPEG
(1.073 MB)
|
|
|
2020-08-19 |
Earth
|
ECOSTRESS
|
|
3447x2404x3 |
|
-
PIA23787:
-
Death Valley Heats Up
Full Resolution:
TIFF
(23.97 MB)
JPEG
(1.434 MB)
|
|
|
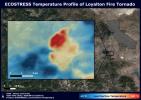
2020-08-27 |
Earth
|
ECOSTRESS
|
|
3507x2480x3 |
|
-
PIA23215:
-
NASA's ECOSTRESS Sees Fire-Induced Tornado From Space
Full Resolution:
TIFF
(21.72 MB)
JPEG
(1.14 MB)
|
|
|
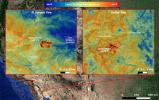
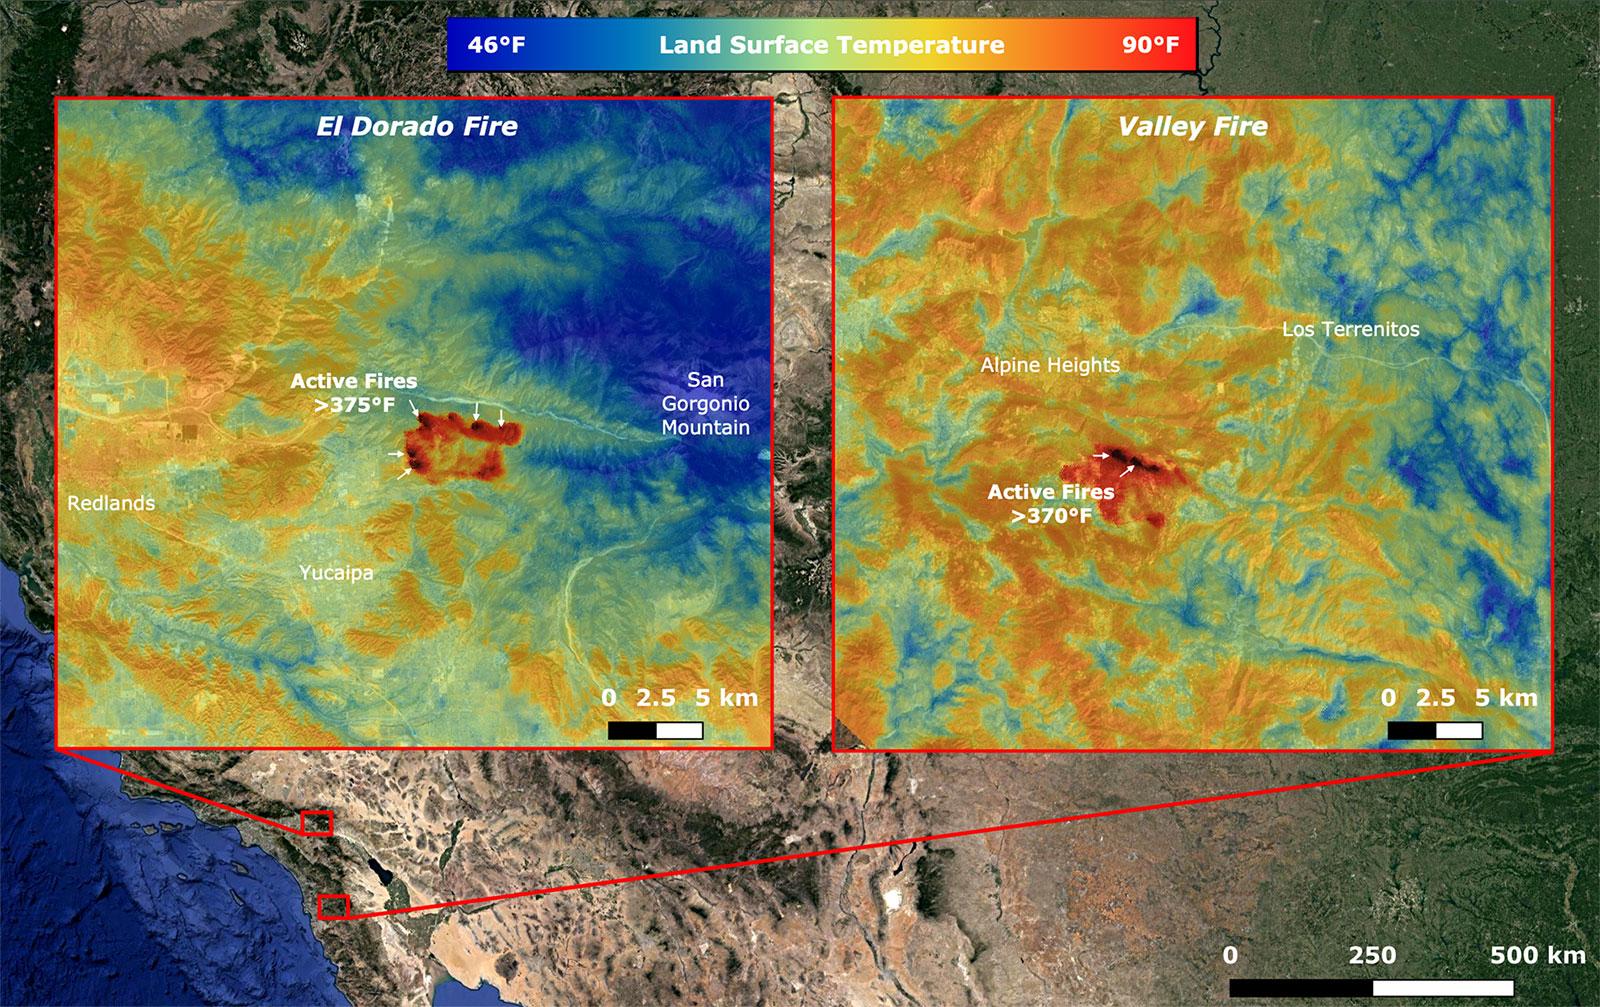
2020-09-08 |
Earth
|
ECOSTRESS
|
|
1600x1007x3 |
|
-
PIA23788:
-
NASA's ECOSTRESS Takes Surface Temperature Around California Fires
Full Resolution:
TIFF
(4.835 MB)
JPEG
(361.7 kB)
|
|
|
2020-09-23 |
Earth
|
|
|
8000x5955x3 |
|
-
PIA23790:
-
OASIS Study Project (Illustration)
Full Resolution:
TIFF
(104.1 MB)
JPEG
(4.095 MB)
|
|
|
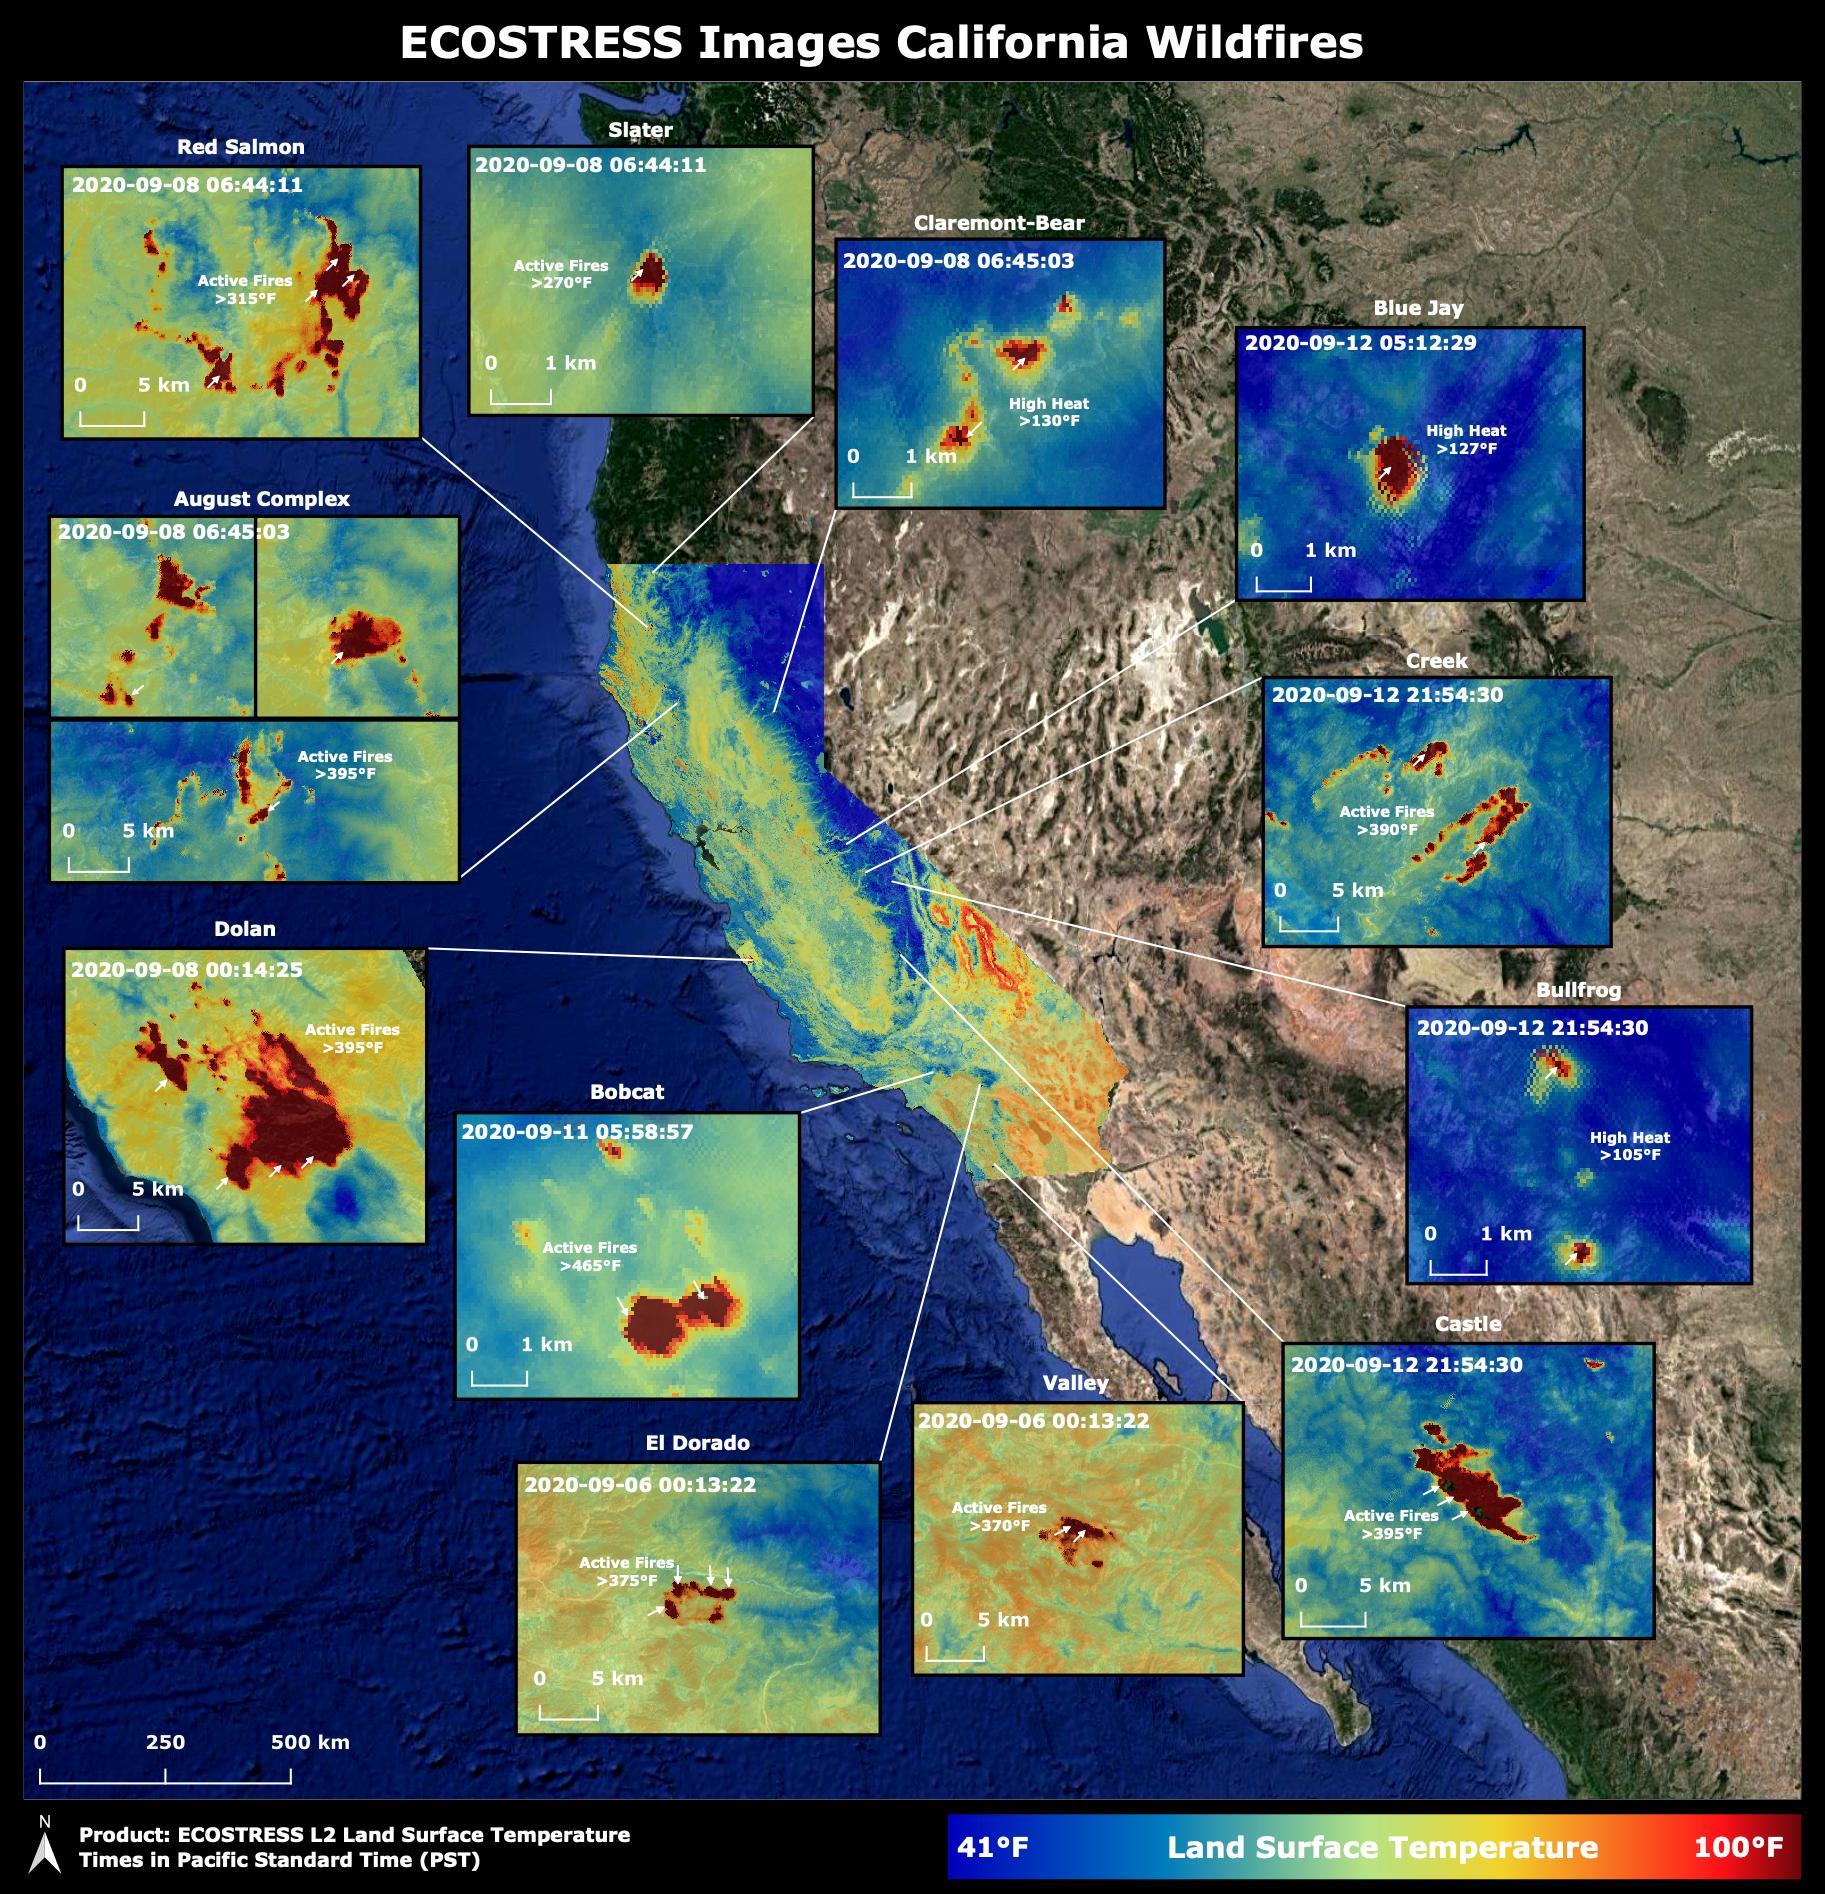
2020-10-02 |
Earth
|
ECOSTRESS
|
|
1825x1894x3 |

|
-
PIA23721:
-
NASA's ECOSTRESS Images California Wildfires From Space
Full Resolution:
TIFF
(10.37 MB)
JPEG
(633.2 kB)
|
|
|
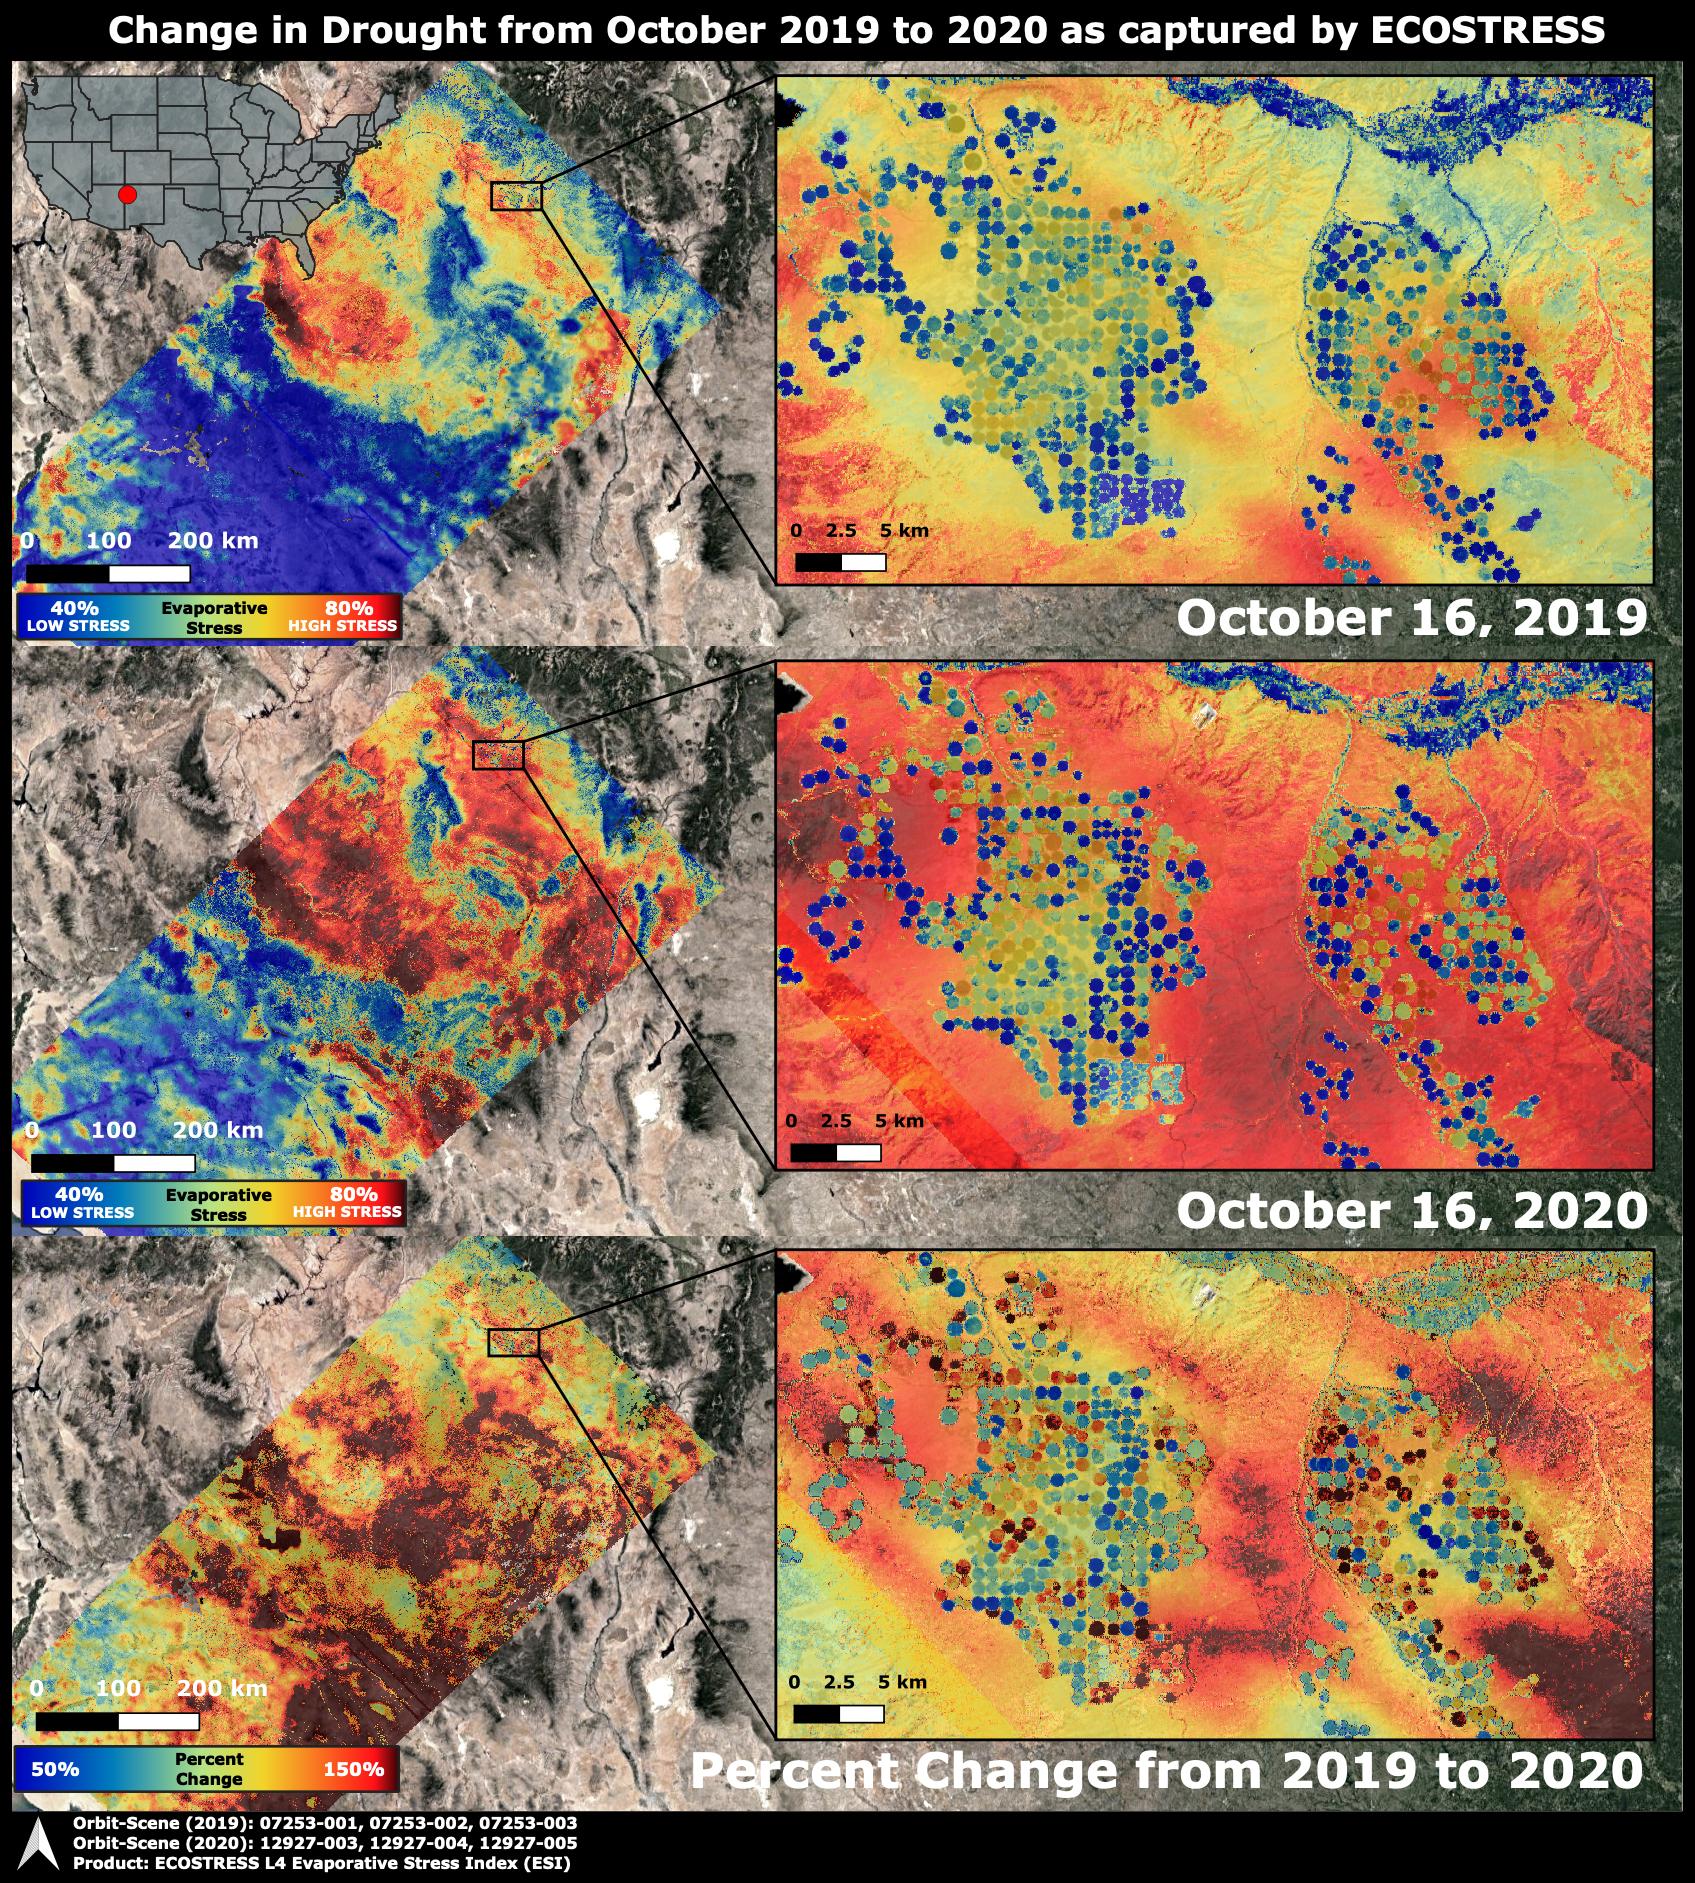
2020-10-28 |
Earth
|
ECOSTRESS
|
|
1695x1883x3 |

|
-
PIA24132:
-
ECOSTRESS Drought Stress Comparison
Full Resolution:
TIFF
(9.579 MB)
JPEG
(930 kB)
|
|
|
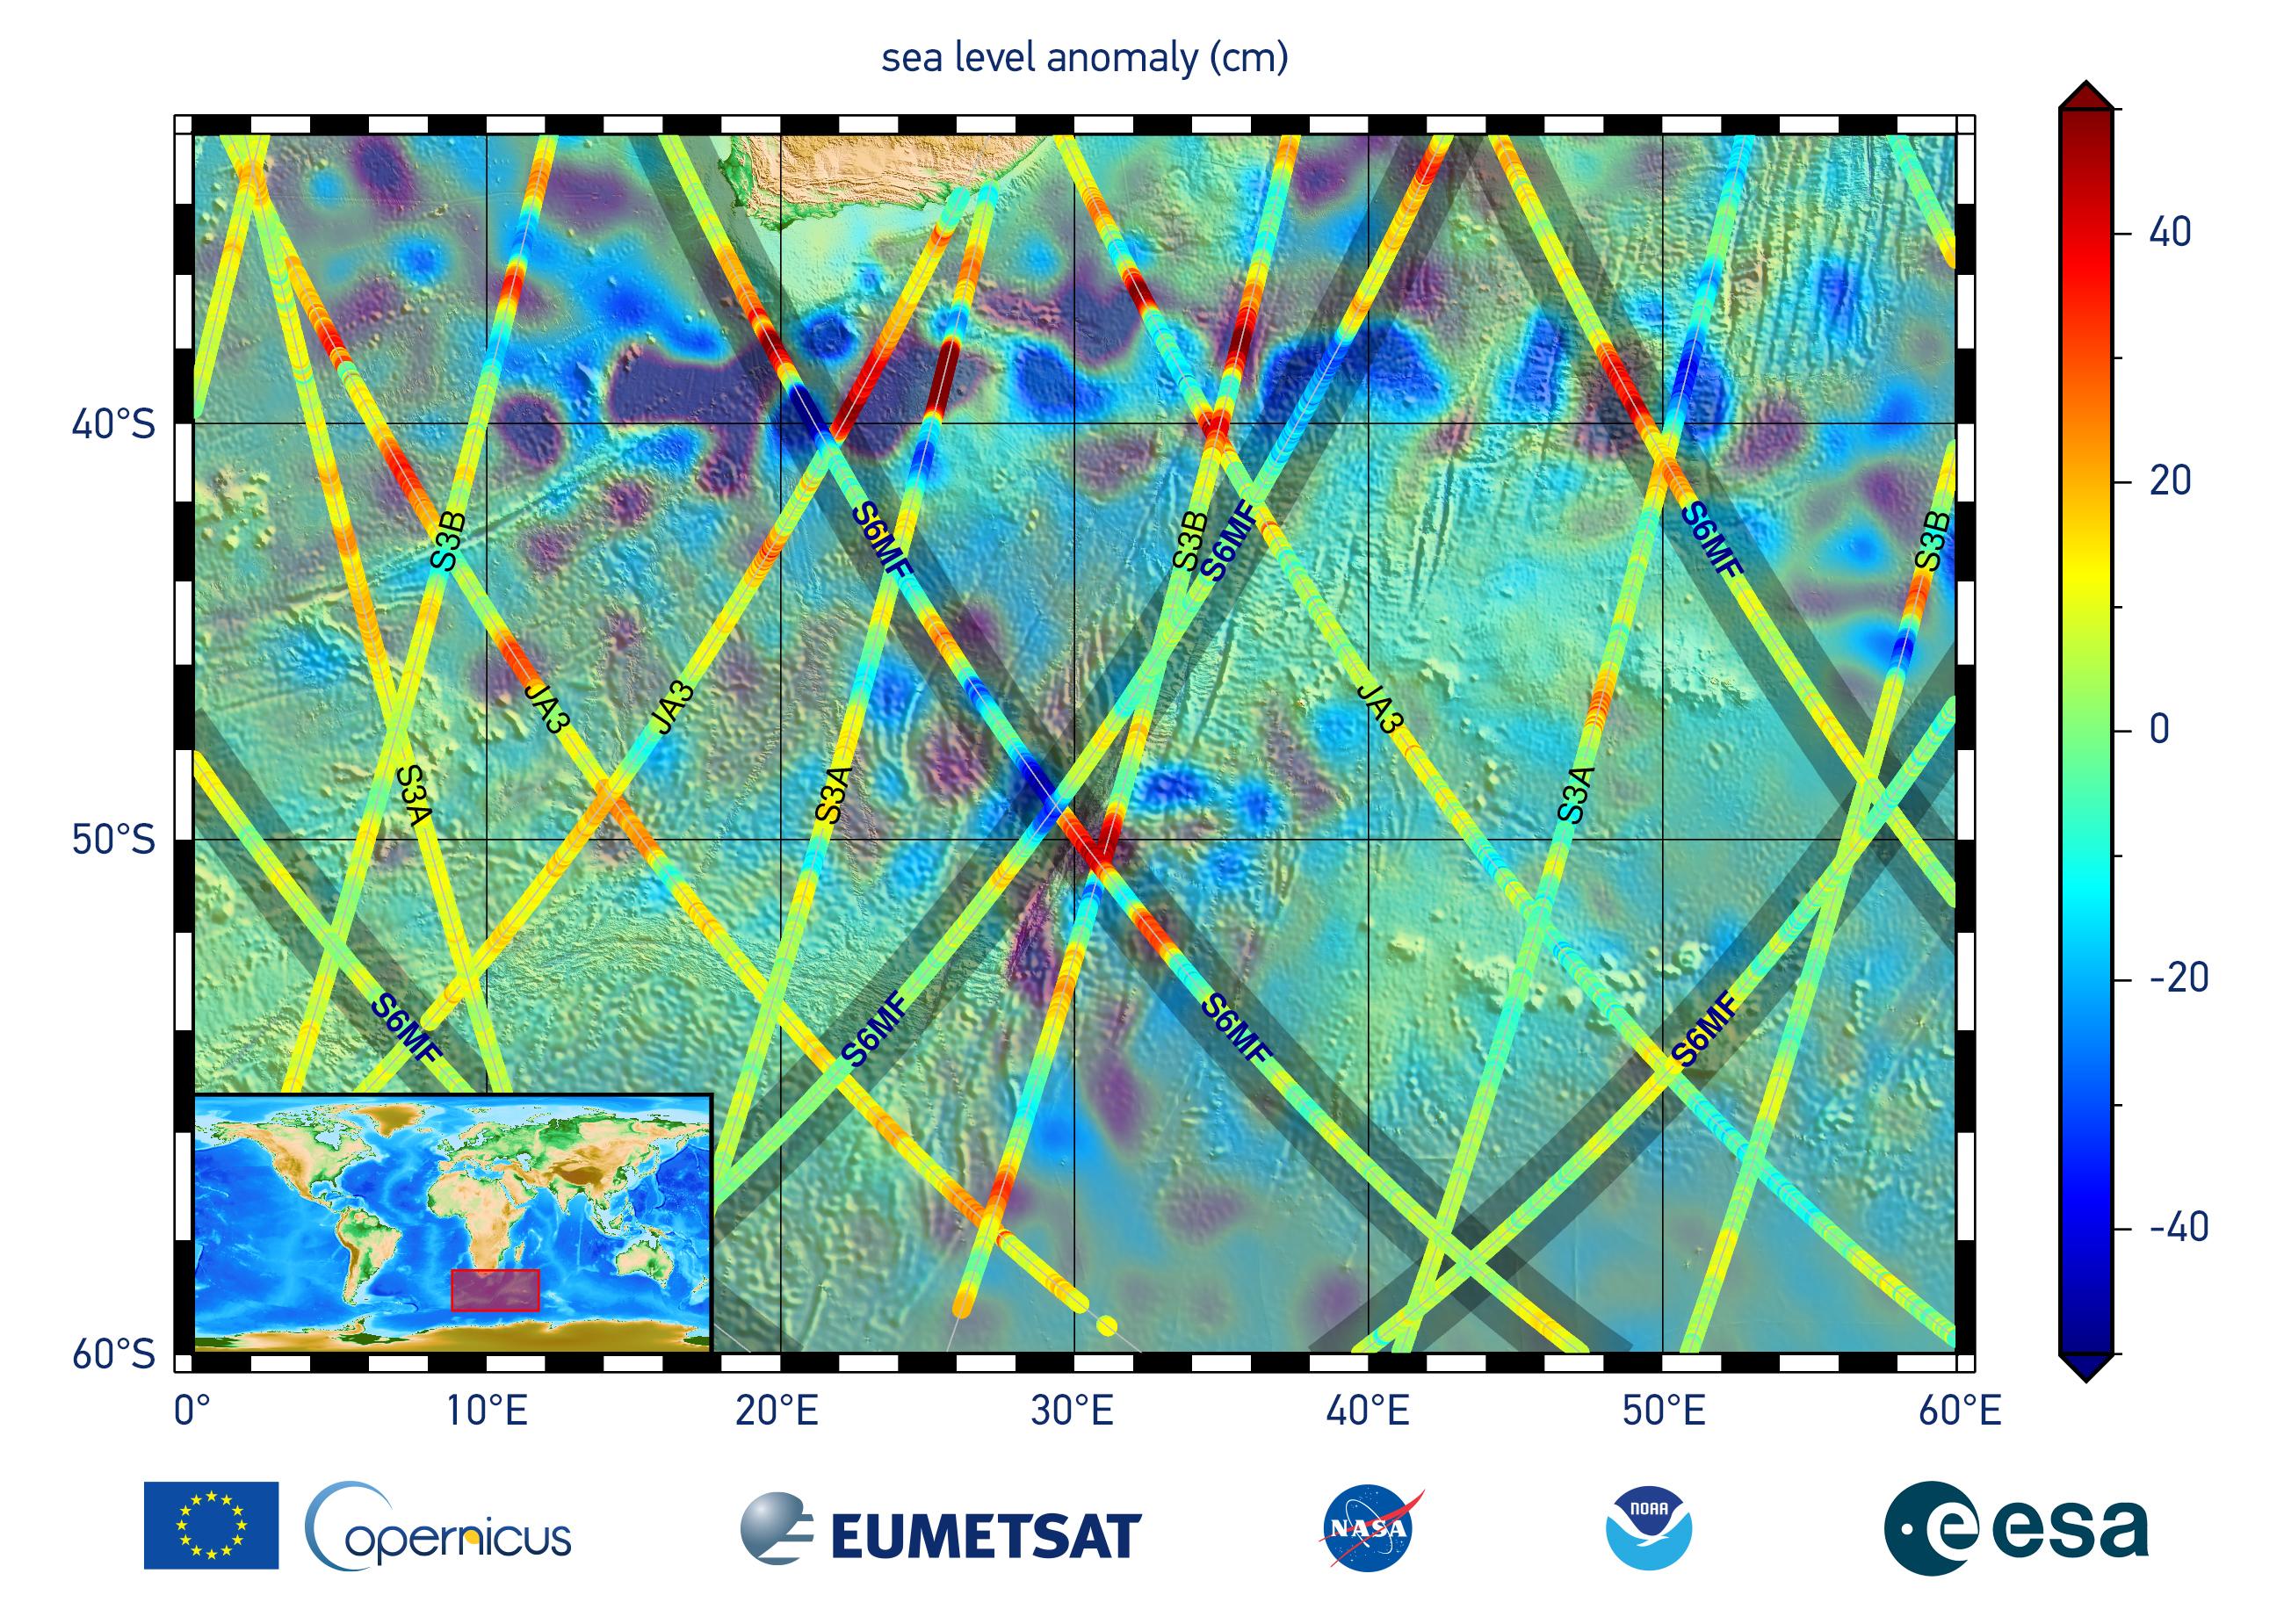
2020-12-10 |
Earth
|
Sentinel-6/Jason-CS
|
|
2600x1849x3 |
|
-
PIA24135:
-
Sentinel-6 Michael Freilich First Light Sea Level
Full Resolution:
TIFF
(10.71 MB)
JPEG
(704.9 kB)
|
|
|
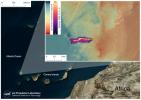
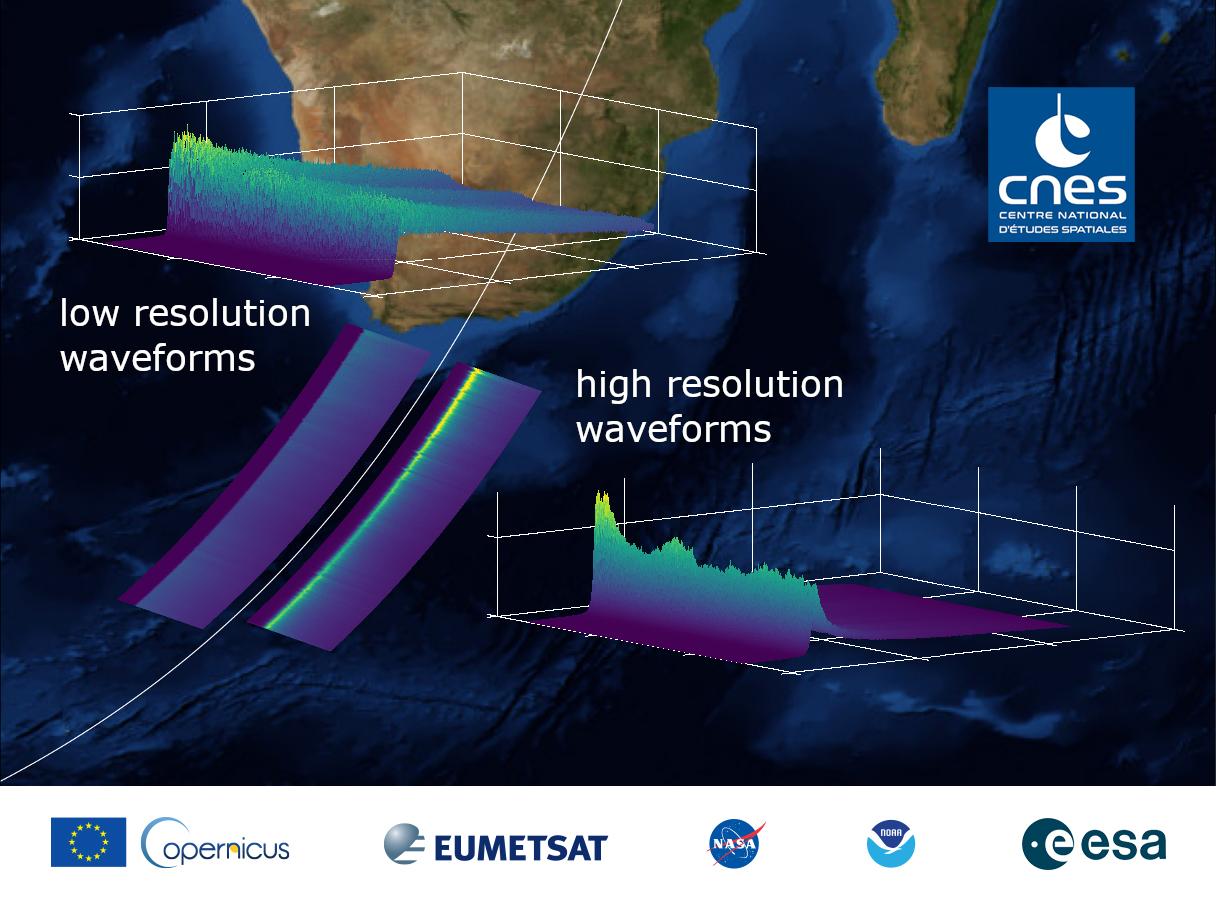
2020-12-10 |
Earth
|
Sentinel-6/Jason-CS
|
|
1216x900x3 |
|
-
PIA24136:
-
Sentinel-6 Michael Freilich First Light Waveform
Full Resolution:
TIFF
(2.221 MB)
JPEG
(121.2 kB)
|
|
|
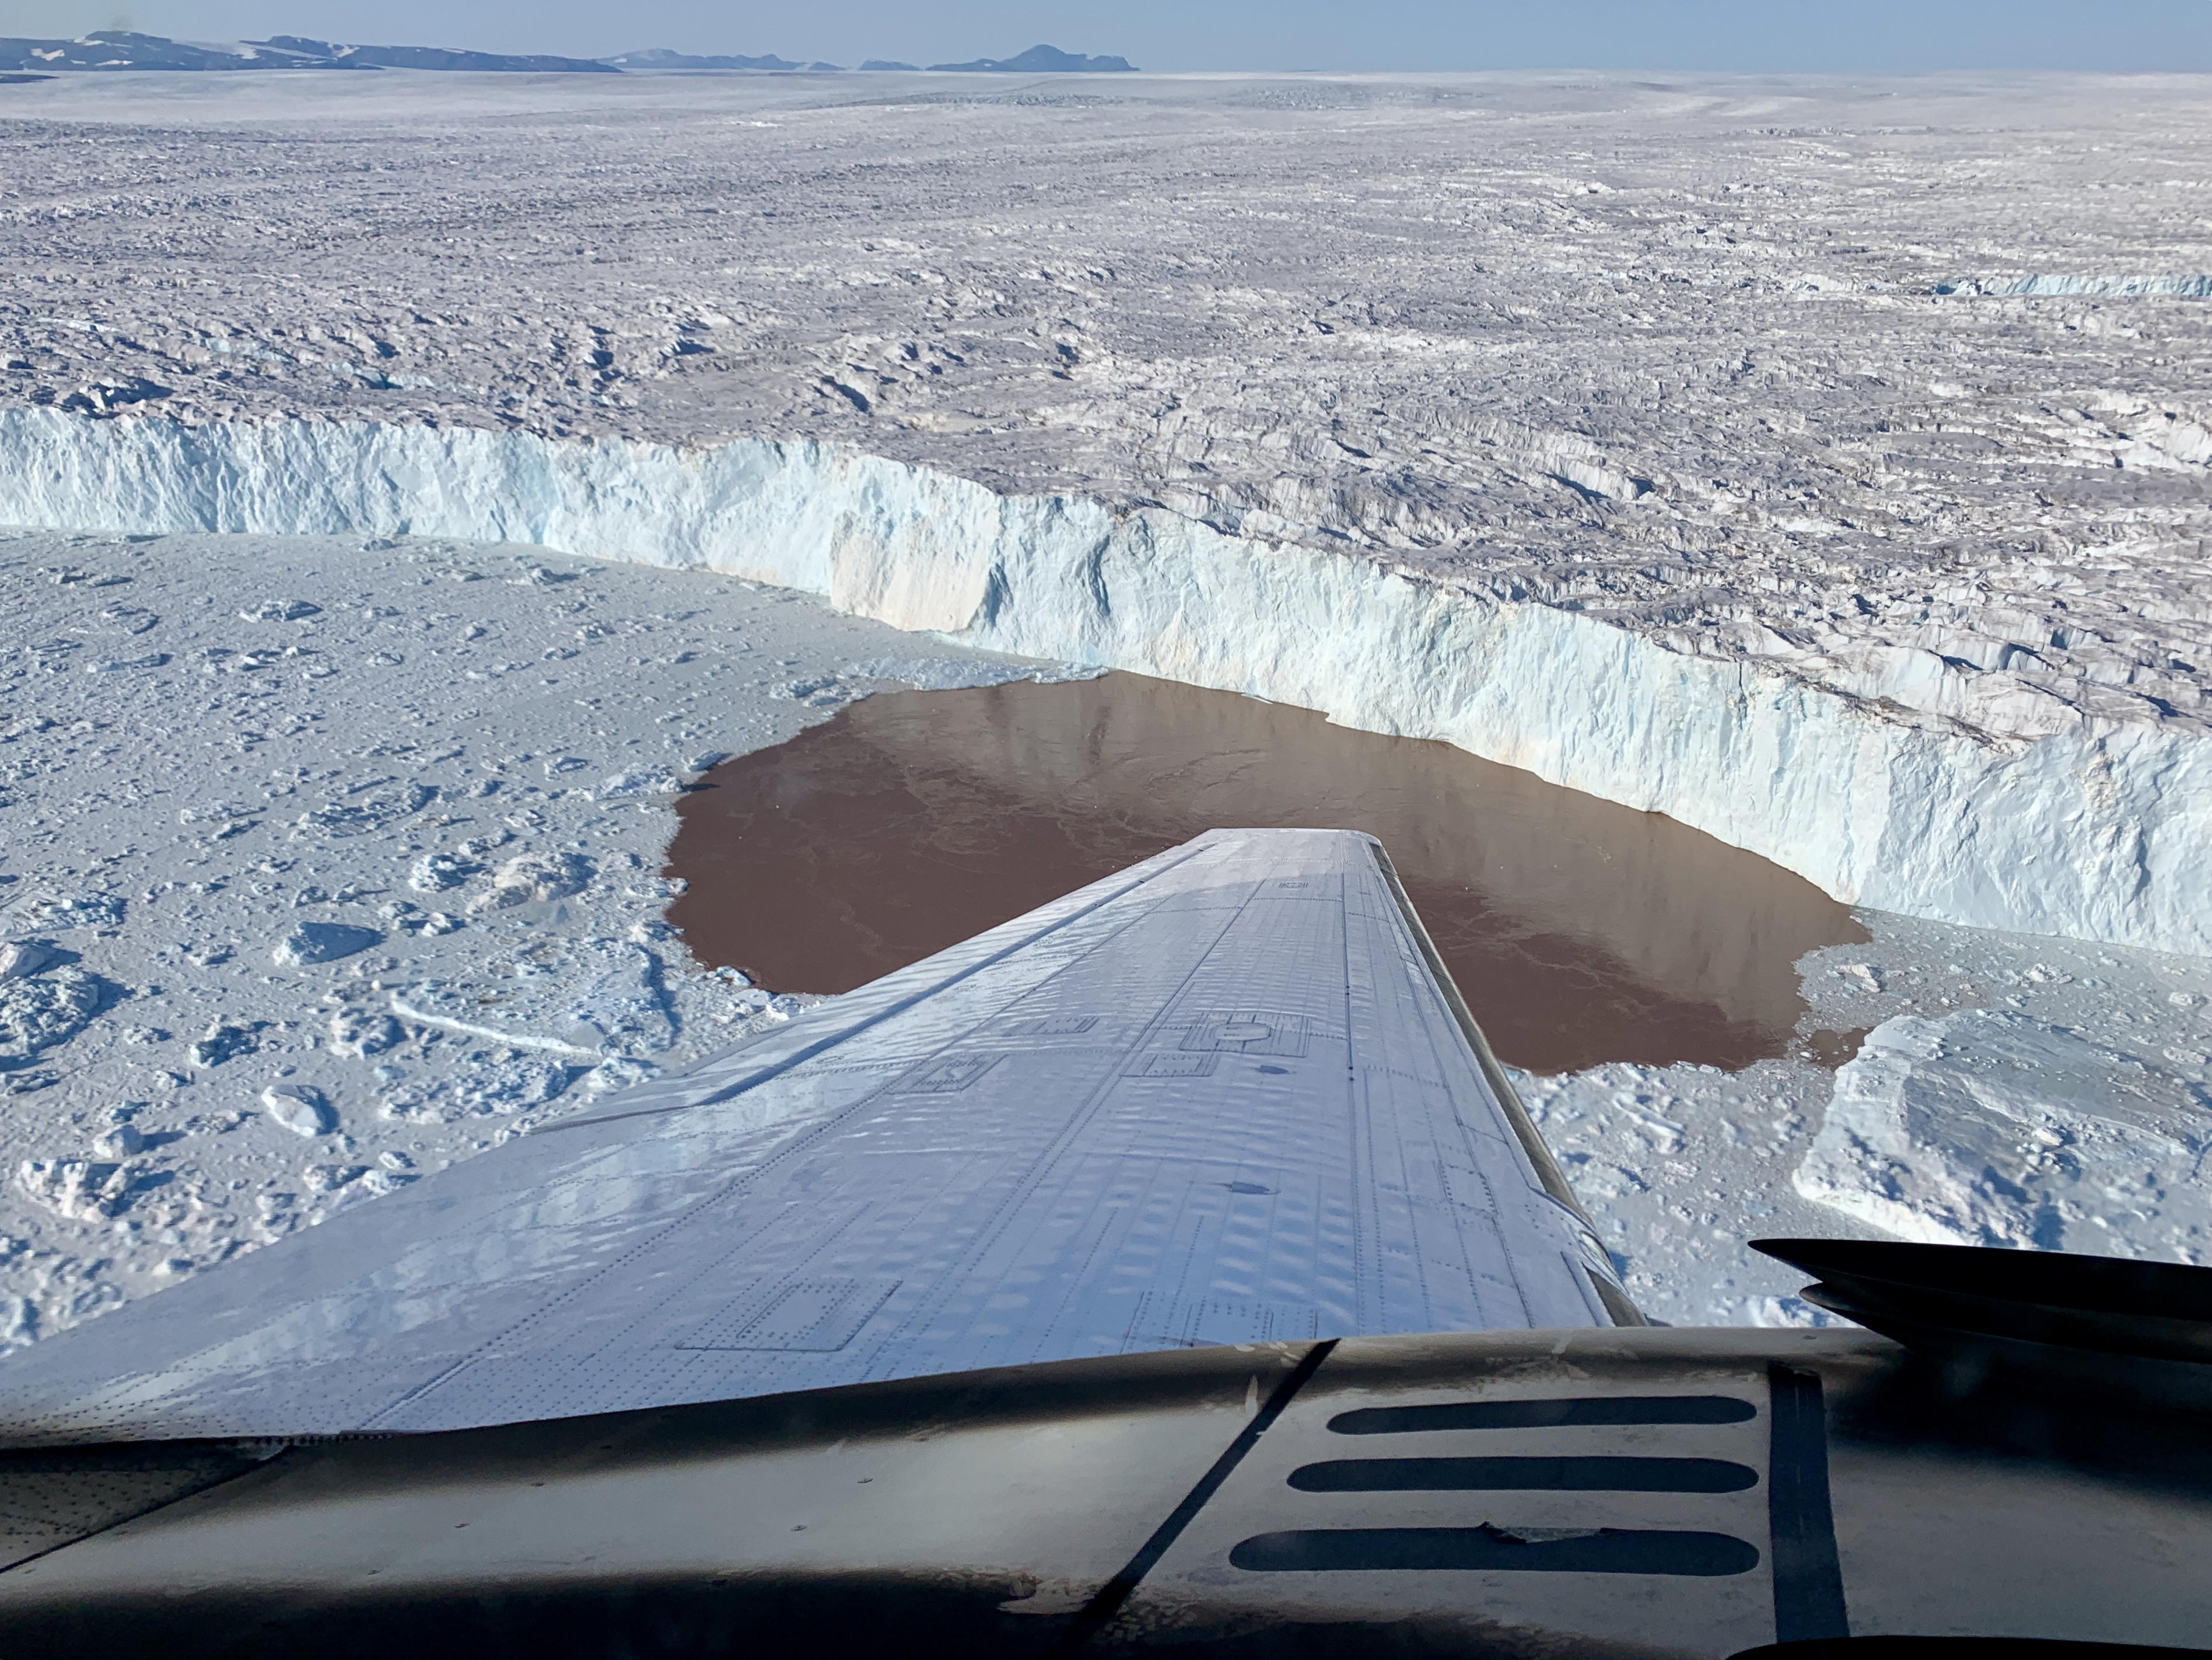
2021-01-25 |
Earth
|
OMG
|
|
3792x2846x3 |
|
-
PIA24162:
-
Glacier Undercutting in Action
Full Resolution:
TIFF
(26.91 MB)
JPEG
(1.386 MB)
|
|
|
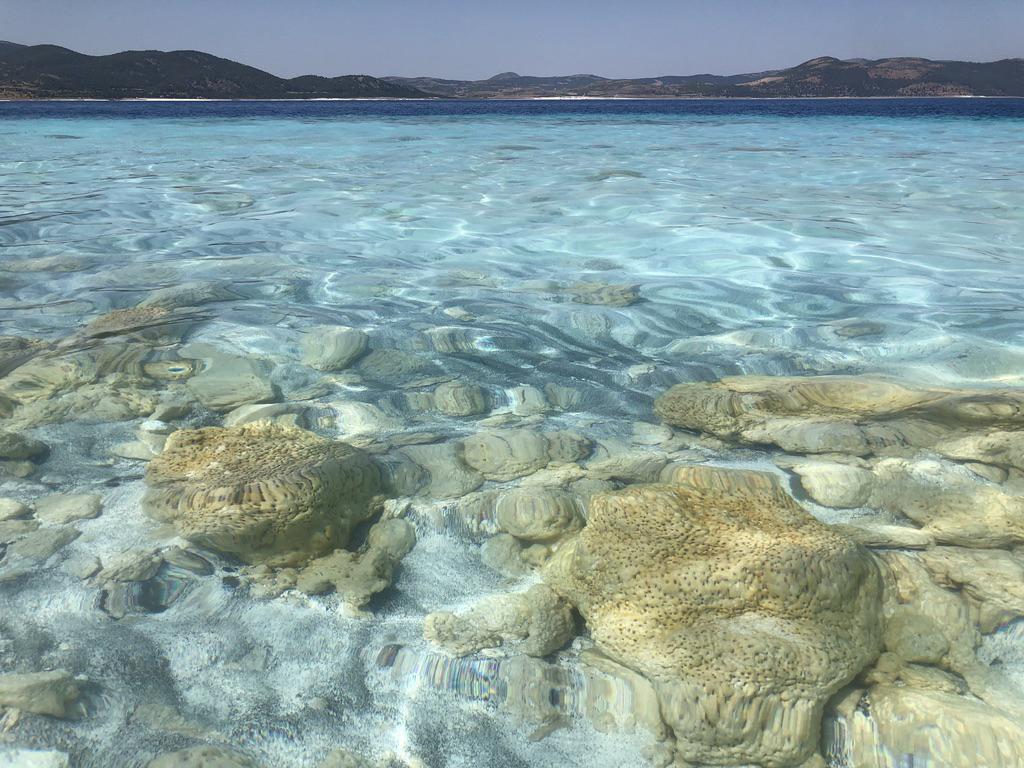
2021-01-27 |
Earth
|
|
|
1024x768x3 |

|
-
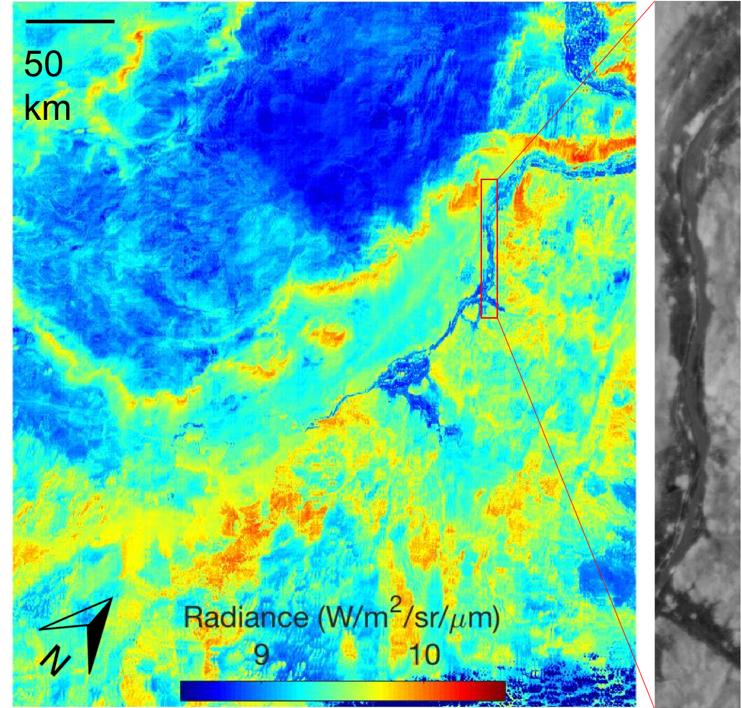
PIA24374:
-
Lake Salda Rocks
Full Resolution:
TIFF
(2.36 MB)
JPEG
(146.1 kB)
|
|
|
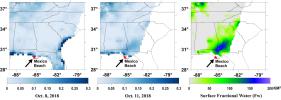
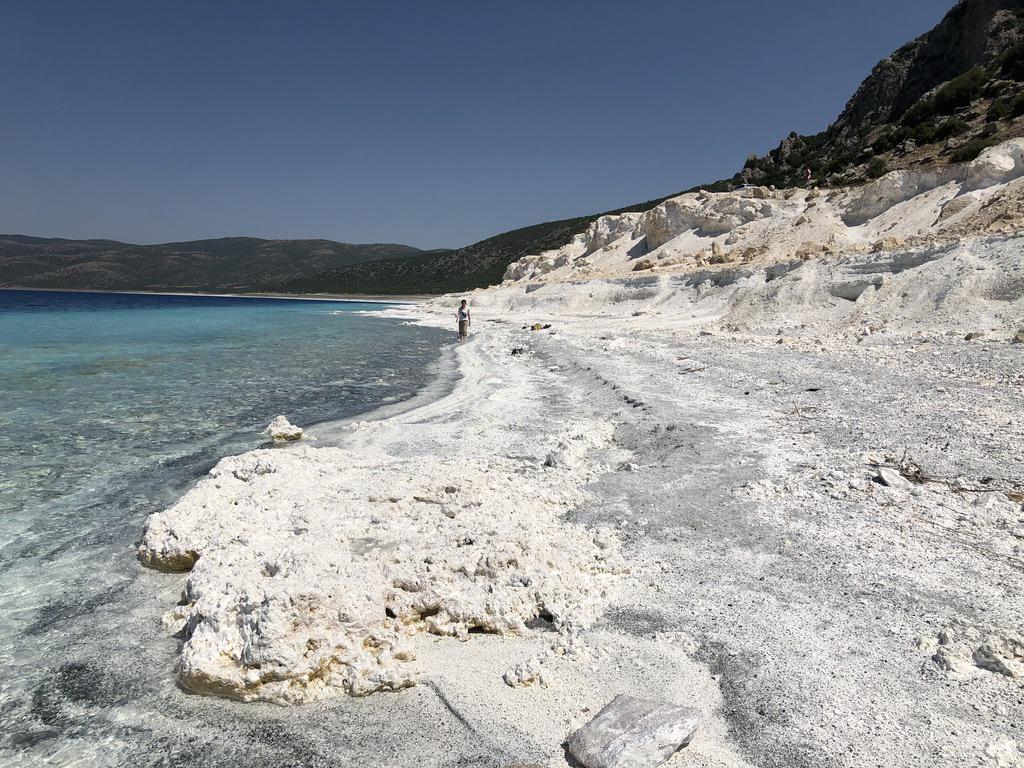
2021-01-27 |
Earth
|
|
|
1024x768x3 |

|
-
PIA24375:
-
Lake Salda Beach
Full Resolution:
TIFF
(2.112 MB)
JPEG
(189.6 kB)
|
|
|
2021-02-17 |
Earth
|
Mars 2020 Project
|
|
6000x4000x3 |
|
-
PIA24240:
-
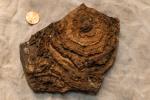
Tumbiana Stromatolite
Full Resolution:
TIFF
(66.96 MB)
JPEG
(3.093 MB)
|
|
|
2021-04-21 |
Moon
|
Apollo
|
|
3294x3226x3 |
|
-
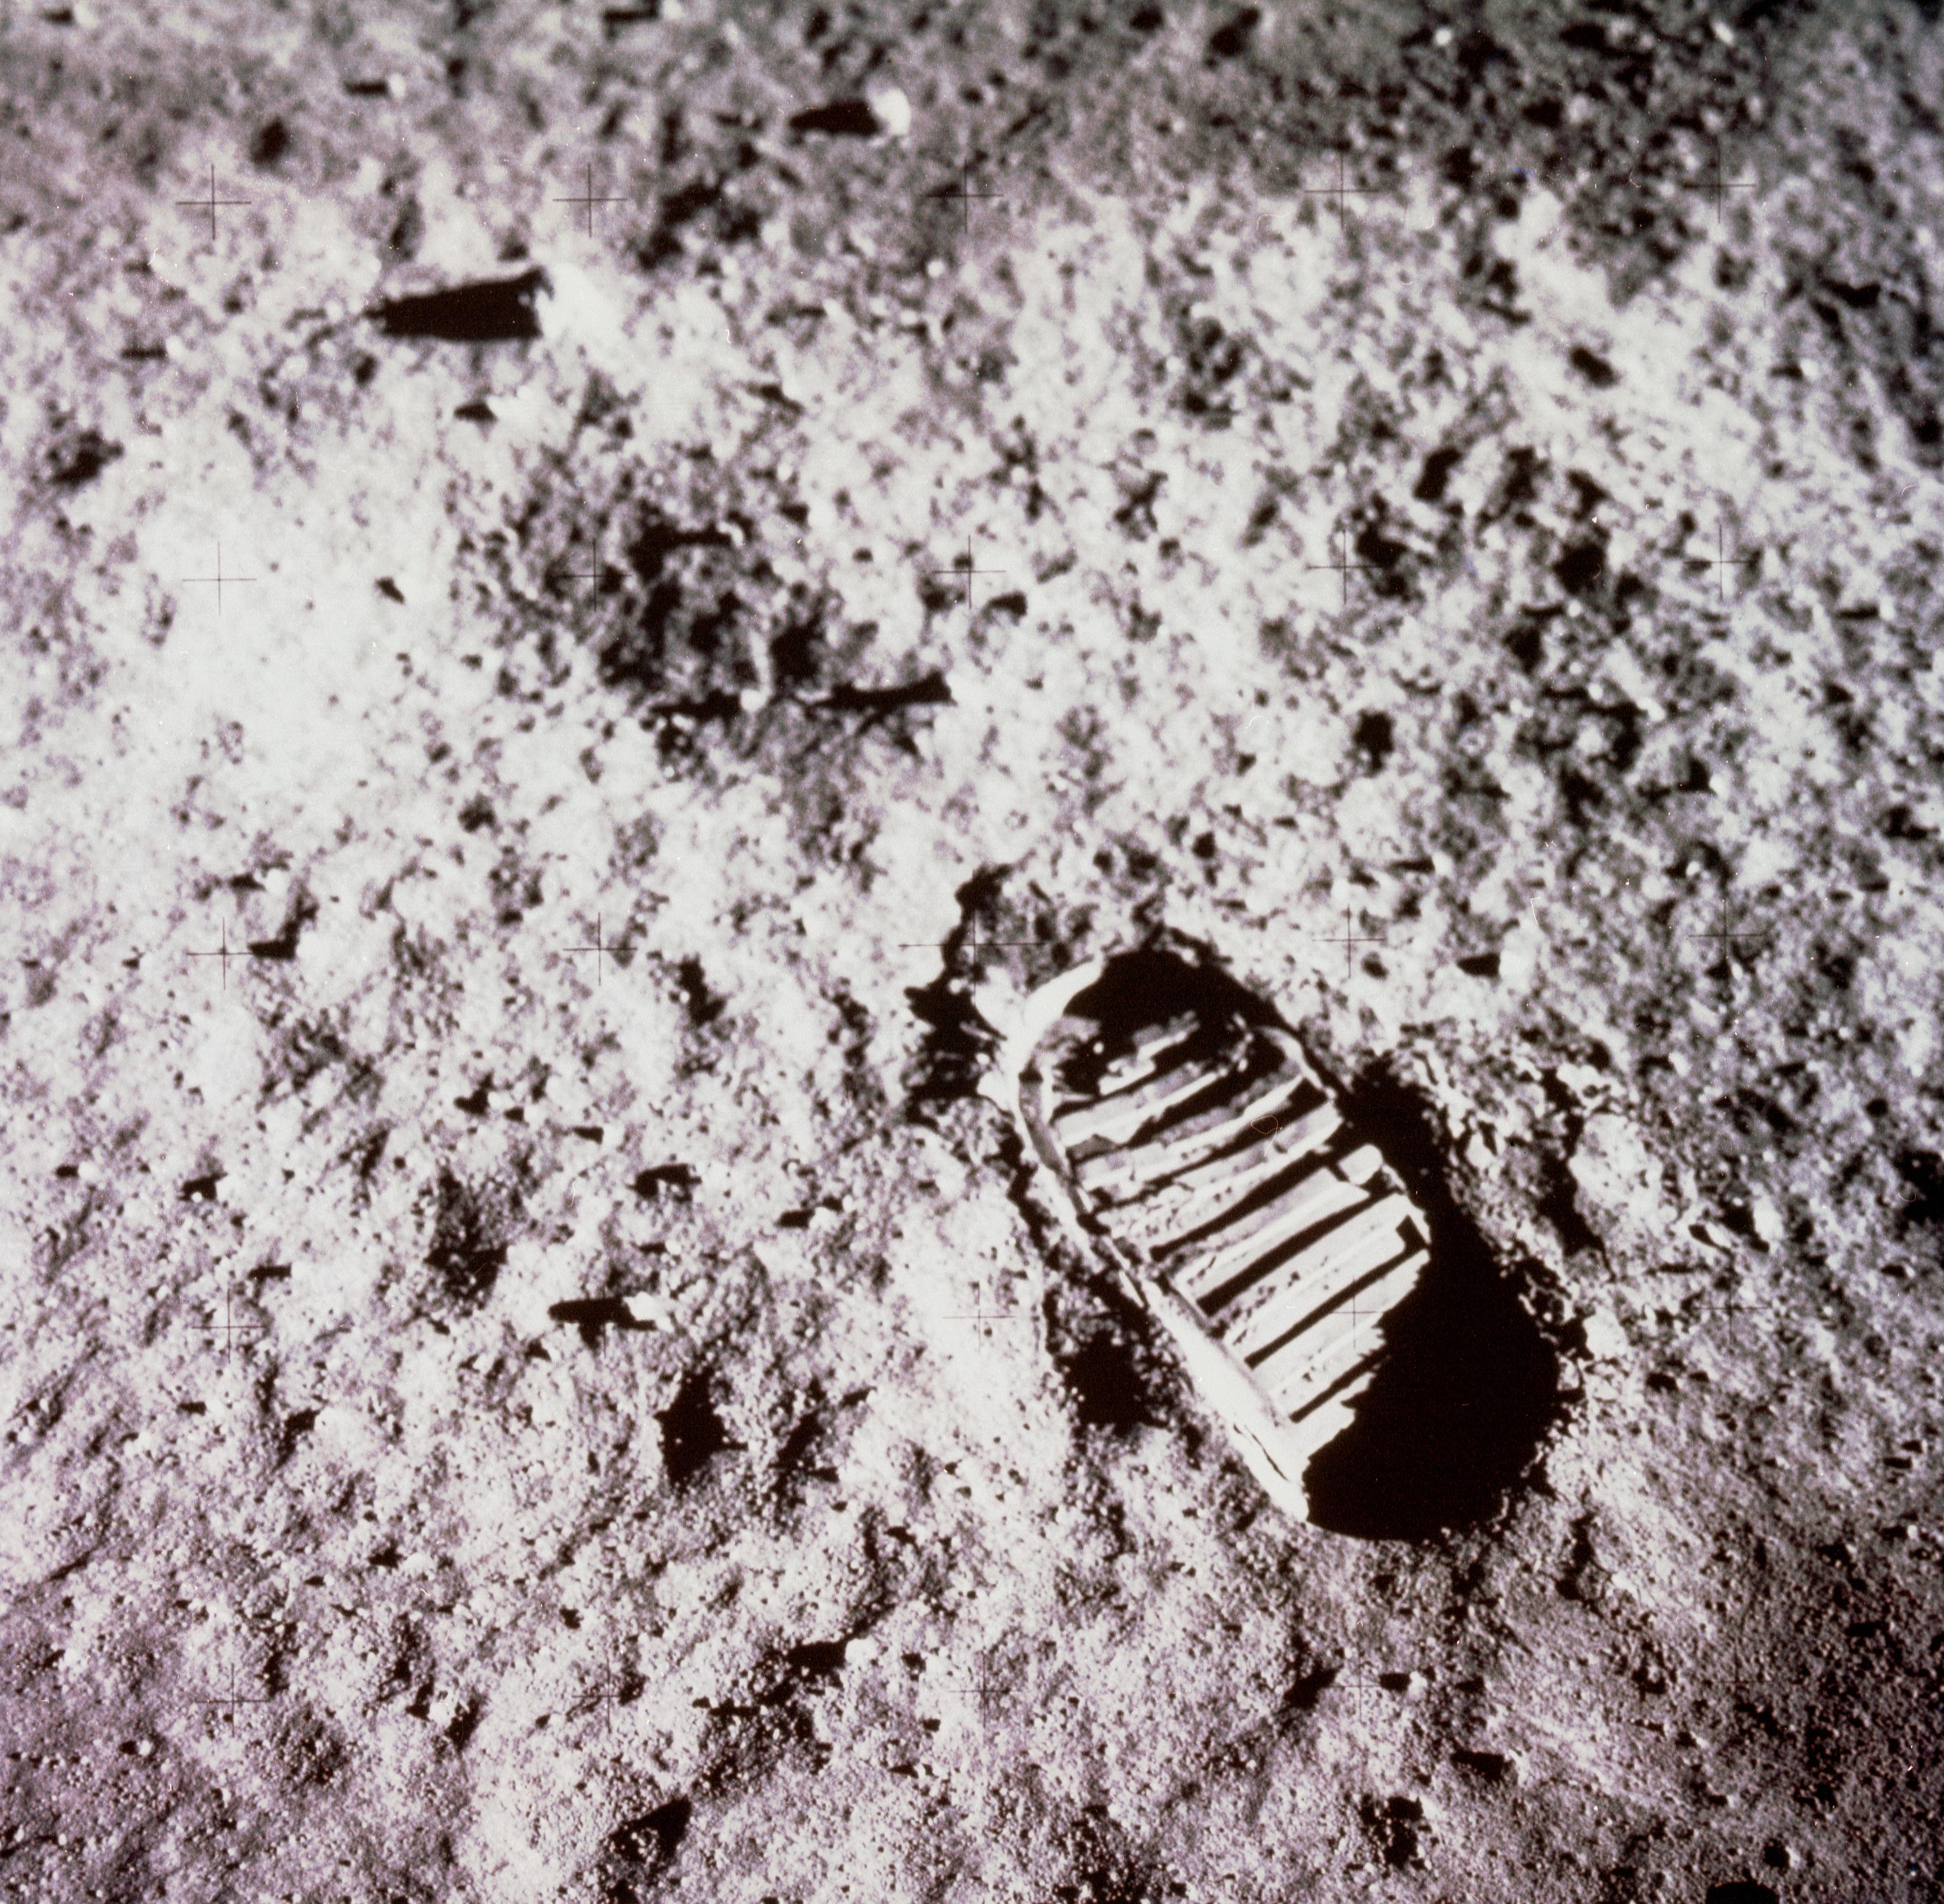
PIA24439:
-
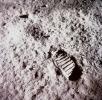
Apollo Footprint
Full Resolution:
TIFF
(31.89 MB)
JPEG
(1.648 MB)
|
|
|
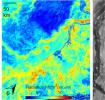
2021-06-21 |
Earth
|
Sentinel-6/Jason-CS
|
|
1536x1024x3 |
|
-
PIA24533:
-
Sentinel-6 Michael Freilich Sea Surface Height
Full Resolution:
TIFF
(1.492 MB)
JPEG
(78.4 kB)
|
|
|
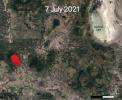
2021-07-15 |
Earth
|
ECOSTRESS
|
|
1984x2041x3 |
|
-
PIA23694:
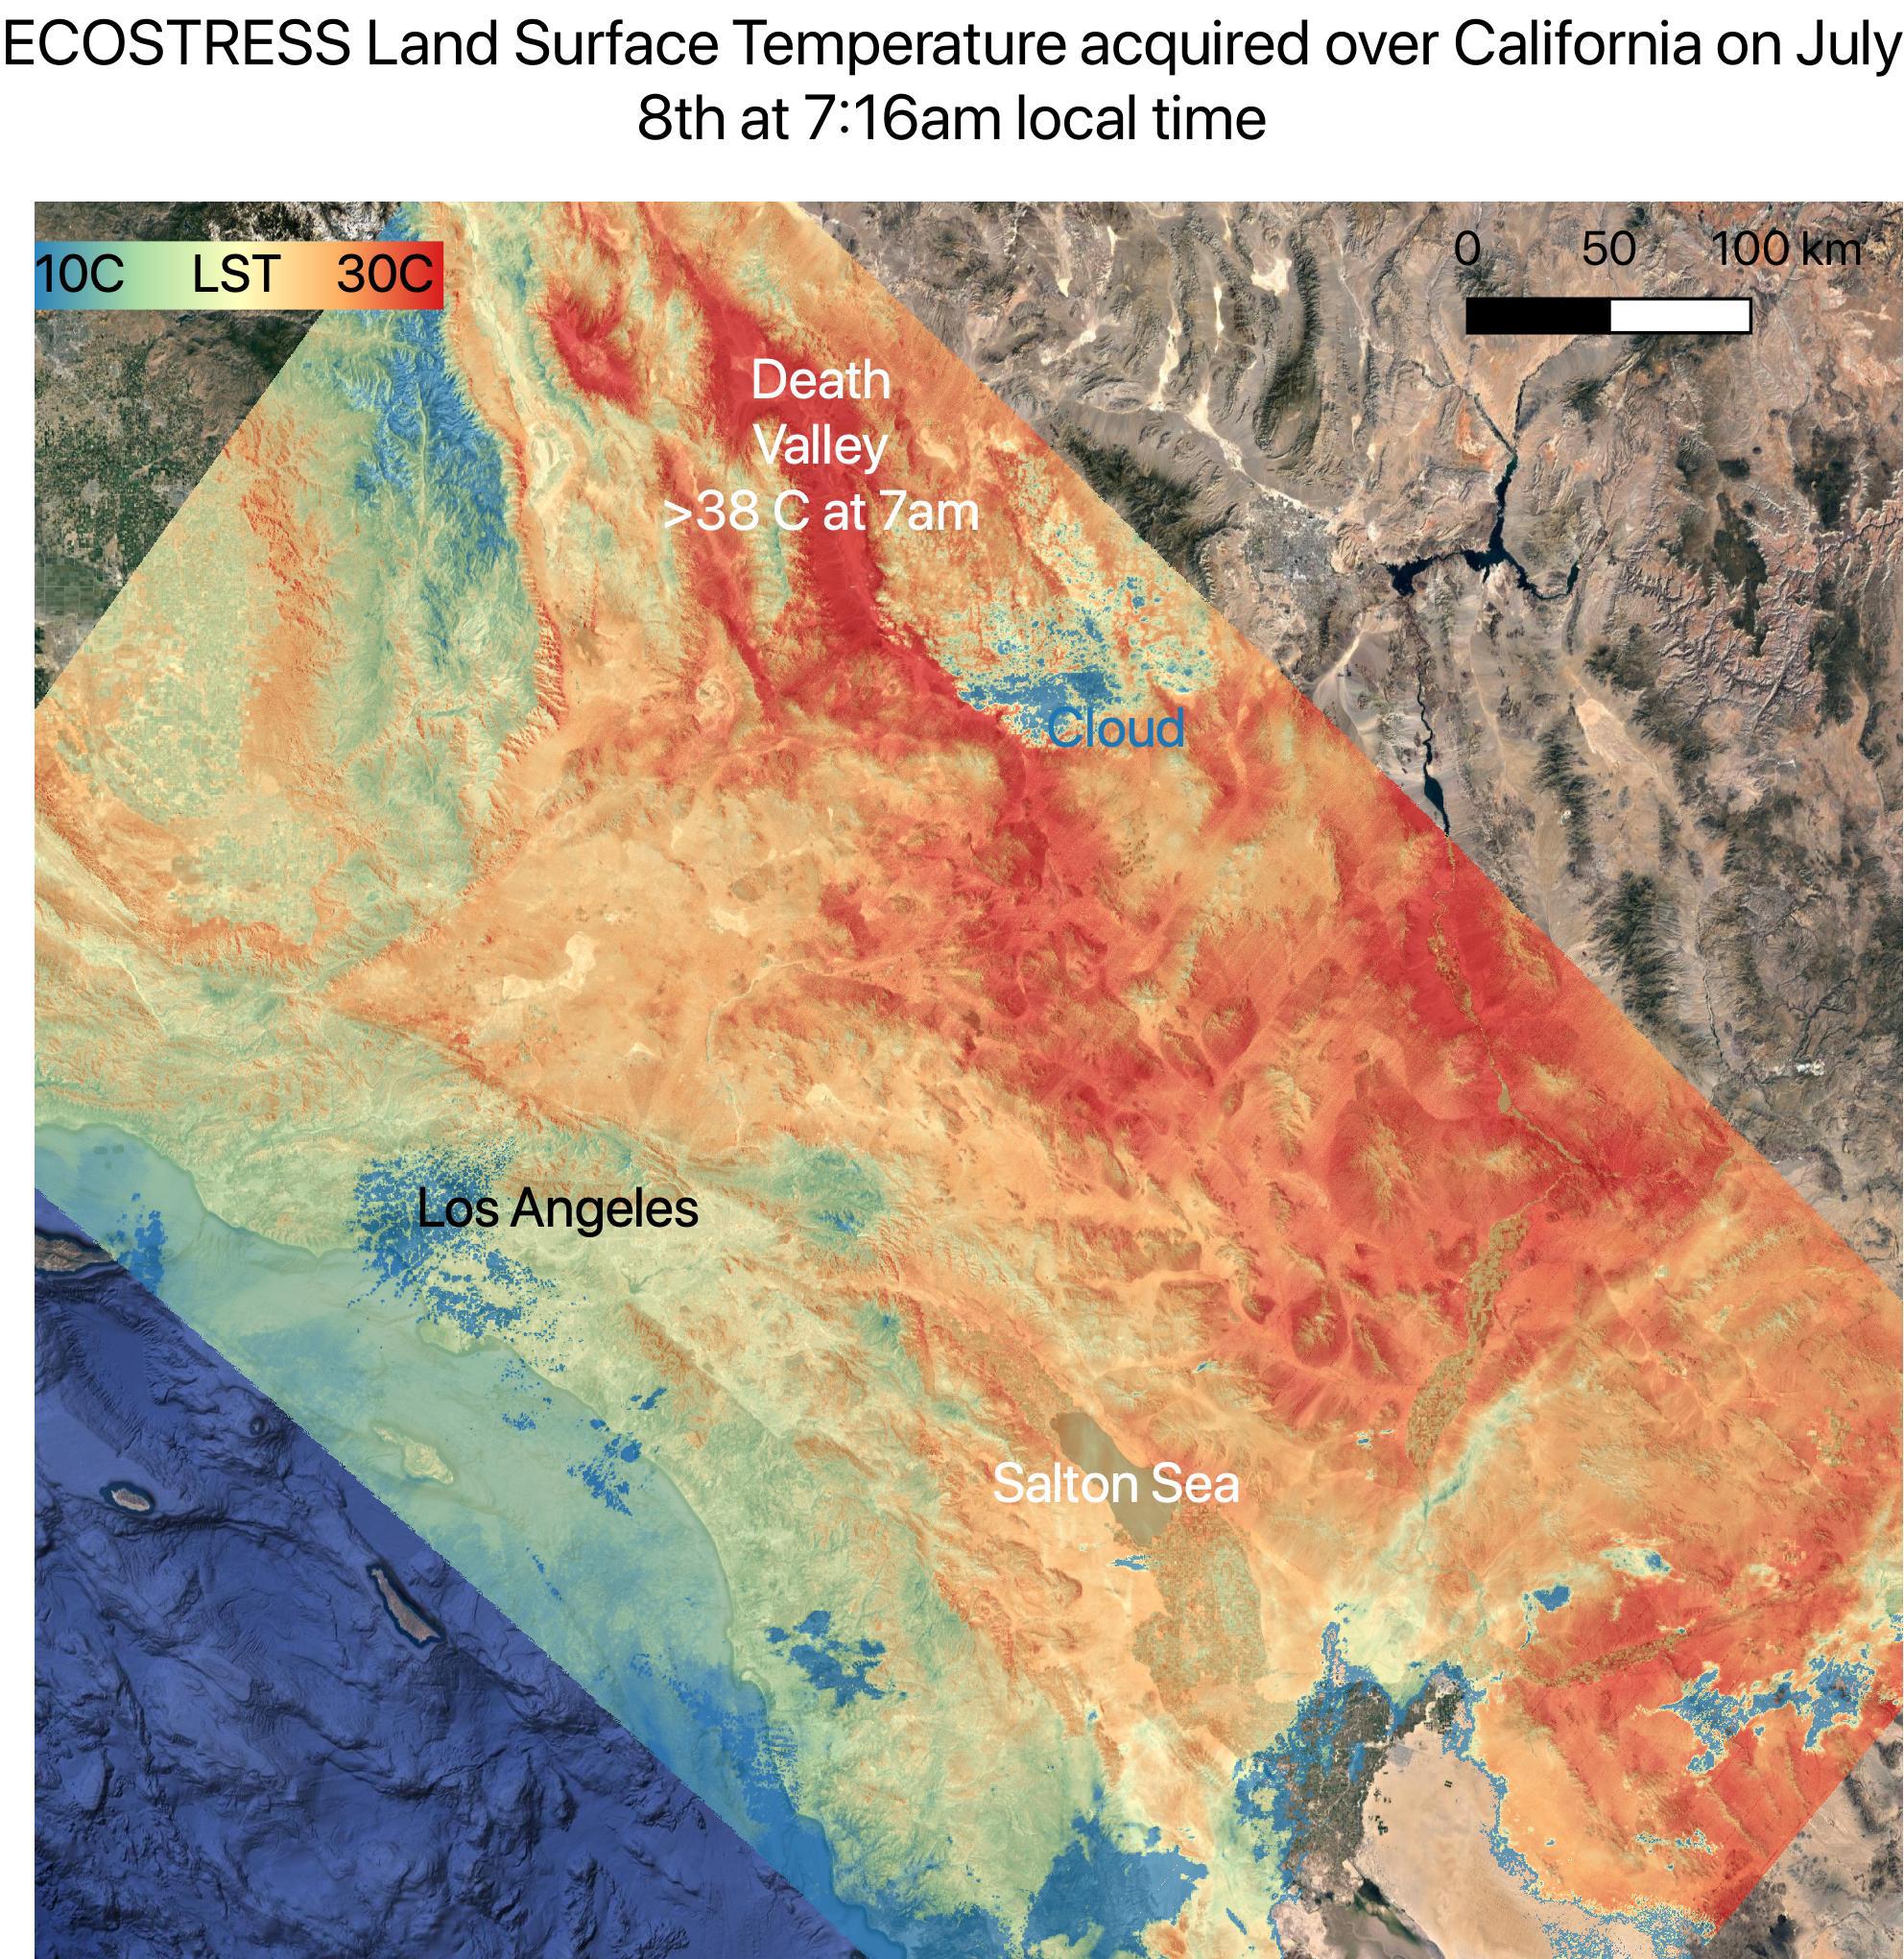
-
July 2021 Heat Wave Ground Temperature
Full Resolution:
TIFF
(12.15 MB)
JPEG
(746.2 kB)
|
|
|
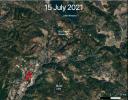
2021-07-29 |
Earth
|
ECOSTRESS
|
|
827x679x3 |
|
-
PIA23695:
-
ECOSTRESS Views 2021 Southern Oregon Bootleg Fire
Full Resolution:
TIFF
(1.685 MB)
JPEG
(109.8 kB)
|
|
|
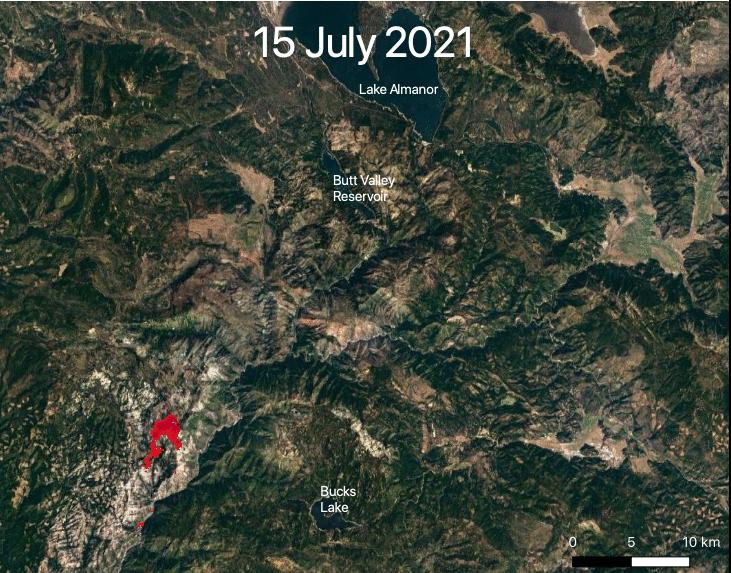
2021-07-29 |
Earth
|
ECOSTRESS
|
|
731x573x3 |
|
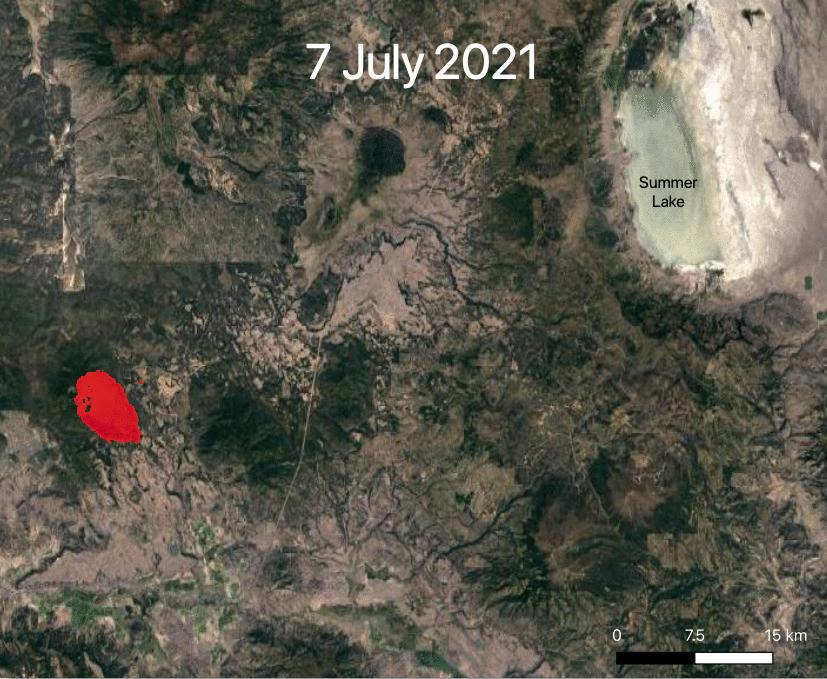
-
PIA23696:
-
ECOSTRESS Views 2021 Northern California Dixie Fire
Full Resolution:
TIFF
(1.257 MB)
JPEG
(113.3 kB)
|
|
|
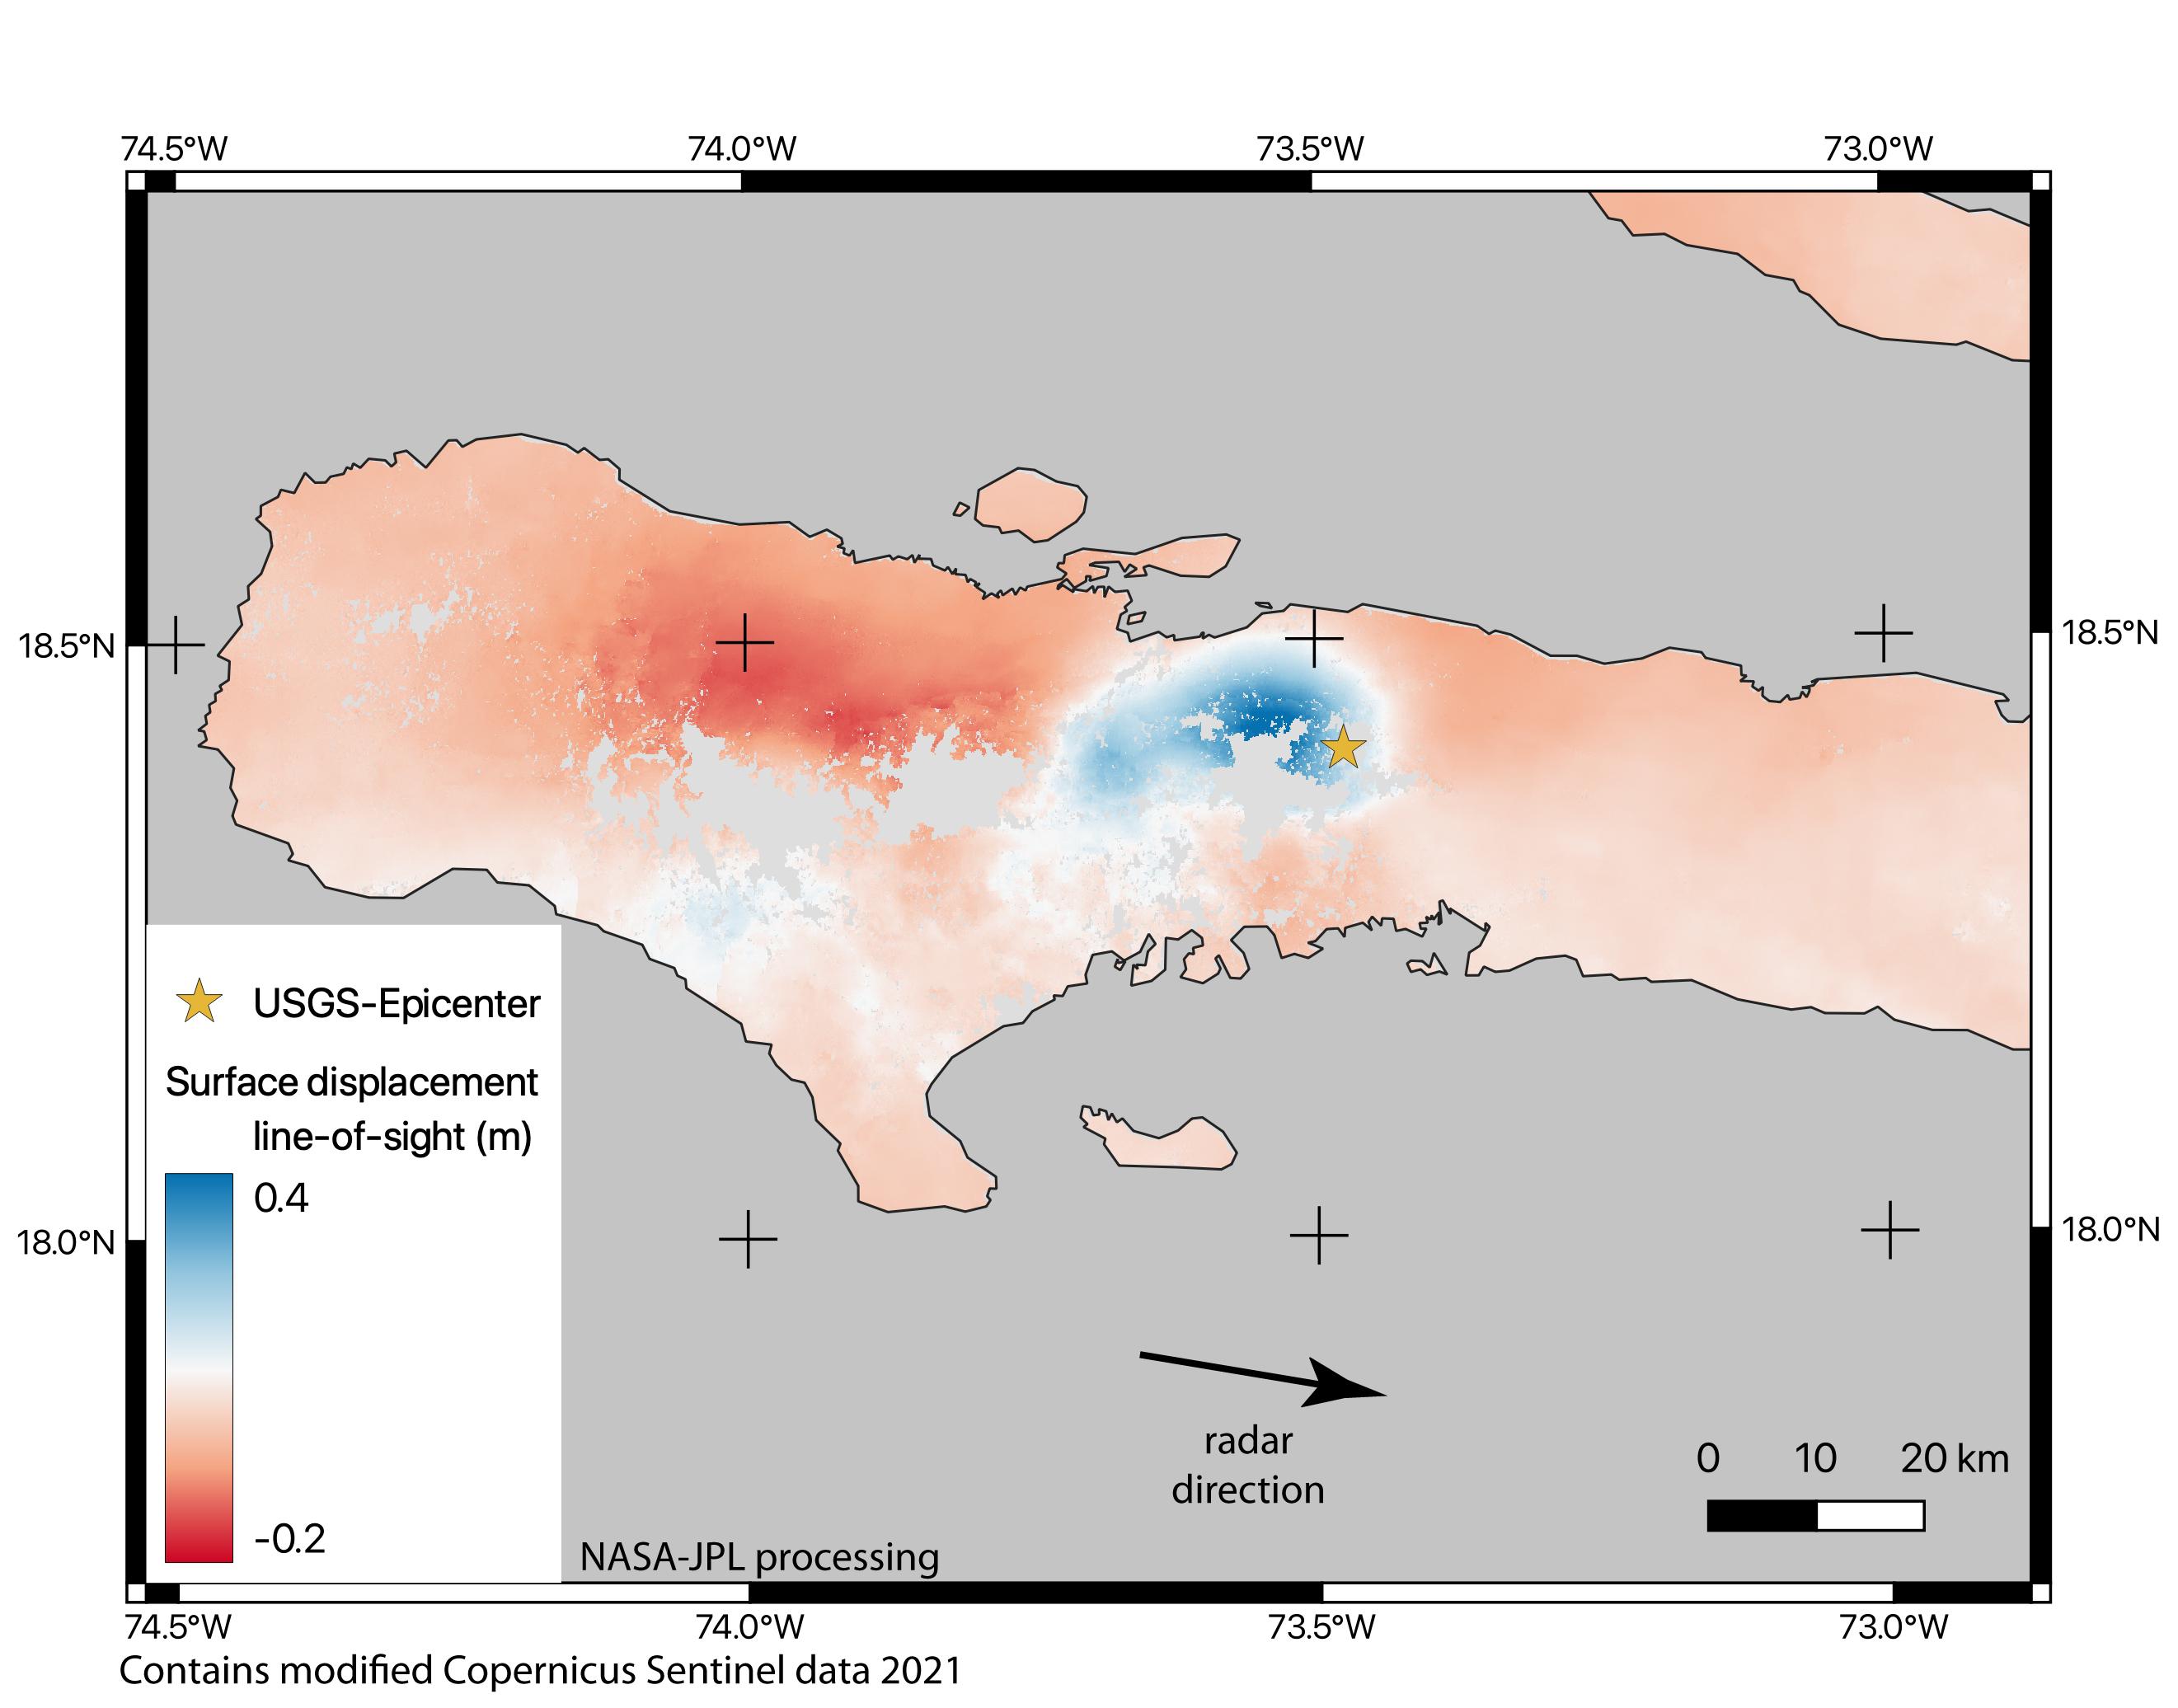
2021-08-17 |
Earth
|
ARIA
|
|
2642x2072x3 |
|
-
PIA23697:
-
Satellite Data Shows Ground Motion from August 2021 Haiti Earthquake
Full Resolution:
TIFF
(2.886 MB)
JPEG
(298.8 kB)
|
|
|
2021-10-07 |
Earth
|
ECOSTRESS
|
|
3507x2480x3 |
|
-
PIA24209:
-
Glass Fire, September 27, 2020
Full Resolution:
TIFF
(14.05 MB)
JPEG
(854.1 kB)
|
|
|
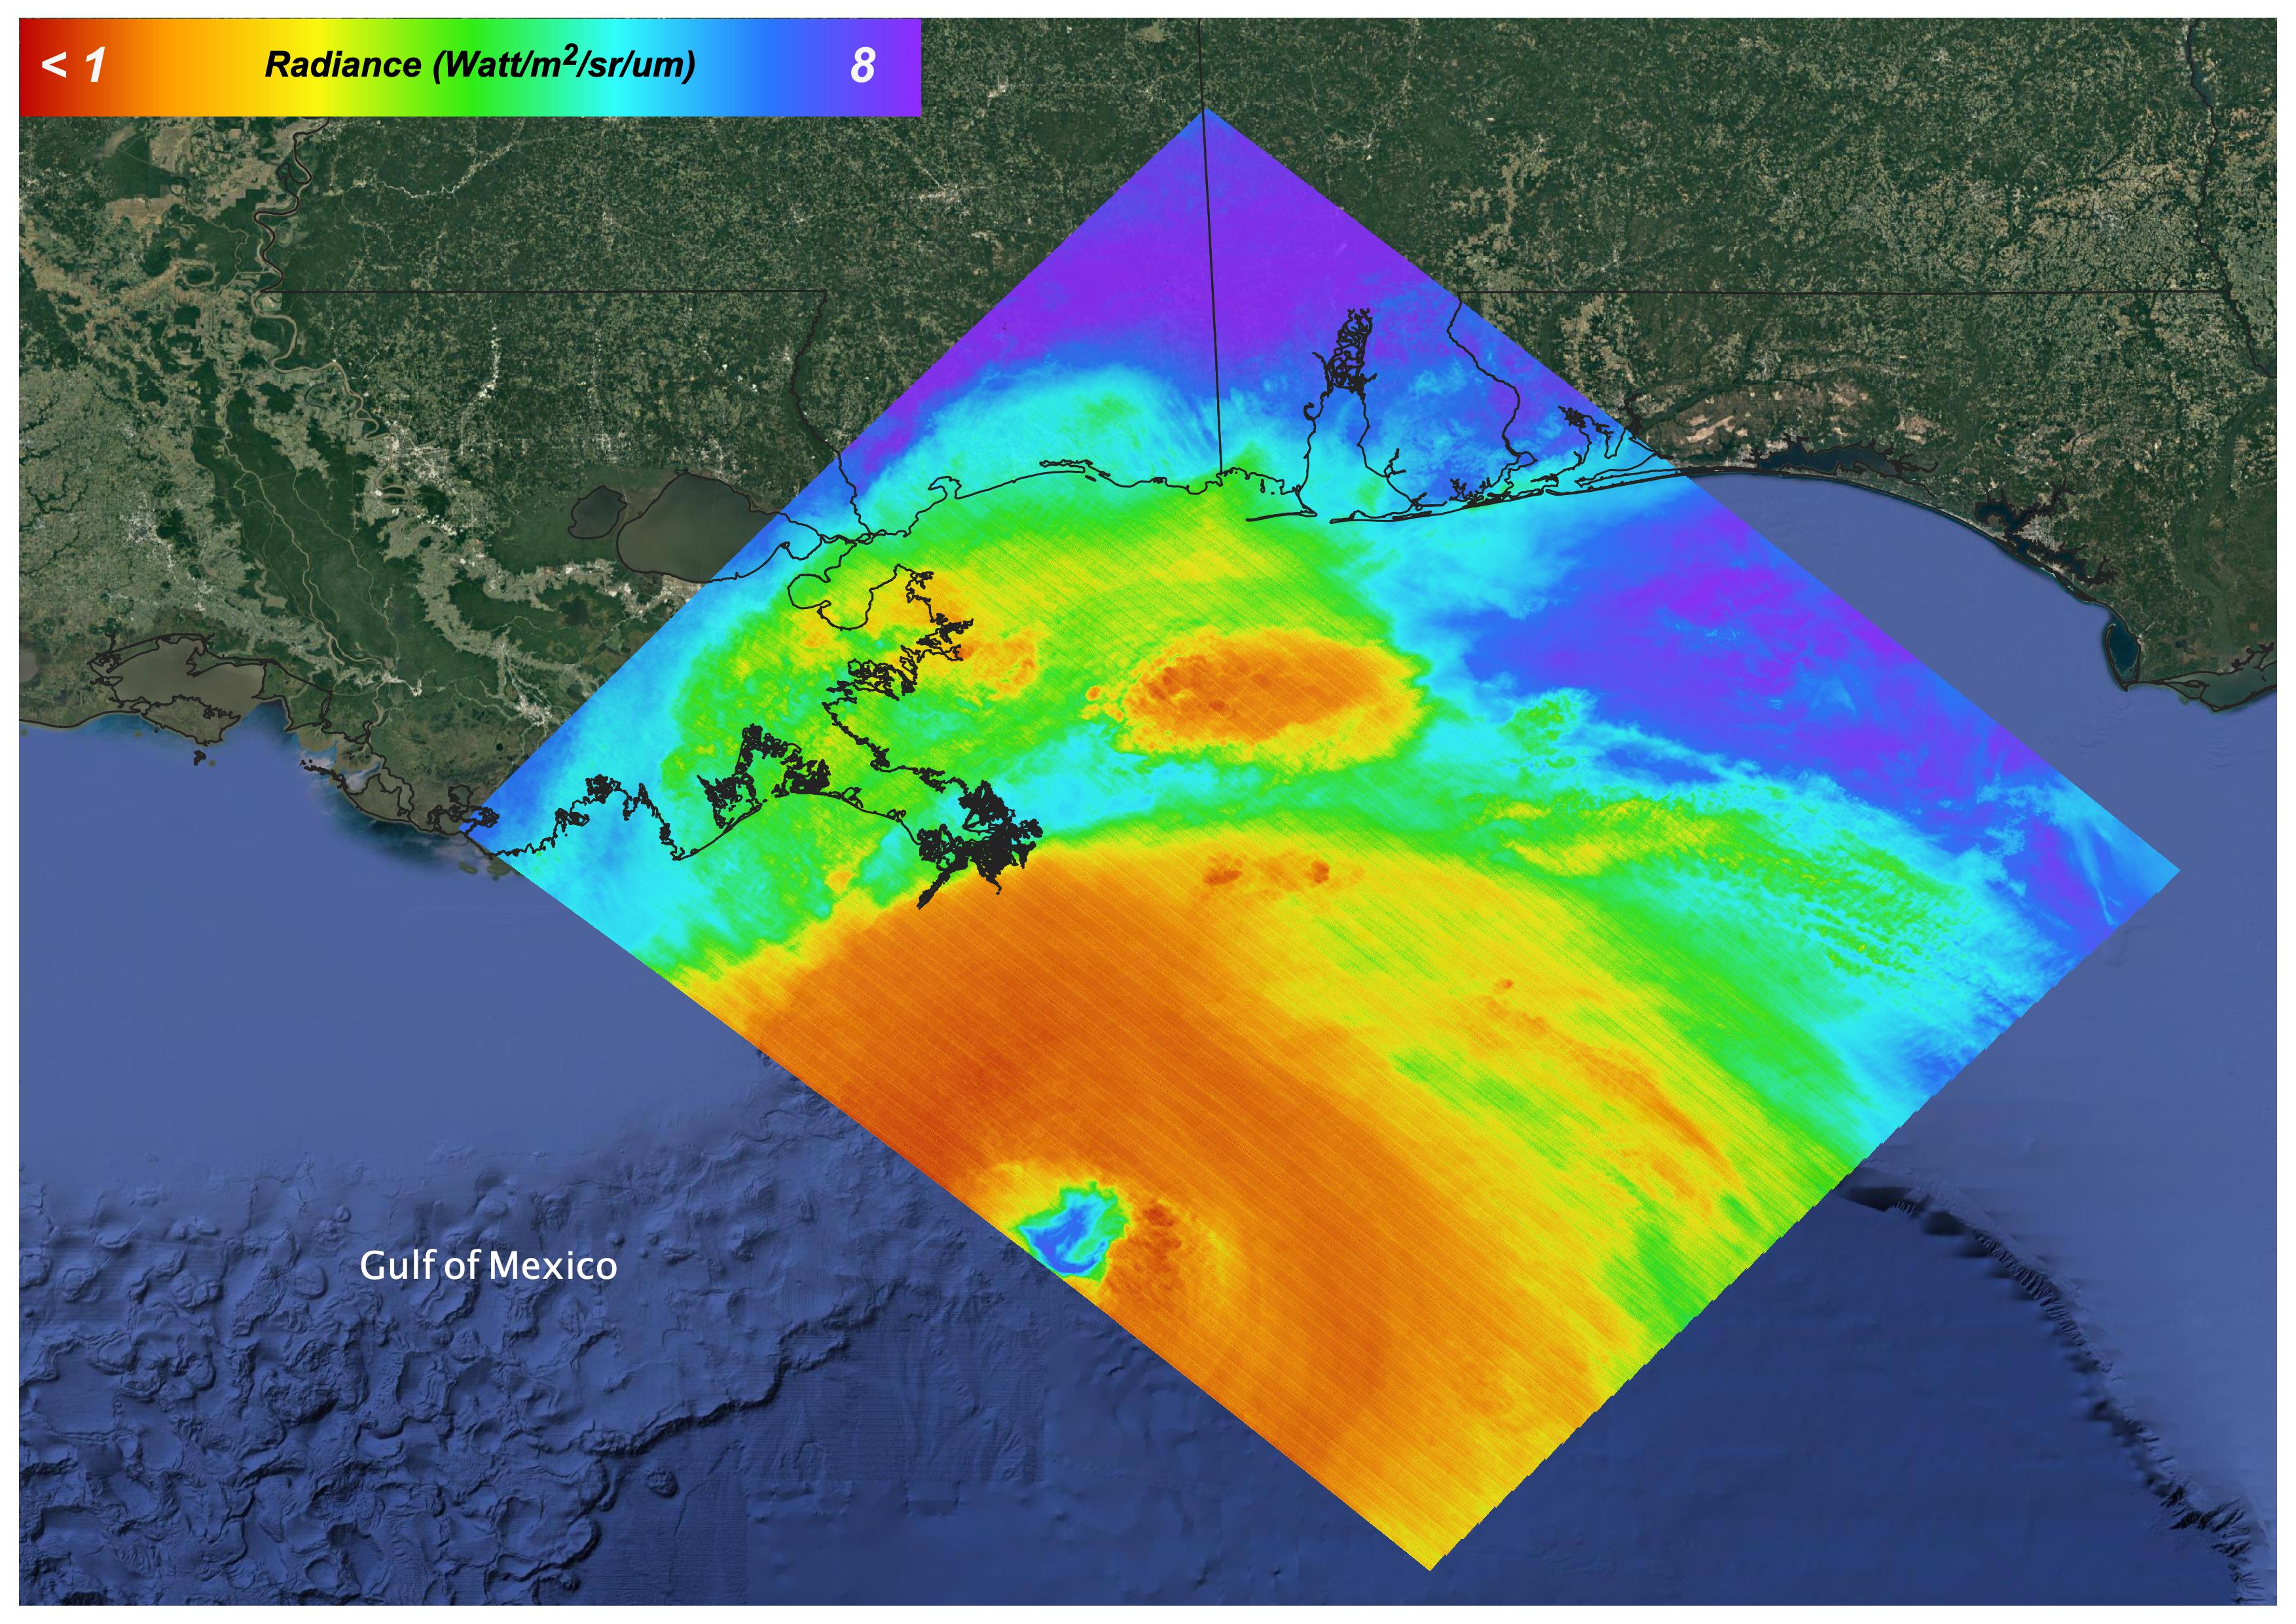
2021-10-07 |
Earth
|
ECOSTRESS
|
|
3507x2480x3 |
|
-
PIA24210:
-
Hurricane Ida, August 27, 2021
Full Resolution:
TIFF
(21.59 MB)
JPEG
(1.144 MB)
|
|
|
2021-10-27 |
Earth
|
ECOSTRESS
|
|
3507x2480x3 |
|
-
PIA24916:
-
La Palma Volcano
Full Resolution:
TIFF
(16.12 MB)
JPEG
(719.5 kB)
|
|
|
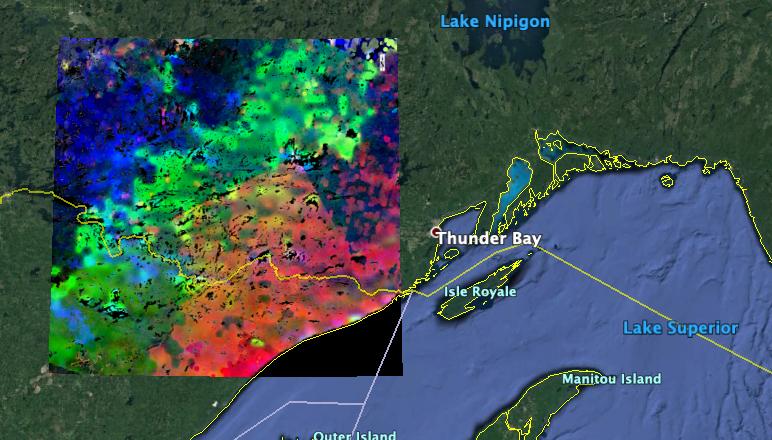
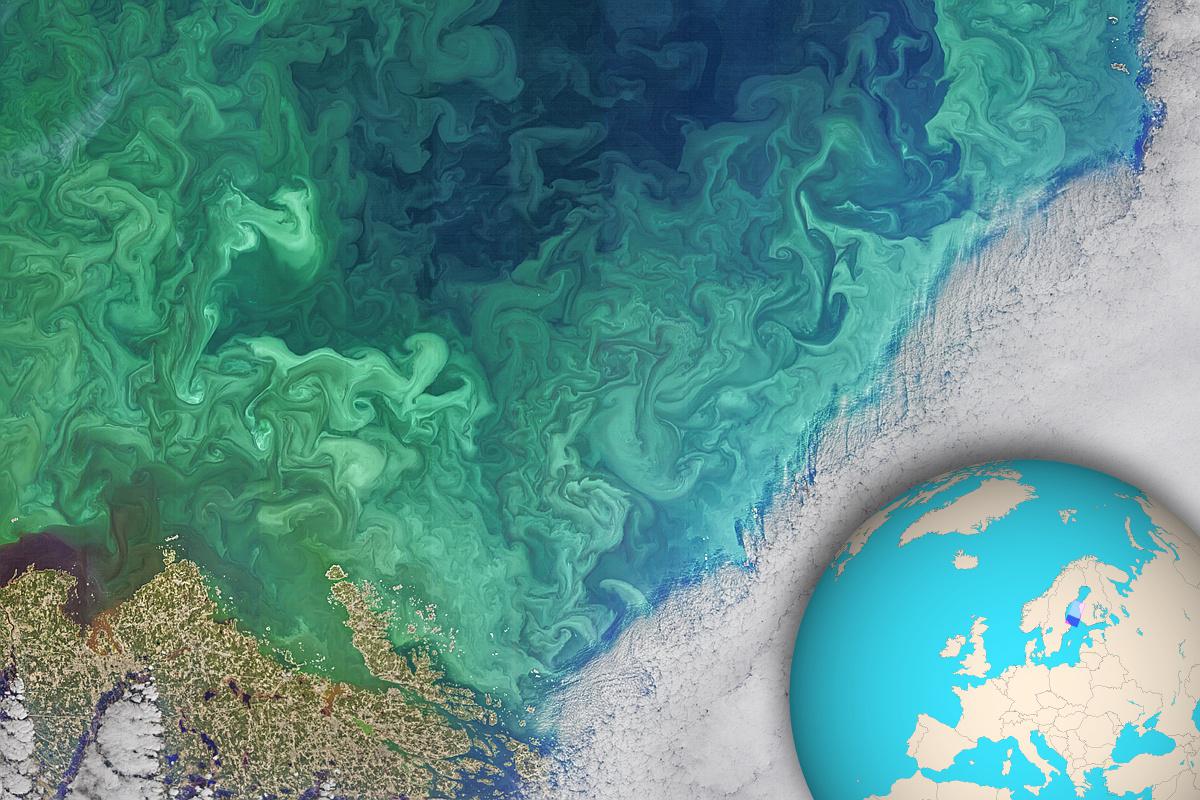
2021-12-17 |
Earth
|
Landsat
|
|
1200x800x3 |

|
-
PIA25033:
-
Phytoplankton Bloom in the South of Bothnia
Full Resolution:
TIFF
(2.881 MB)
JPEG
(176.5 kB)
|
|
|
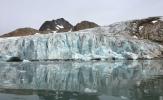
2022-01-26 |
Earth
|
OMG
|
|
4032x2471x3 |
|
-
PIA24983:
-
Apusiaajik Glacier, Greenland
Full Resolution:
TIFF
(24.23 MB)
JPEG
(1.213 MB)
|
|
|
2022-01-26 |
Earth
|
OMG
|
|
3024x2697x3 |

|
-
PIA24984:
-
NASA's OMG at Thule Air Base, Greenland
Full Resolution:
TIFF
(16.96 MB)
JPEG
(565.8 kB)
|
|
|
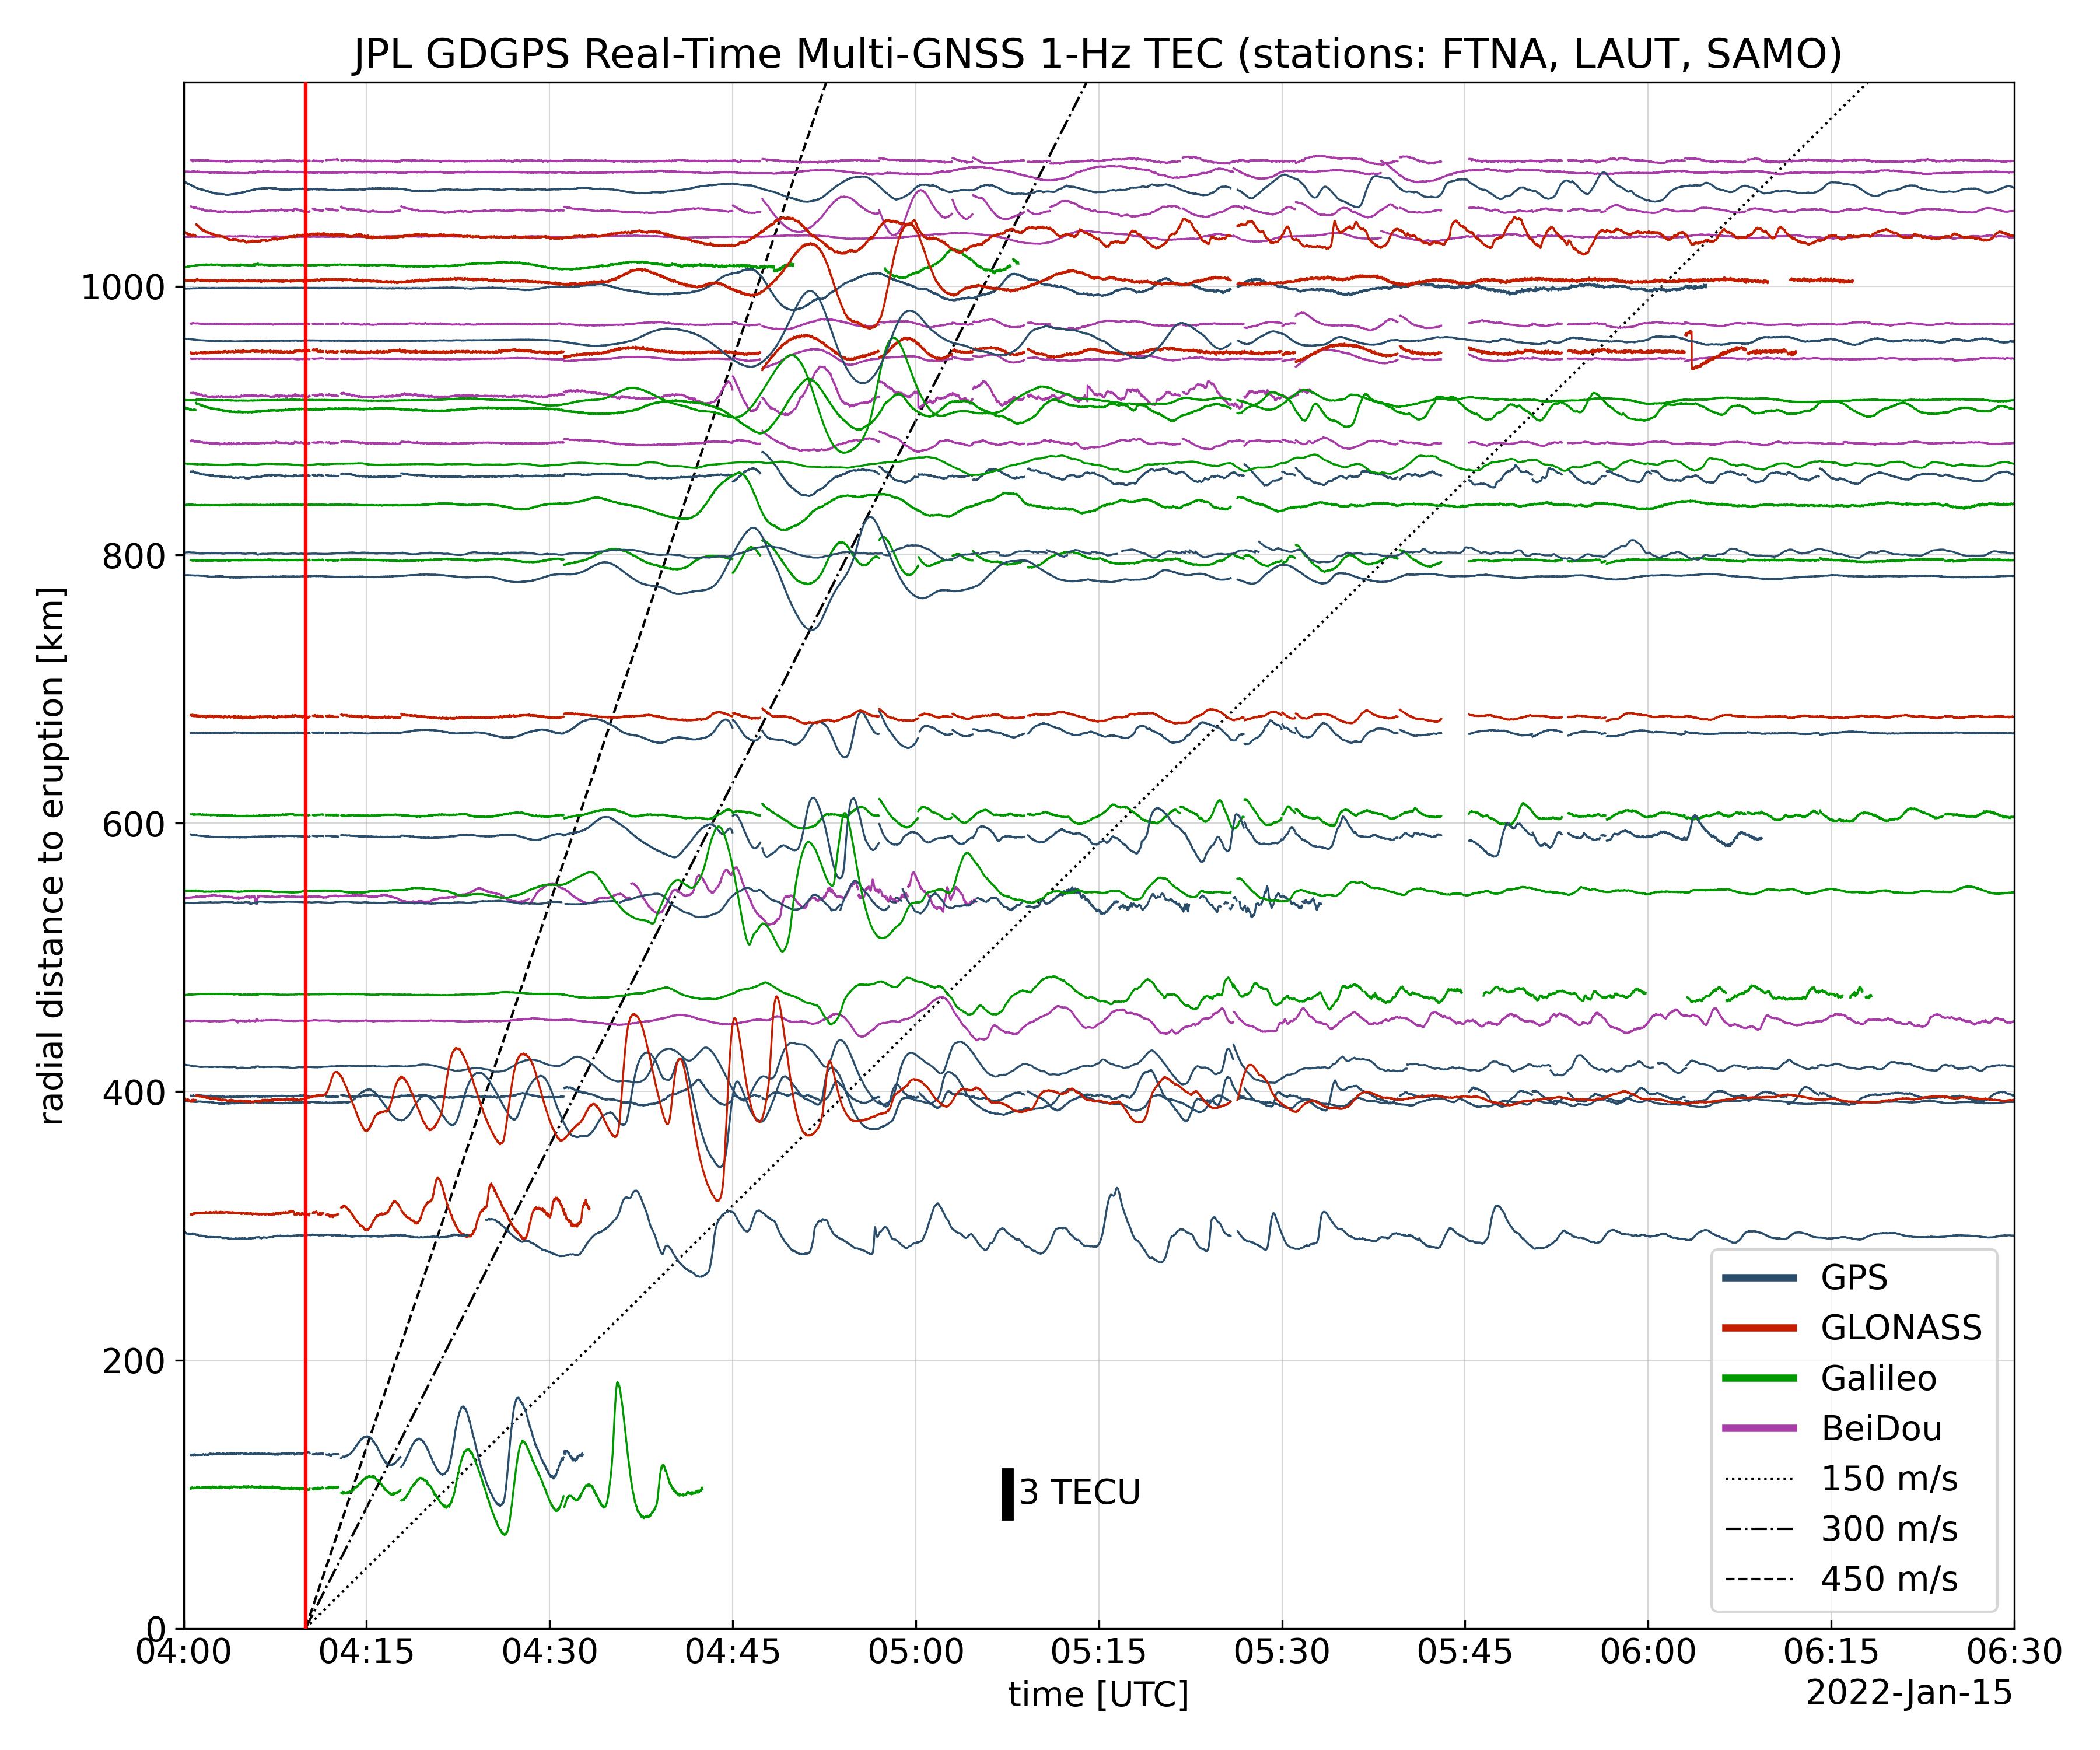
2022-01-27 |
Earth
|
Global Differential Global Positioning System (GDGPS)
|
|
3600x3000x3 |
|
-
PIA24905:
-
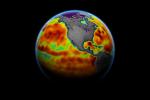
Tonga Eruption Atmospheric Wave
Full Resolution:
TIFF
(3.165 MB)
JPEG
(1.025 MB)
|
|
|
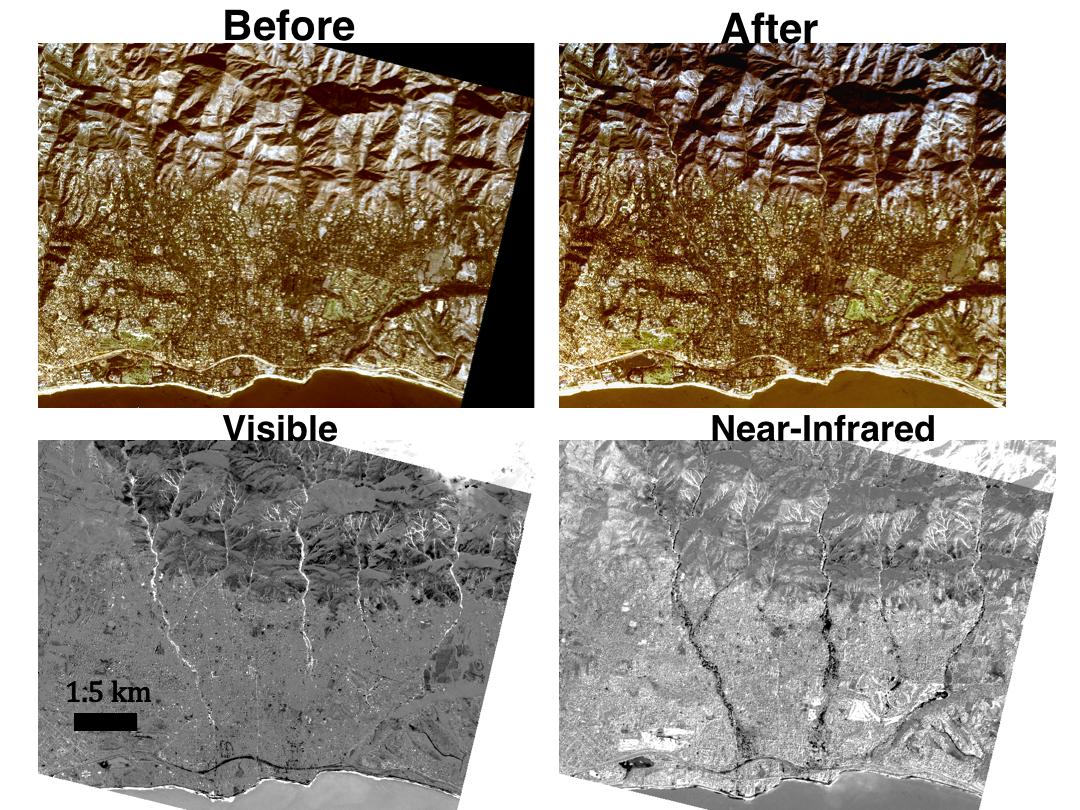
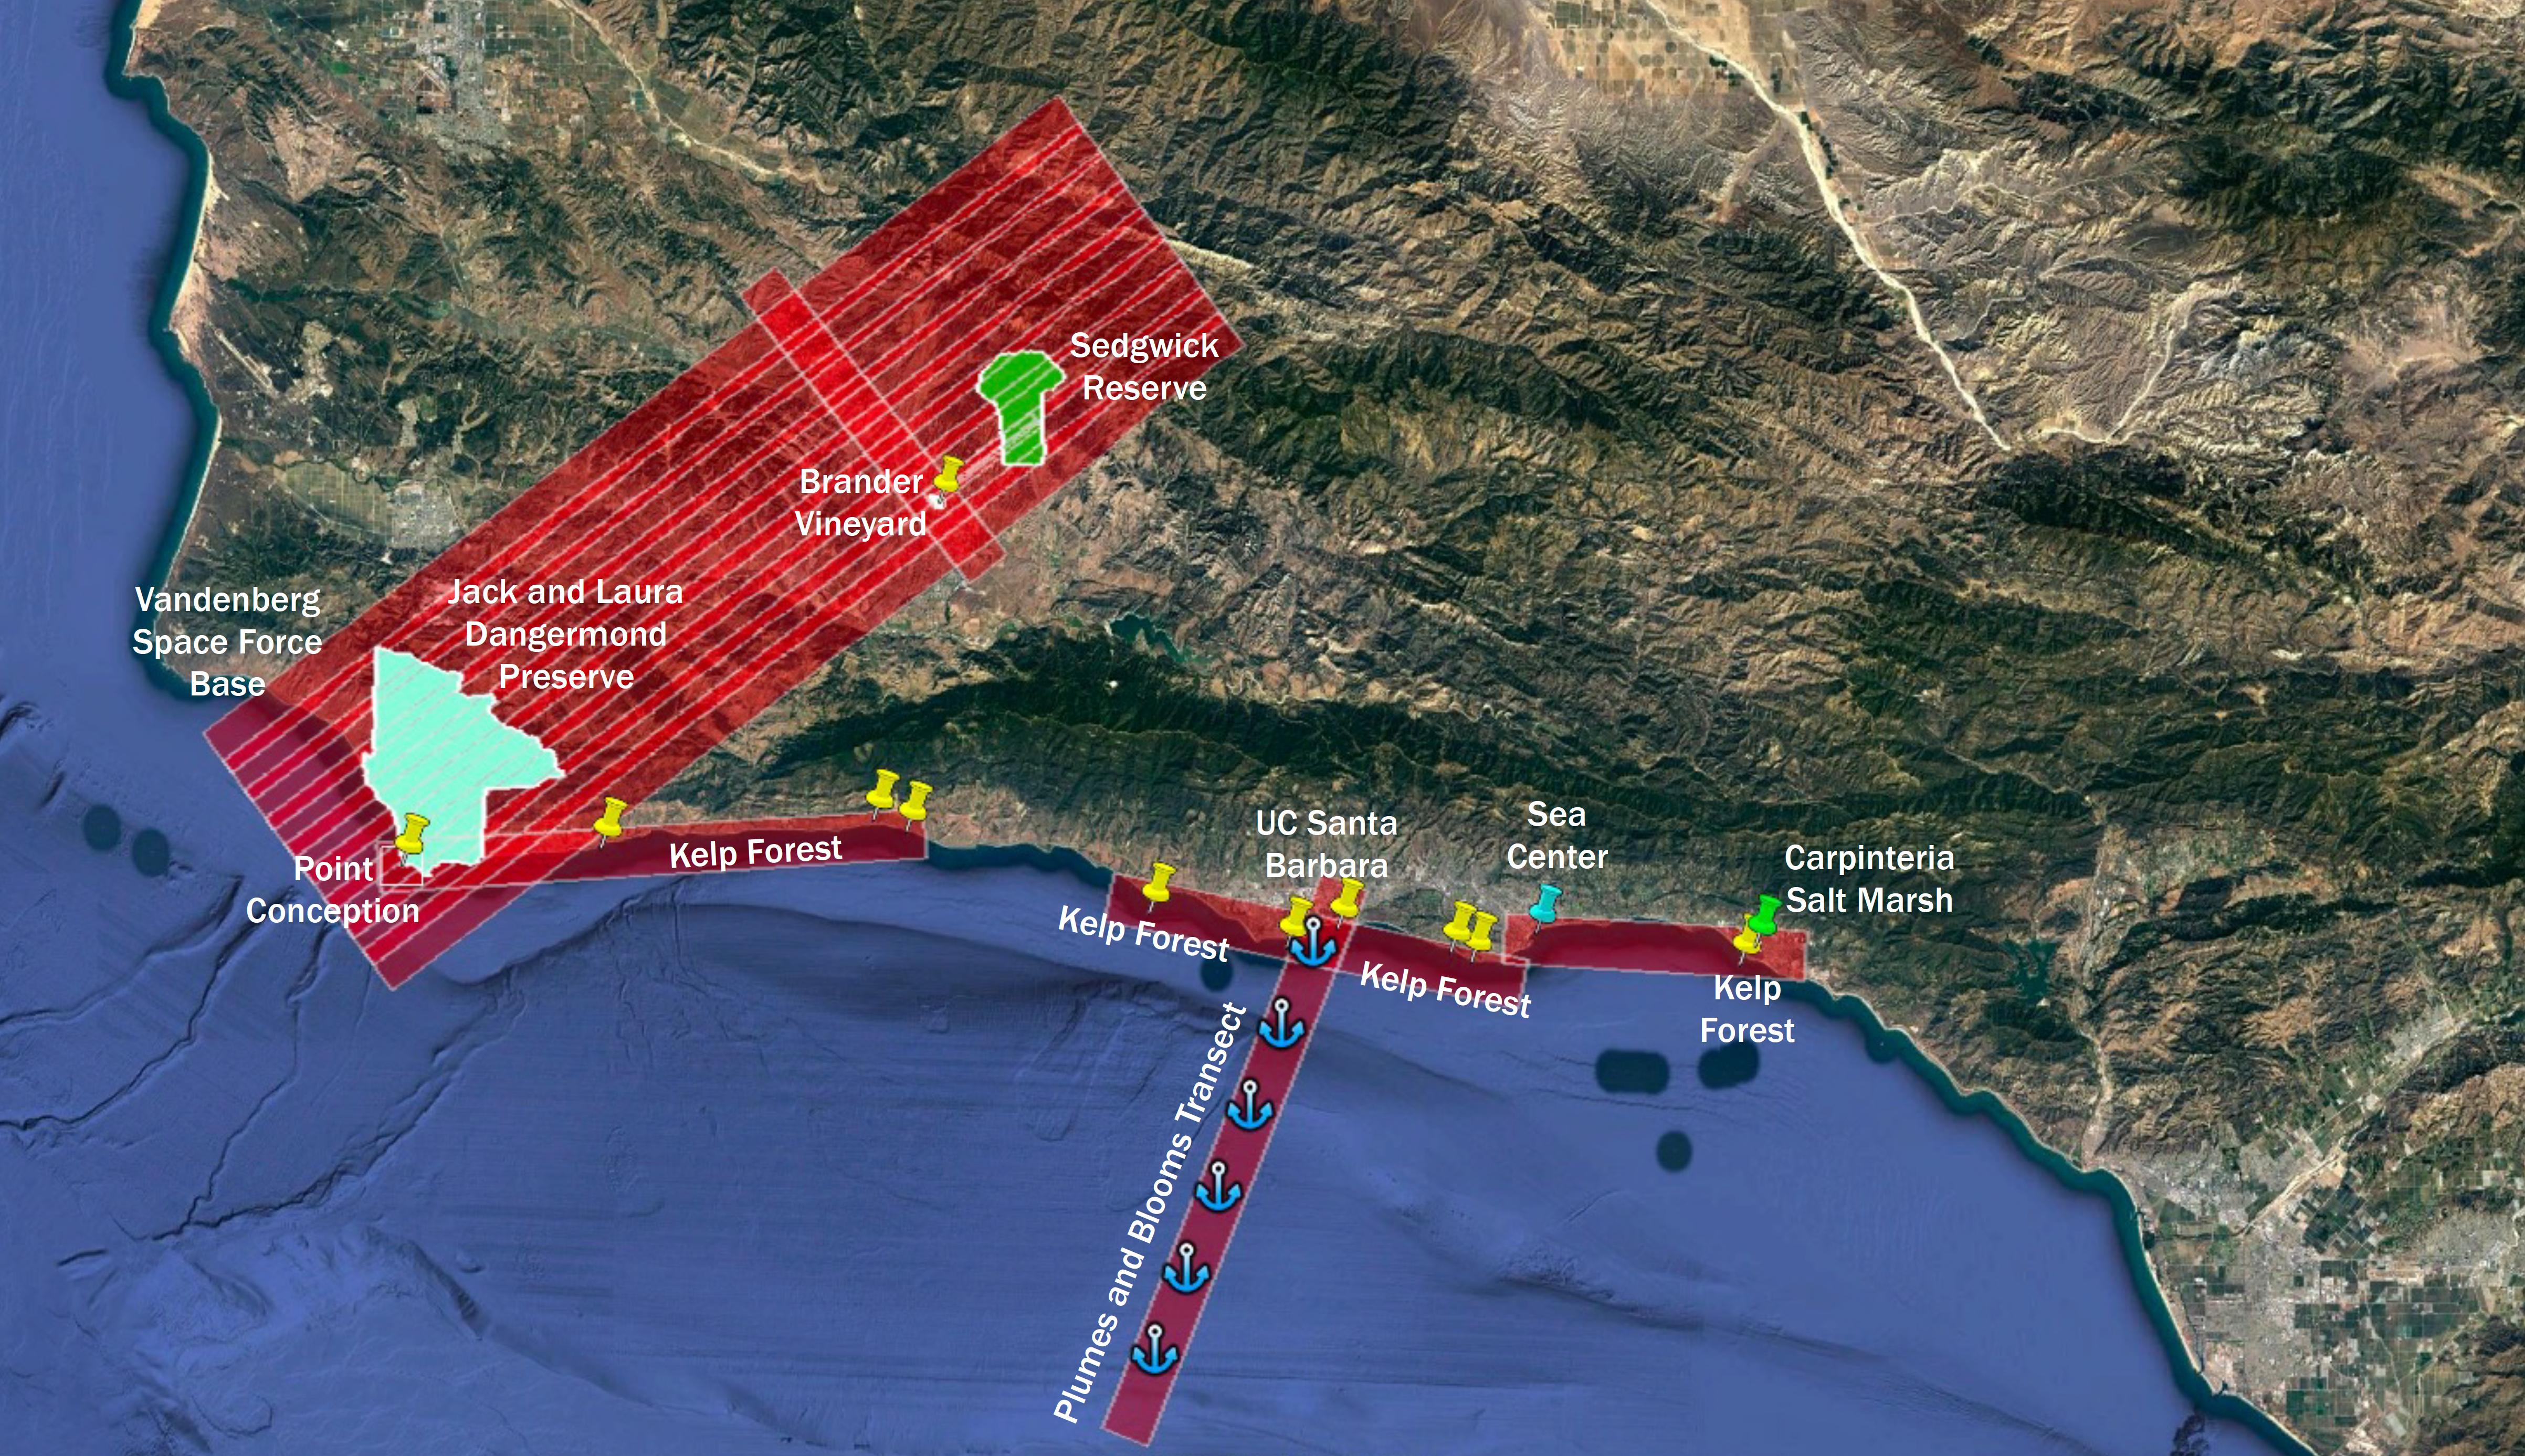
2022-04-18 |
Earth
|
Surface Biology and Geology High-Frequency Time Series (SHIFT)
|
|
4000x3000x3 |

|
-
PIA25143:
-
Aerial View of Point Conception, California, and the Dangermond Preserve
Full Resolution:
TIFF
(19 MB)
JPEG
(451.1 kB)
|
|
|
2022-04-18 |
Earth
|
Surface Biology and Geology High-Frequency Time Series (SHIFT)
|
|
4810x2774x3 |

|
-
PIA25144:
-
SHIFT Campaign Research Plane Flight Area Map
Full Resolution:
TIFF
(39.35 MB)
JPEG
(1.602 MB)
|
|
|
2022-05-12 |
Earth
|
ECOSTRESS
|
|
3376x2477x3 |
|
-
PIA24987:
-
ECOSTRESS Detects Heat Islands in Indian Heat Wave
Full Resolution:
TIFF
(25.1 MB)
JPEG
(2.193 MB)
|
|
|
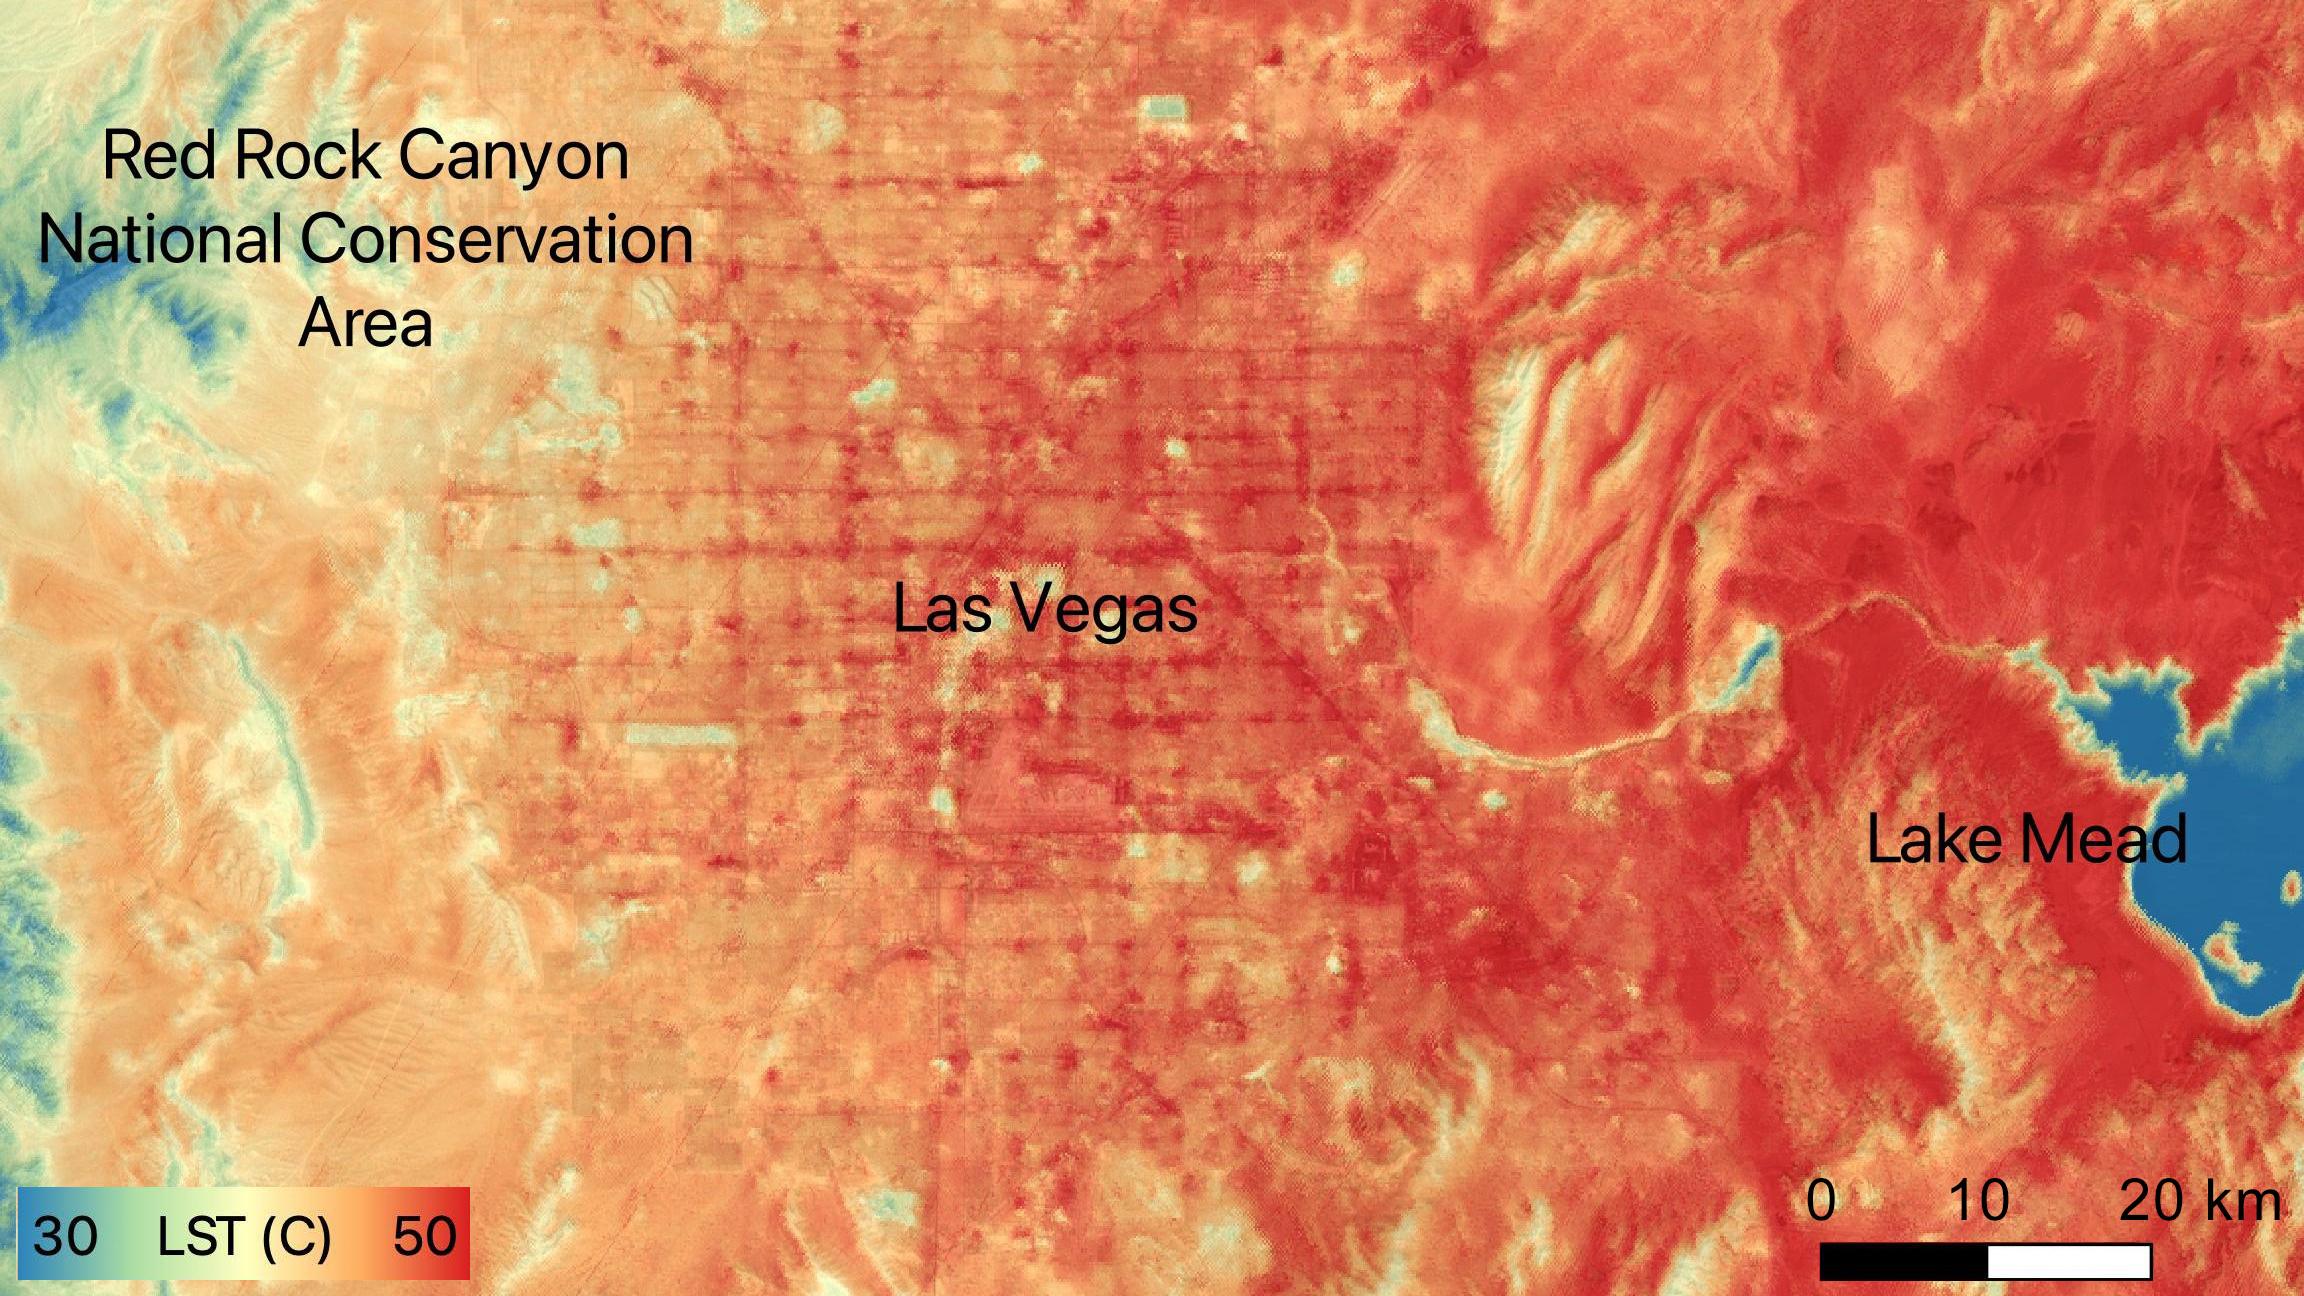
2022-06-15 |
Earth
|
ECOSTRESS
|
|
2304x1296x3 |

|
-
PIA24988:
-
NASA's ECOSTRESS Sees Las Vegas Streets Turn Up the Heat
Full Resolution:
TIFF
(8.962 MB)
JPEG
(479.4 kB)
|
|
|
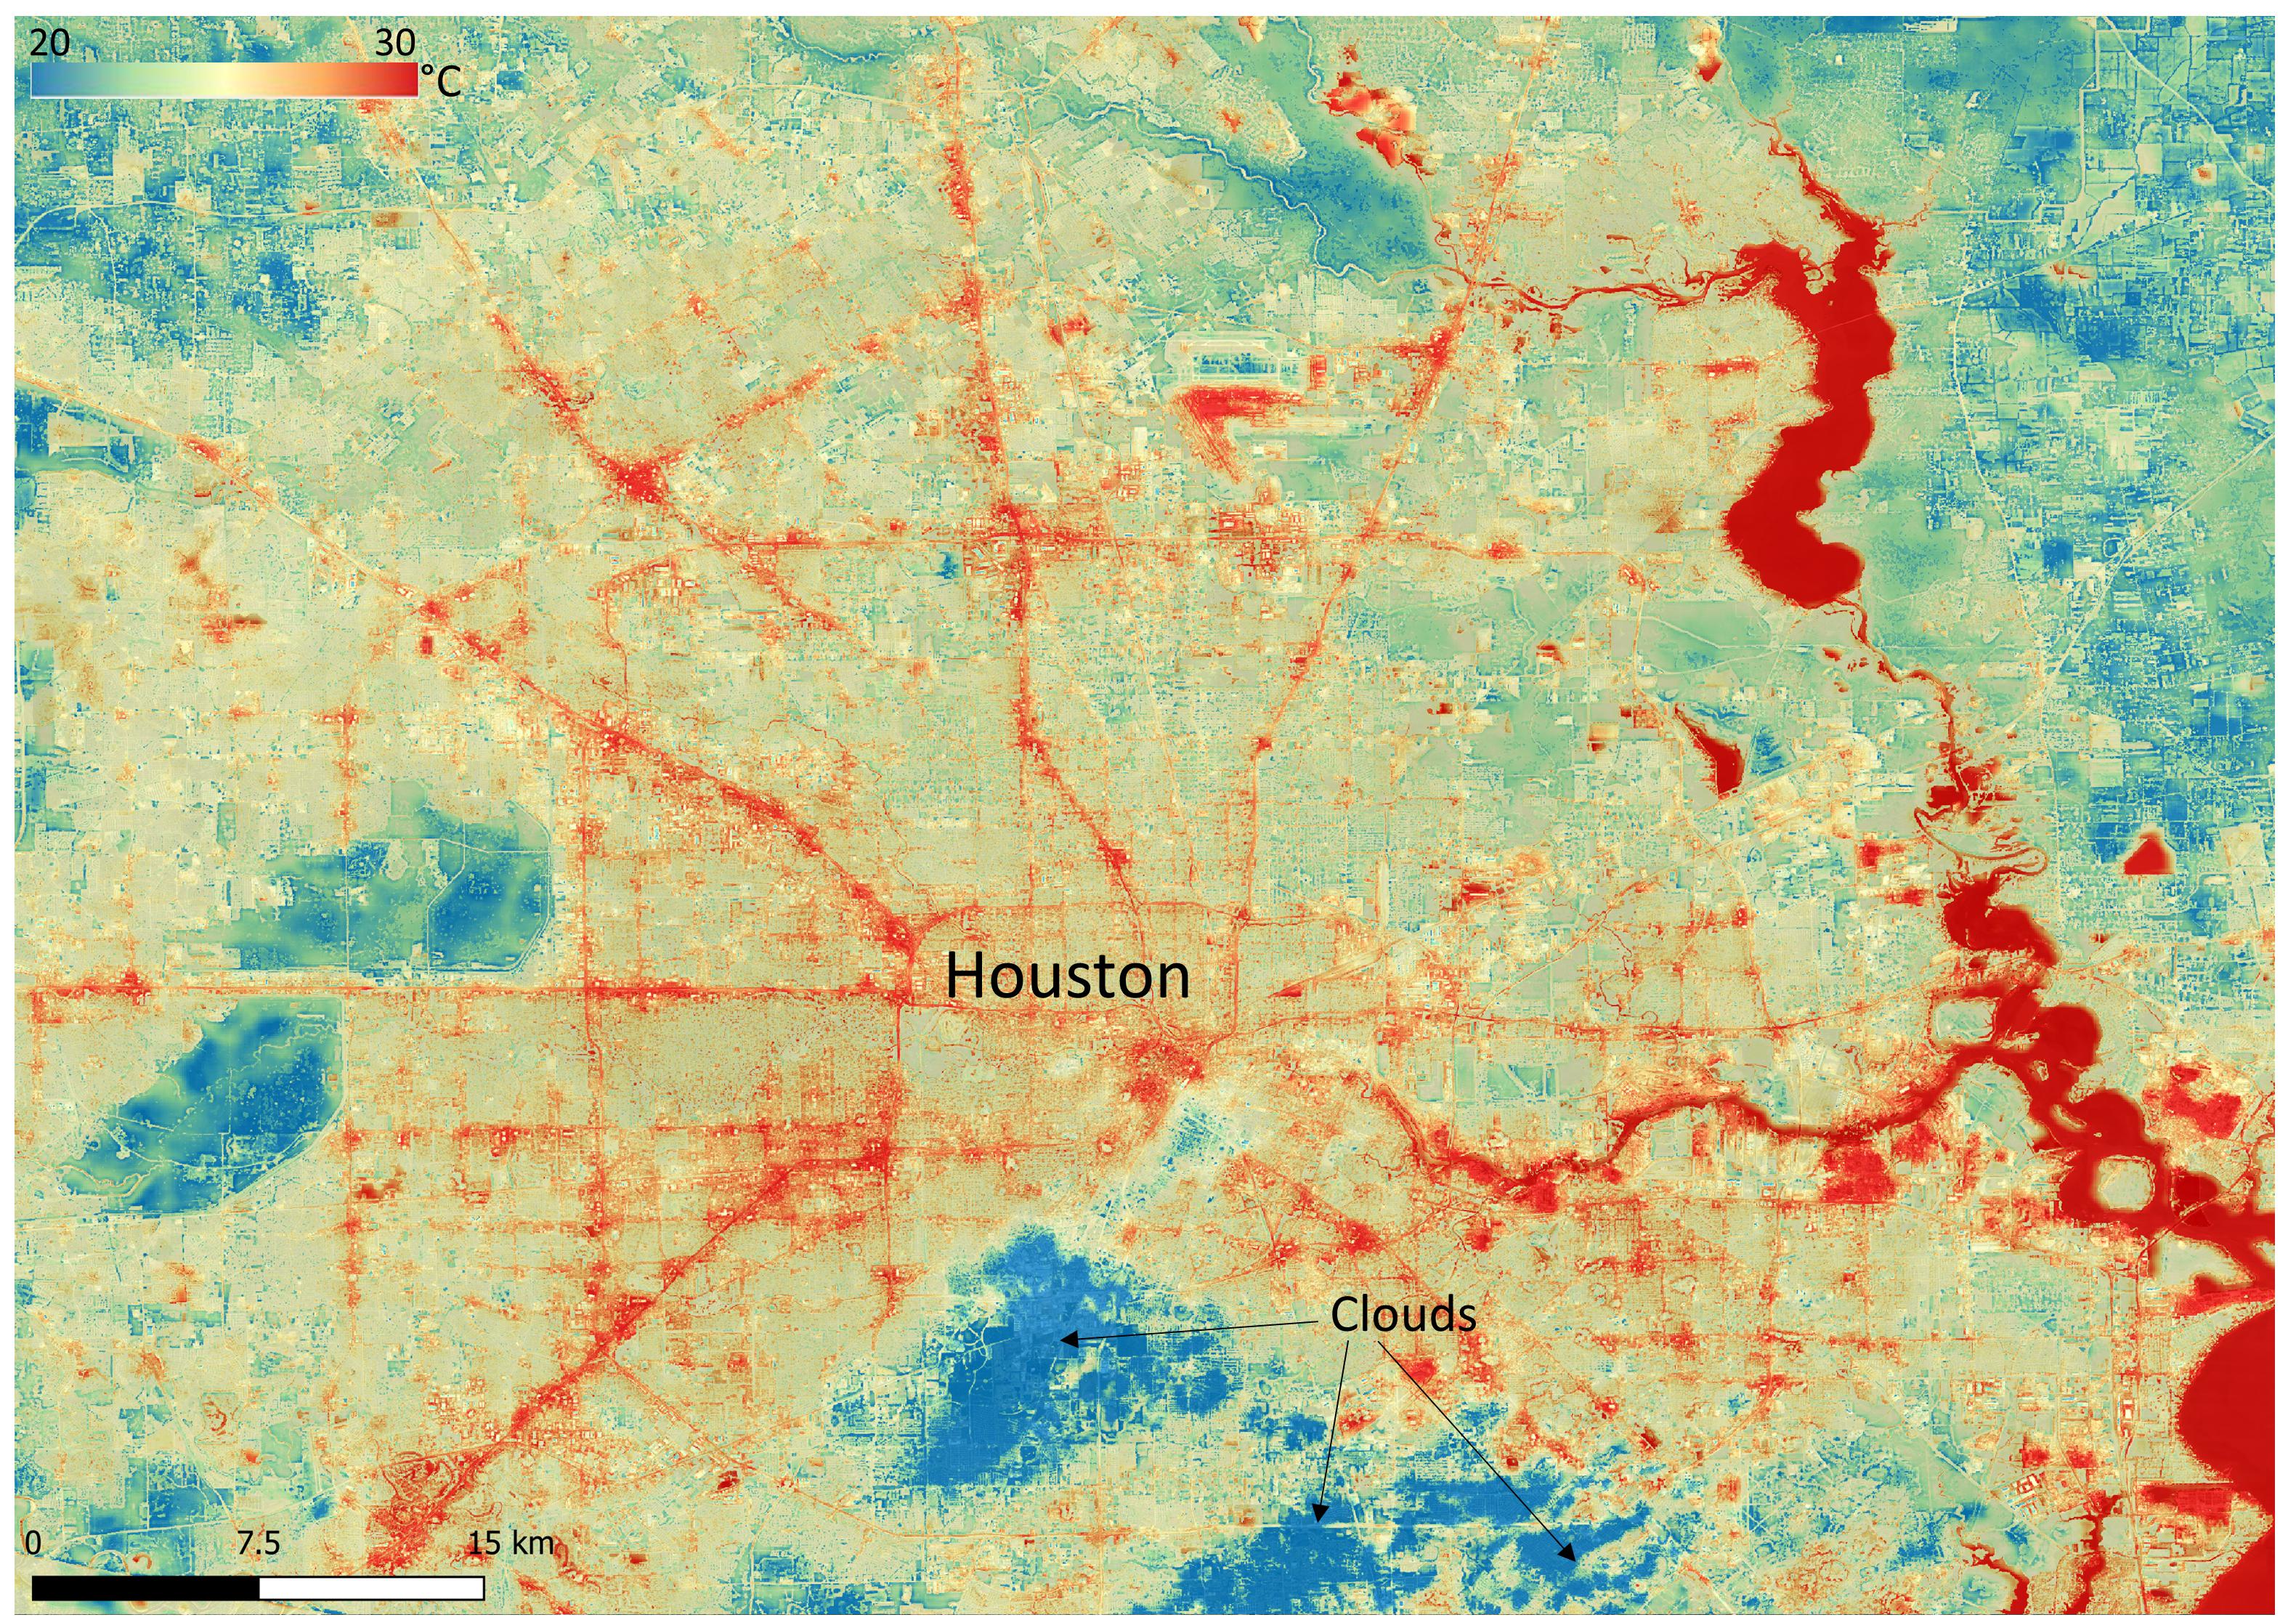
2022-06-22 |
Earth
|
ECOSTRESS
|
|
3161x2230x3 |
|
-
PIA25421:
-
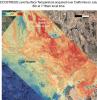
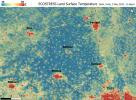
NASA's ECOSTRESS Shows Surface Heat in Houston
Full Resolution:
TIFF
(21.16 MB)
JPEG
(1.711 MB)
|
|
|
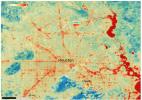
2022-06-22 |
Earth
|
ECOSTRESS
|
|
3099x2201x3 |
|
-
PIA25422:
-
NASA's ECOSTRESS Shows Heat in Dallas and Fort Worth
Full Resolution:
TIFF
(20.47 MB)
JPEG
(2.22 MB)
|
|
|
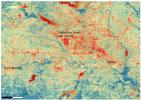
2022-06-30 |
Earth
|
ECOSTRESS
|
|
3507x2480x3 |
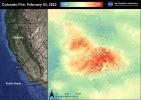
|
-
PIA25280:
-
Colorado Fire
Full Resolution:
TIFF
(17.17 MB)
JPEG
(810.7 kB)
|
|
|
2022-06-30 |
Earth
|
ECOSTRESS
|
|
3507x2480x3 |
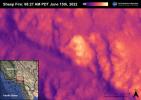
|
-
PIA25356:
-
Sheep Fire
Full Resolution:
TIFF
(16.45 MB)
JPEG
(598.1 kB)
|
|
|
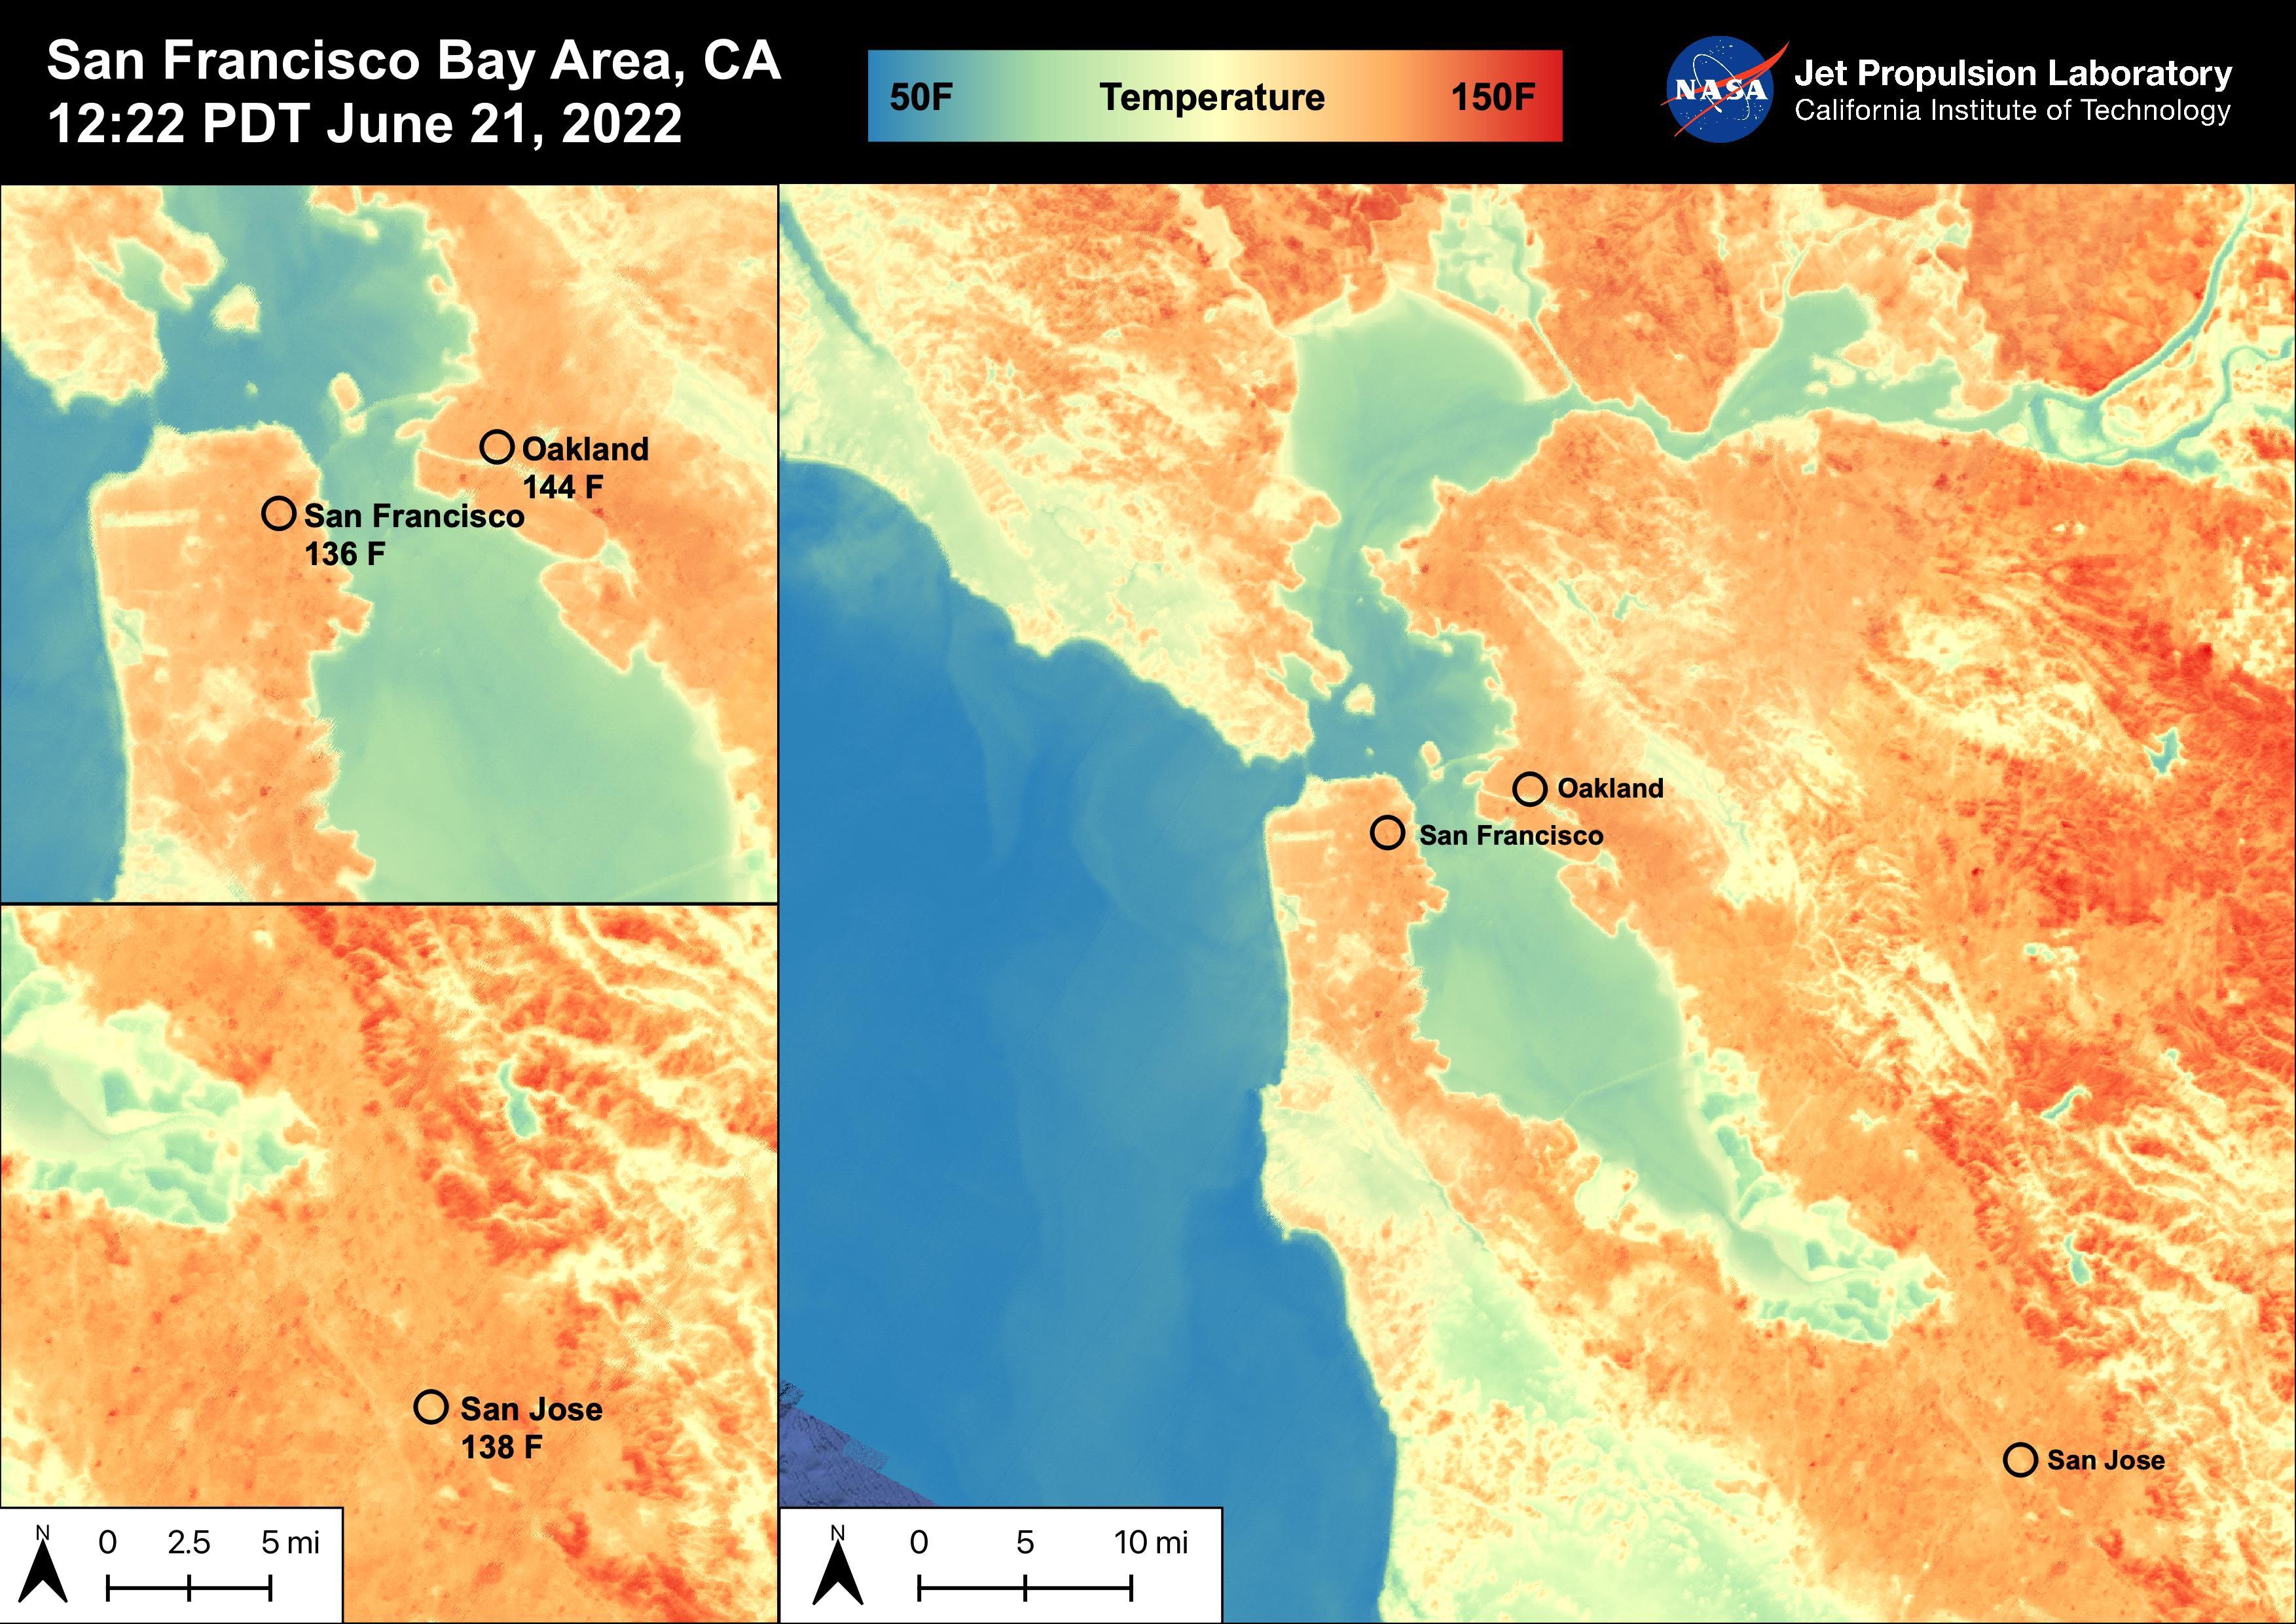
2022-06-30 |
Earth
|
ECOSTRESS
|
|
3507x2480x3 |
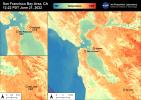
|
-
PIA25441:
-
High Temperatures in the San Francisco Bay Area
Full Resolution:
TIFF
(21.01 MB)
JPEG
(919.1 kB)
|
|
|
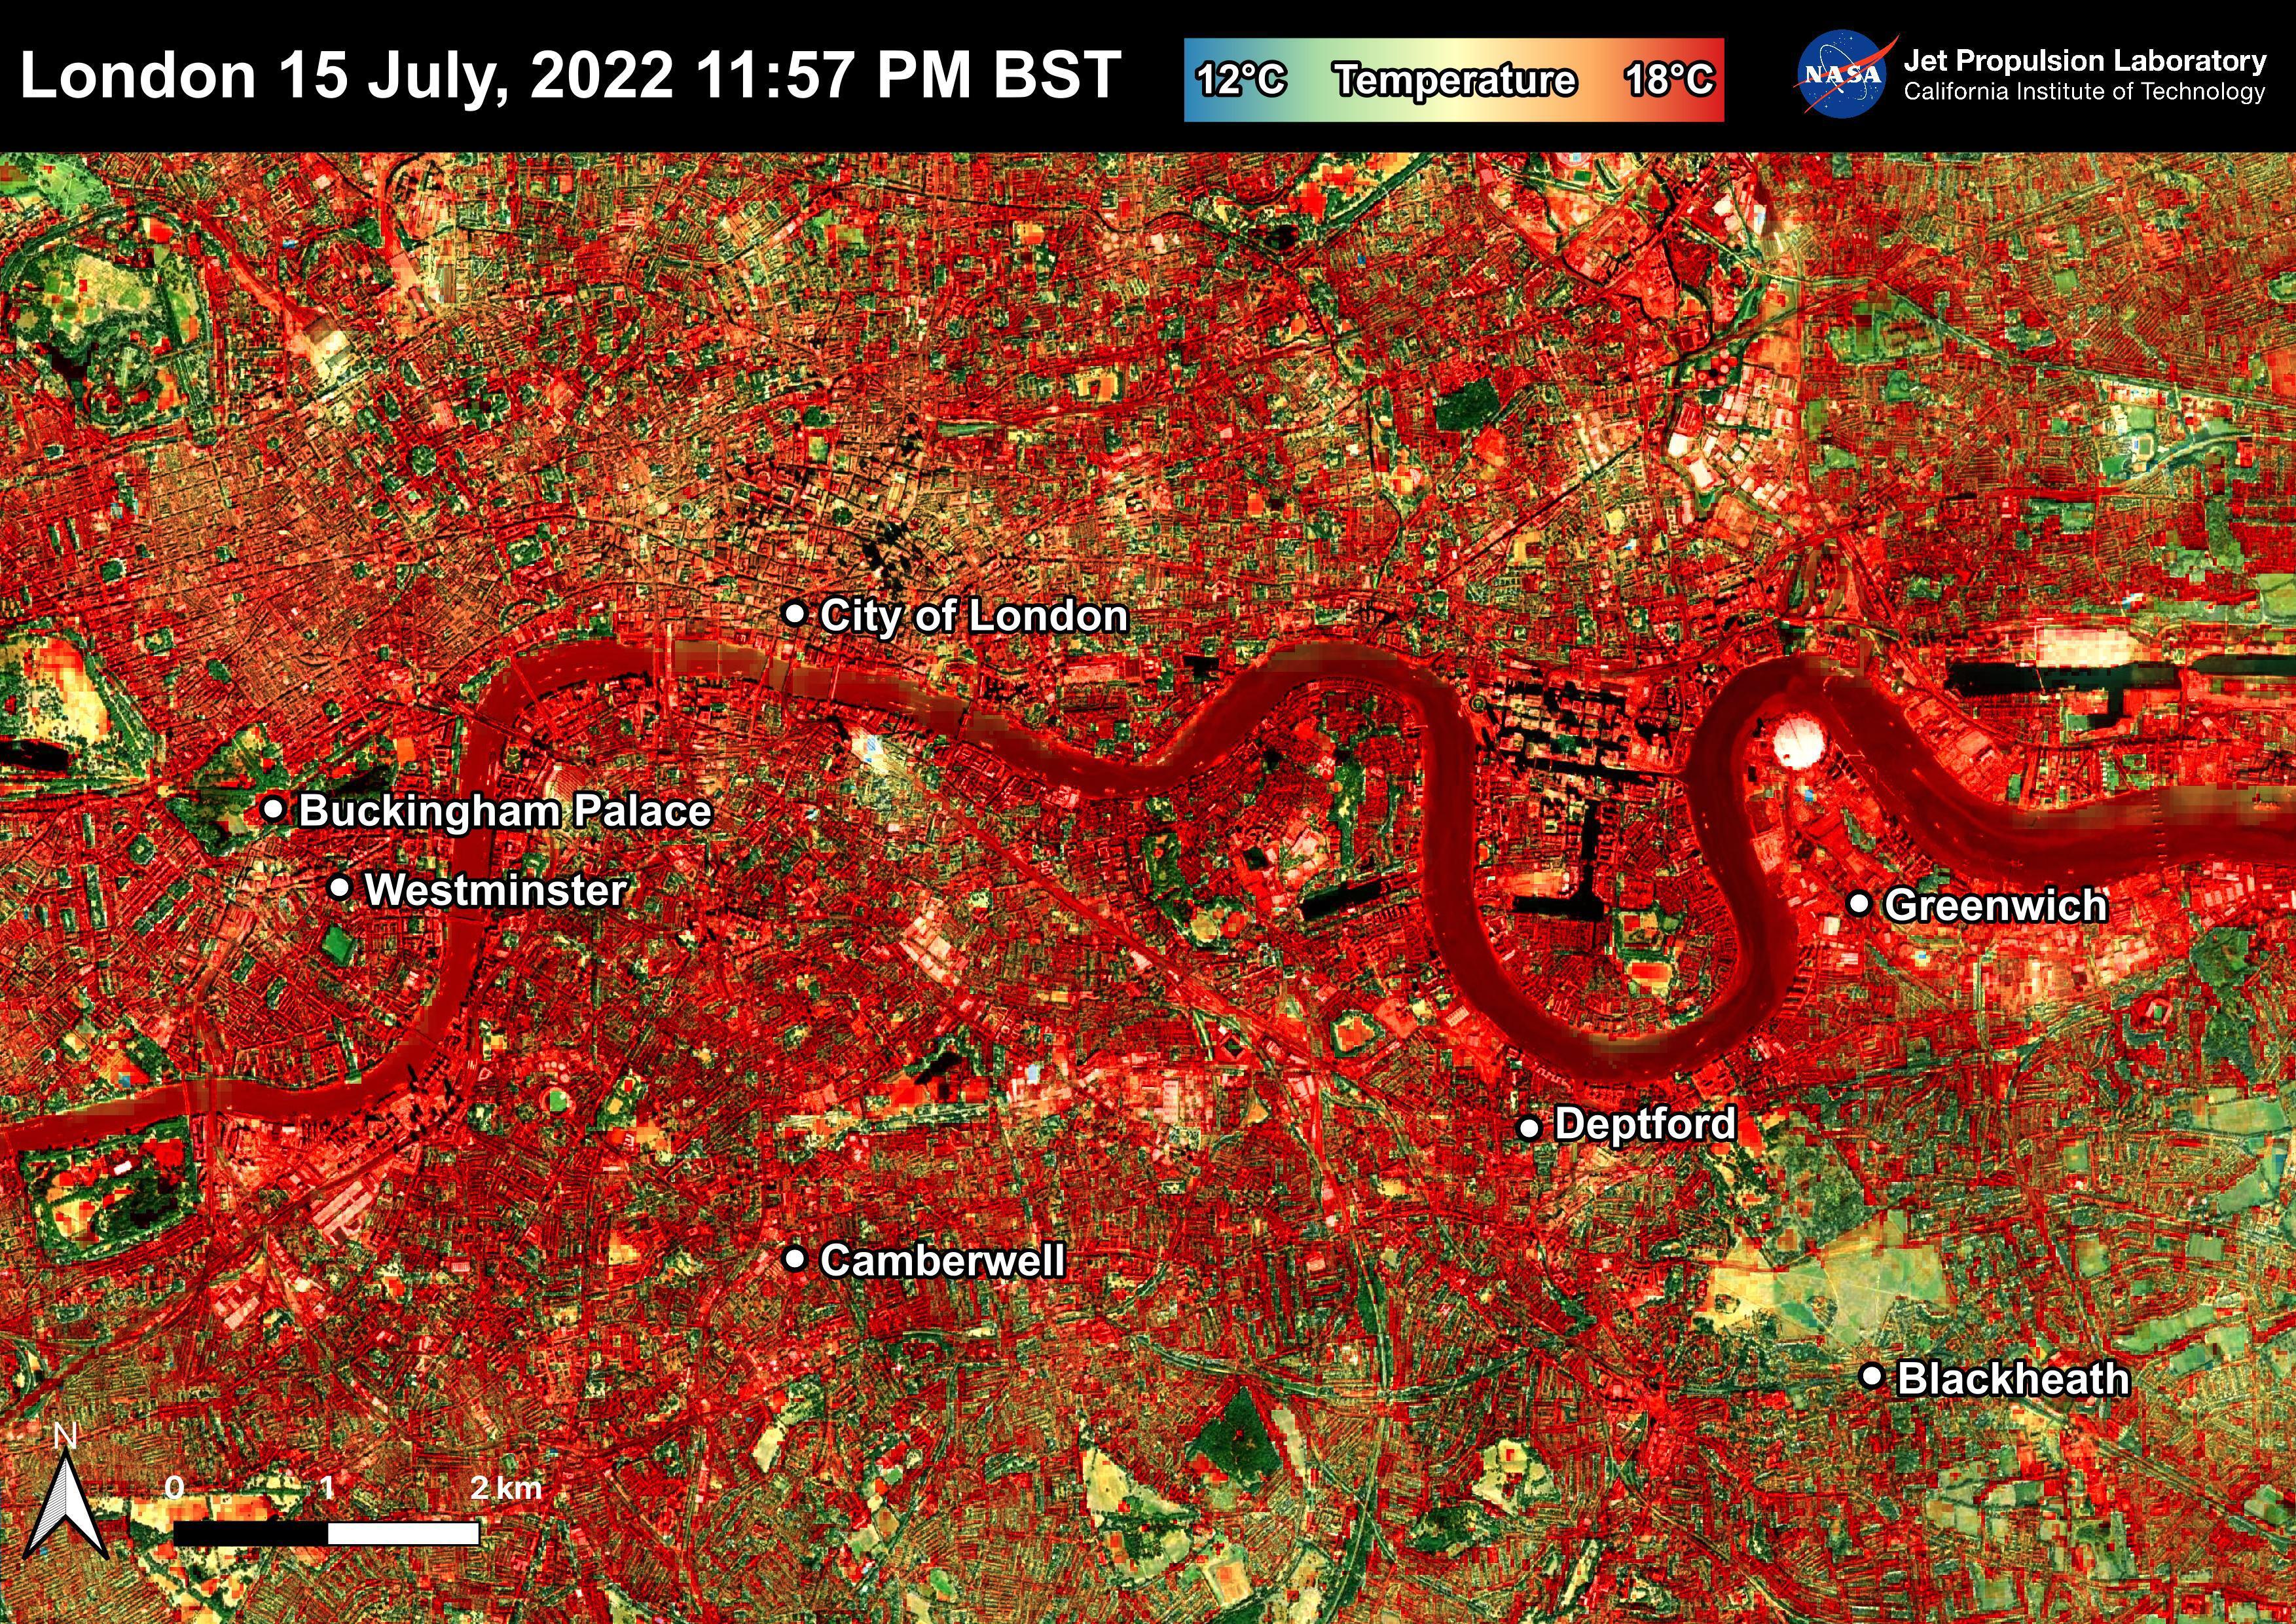
2022-07-22 |
Earth
|
ECOSTRESS
|
|
3507x2480x3 |
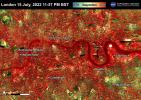
|
-
PIA25423:
-
NASA's ECOSTRESS Shows Overnight Heat in London
Full Resolution:
TIFF
(26.1 MB)
JPEG
(2.721 MB)
|


