Your search criteria found
36
images
Mission
Go to PIAxxxxx:
Refine this list of images by:
Target:
Dione
Enceladus
Iapetus
Mimas
Phoebe
Saturn
Titan
Click on an image for detailed information
Click on a column heading to sort in ascending or descending order
My
List
Addition Date
Target
Mission
Instrument
Size
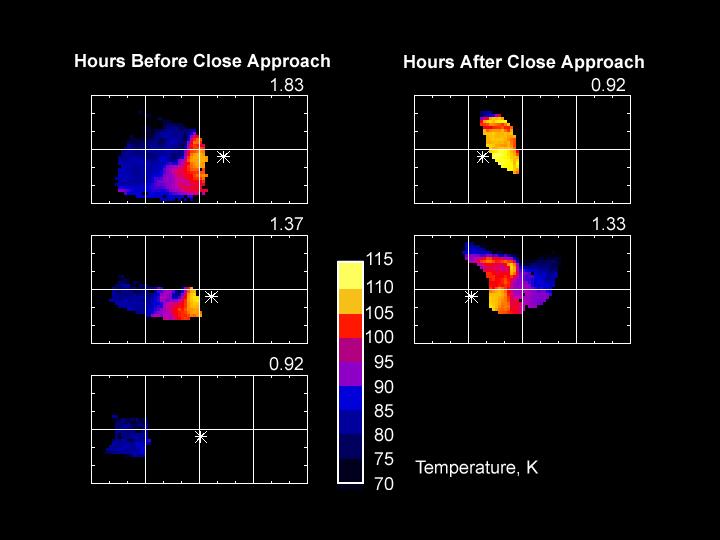
2004-06-23
Phoebe
Cassini-Huygens
Composite Infrared Spectrometer
720x540x3
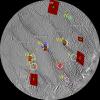
PIA06402:
Phoebe's Radiation
Full Resolution:
TIFF
(221.5 kB)
JPEG
(31.97 kB)
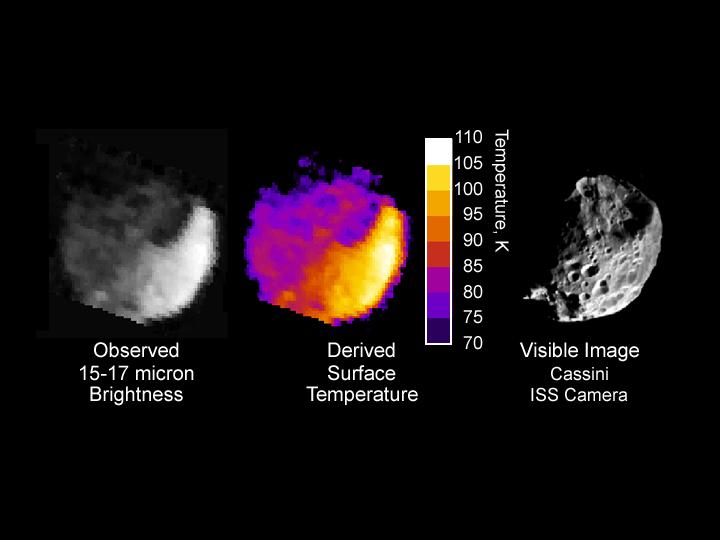
2004-06-23
Phoebe
Cassini-Huygens
Composite Infrared Spectrometer
720x540x3
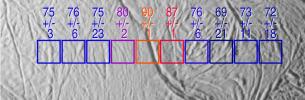
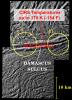
PIA06403:
Phoebe Temperature Maps
Full Resolution:
TIFF
(122.2 kB)
JPEG
(38.86 kB)
2004-07-02
Saturn
Cassini-Huygens
Composite Infrared Spectrometer
720x540x3
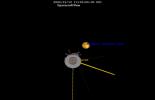
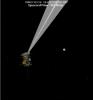
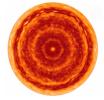
PIA06346:
High Above Saturn's Cloud Tops
Full Resolution:
TIFF
(390.2 kB)
JPEG
(46.82 kB)
2004-10-27
Titan
Cassini-Huygens
Composite Infrared Spectrometer
Imaging Science Subsystem
Ultraviolet Imaging Spectrograph
Visual and Infrared Spectrometer
485x320x837
PIA06119:
Titan Flyby Animation
Full Resolution:
2004-12-13
Titan
Cassini-Huygens
Composite Infrared Spectrometer
Imaging Science Subsystem
Ultraviolet Imaging Spectrograph
Visual and Infrared Mapping Spectrometer
752x484x3
PIA06147:
Titan 'TB' Flyby Animation
Full Resolution:
2004-12-13
Dione
Cassini-Huygens
Composite Infrared Spectrometer
Imaging Science Subsystem
Ultraviolet Imaging Spectrograph
Visual and Infrared Mapping Spectrometer
452x484x3
PIA06149:
Dione Flyby Animation
Full Resolution:
2005-01-10
Iapetus
Cassini-Huygens
Composite Infrared Spectrometer
645x239x3
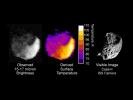
PIA07004:
Iapetus Thermal Radiation Image
Full Resolution:
TIFF
(196.5 kB)
JPEG
(16.18 kB)
2005-01-10
Iapetus
Cassini-Huygens
Composite Infrared Spectrometer
664x568x3
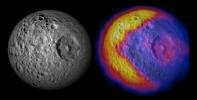
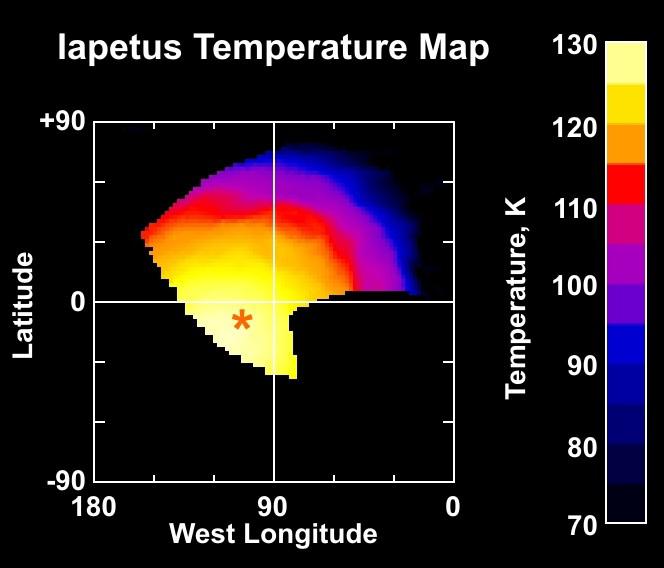
PIA07005:
Iapetus Temperature Map
Full Resolution:
TIFF
(268.2 kB)
JPEG
(35.24 kB)
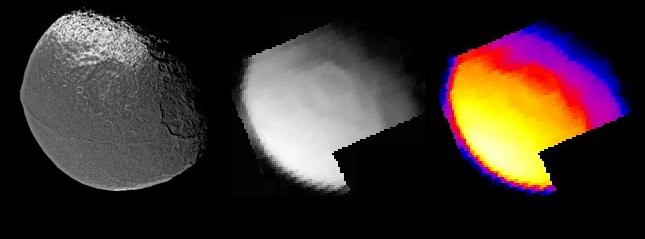
2005-01-10
Iapetus
Cassini-Huygens
Composite Infrared Spectrometer
791x591x3
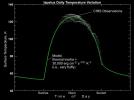
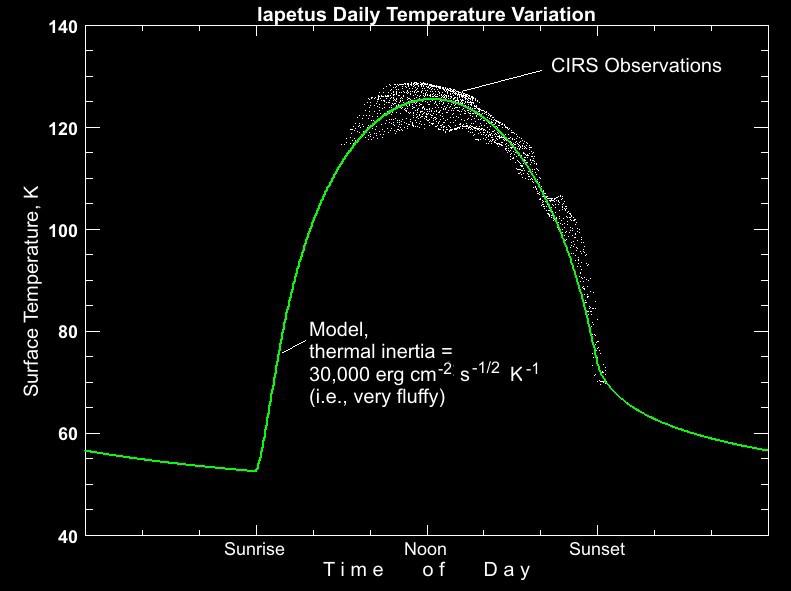
PIA07006:
Iapetus Temperature Variation Map
Full Resolution:
TIFF
(179 kB)
JPEG
(42.93 kB)
2005-07-29
Enceladus
Cassini-Huygens
Composite Infrared Spectrometer
648x371x3
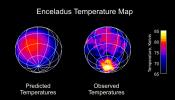
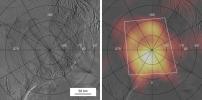
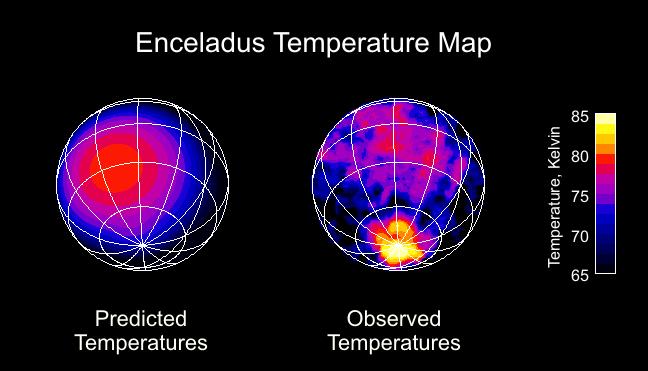
PIA06432:
Enceladus Temperature Map
Full Resolution:
TIFF
(242.4 kB)
JPEG
(38.18 kB)
2005-07-29
Enceladus
Cassini-Huygens
Imaging Science Subsystem
Composite Infrared Spectrometer
973x965x3
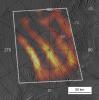
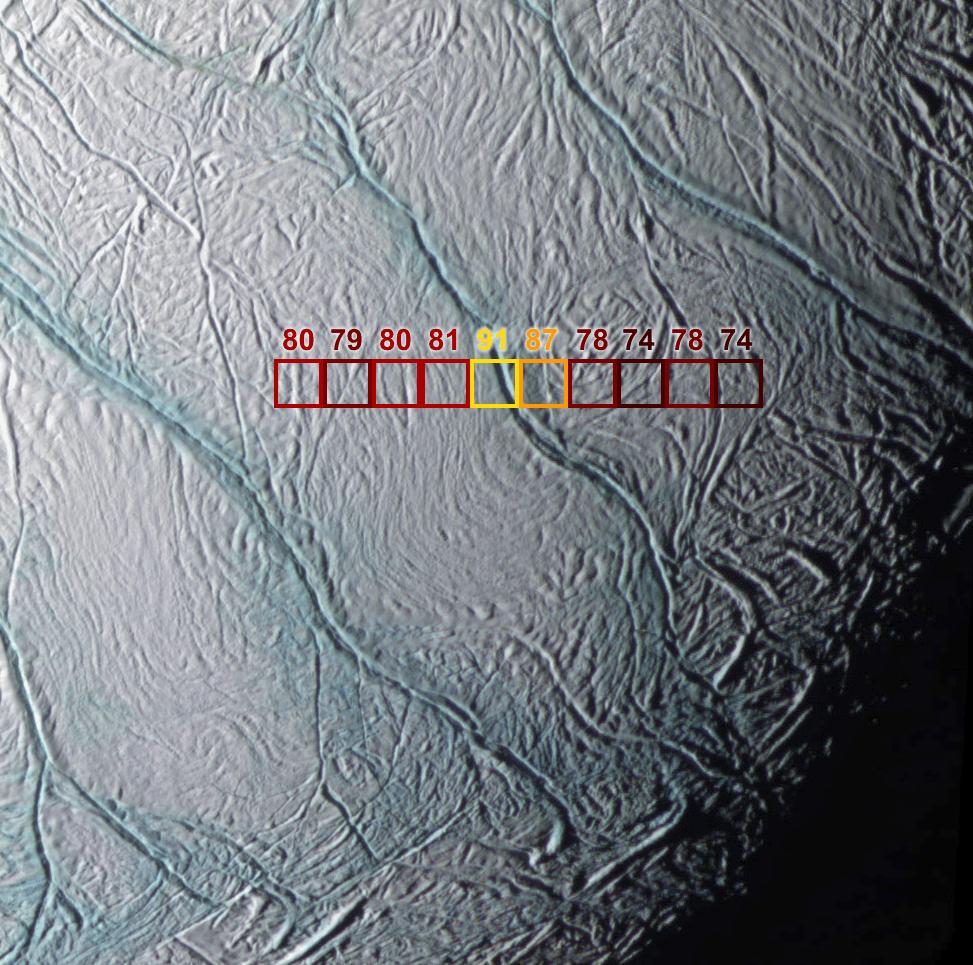
PIA06433:
Warm Fractures on Enceladus
Full Resolution:
TIFF
(941.7 kB)
JPEG
(172.6 kB)
2005-08-30
Enceladus
Cassini-Huygens
Composite Infrared Spectrometer
1579x1086x3
PIA07723:
Enceladus: The Plot Thickens
Full Resolution:
TIFF
(5.153 MB)
JPEG
(224.2 kB)
2005-08-31
Enceladus
Cassini-Huygens
Composite Infrared Spectrometer
Imaging Science Subsystem
Imaging Science Subsystem - Narrow Angle
318x239x3
PIA03554:
Enceladus Animation
Full Resolution:
TIFF
(228.5 kB)
JPEG
(6.463 kB)
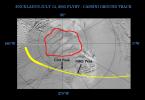
2005-09-05
Saturn
Cassini-Huygens
Composite Infrared Spectrometer
1600x1602x3
PIA03561:
Slower Spinning Rings #1
Full Resolution:
TIFF
(7.703 MB)
JPEG
(157.3 kB)
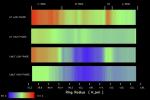
2005-09-05
Saturn
Cassini-Huygens
Composite Infrared Spectrometer
799x533x3
PIA03562:
Slower Spinning Rings #2
Full Resolution:
TIFF
(1.279 MB)
JPEG
(37.6 kB)
2006-03-09
Enceladus
Cassini-Huygens
Imaging Science Subsystem
Composite Infrared Spectrometer
1171x384x3
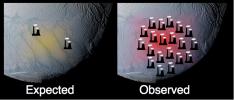
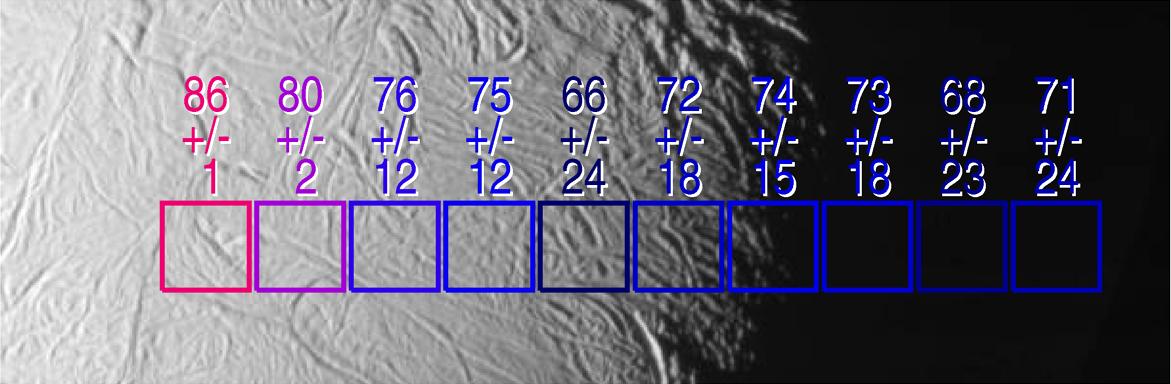
PIA07793:
Searching for Warmth
Full Resolution:
TIFF
(1.351 MB)
JPEG
(68.38 kB)
2006-03-09
Enceladus
Cassini-Huygens
Imaging Science Subsystem
Composite Infrared Spectrometer
1171x384x3
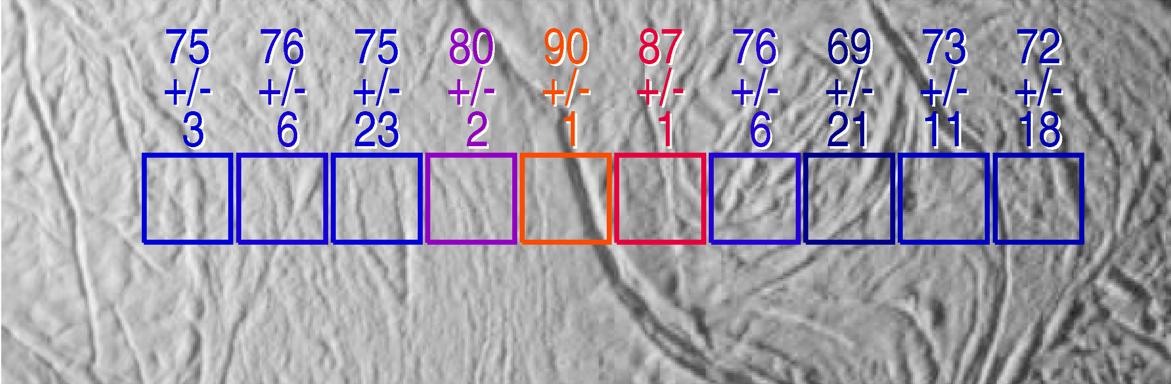
PIA07794:
Searching for Warmth
Full Resolution:
TIFF
(1.351 MB)
JPEG
(78.02 kB)
2006-11-09
Saturn
Cassini-Huygens
Composite Infrared Spectrometer
Imaging Science Subsystem - Wide Angle
1040x1070x3
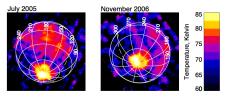
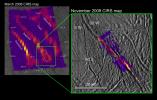
PIA08334:
The Hole at the Pole
Full Resolution:
TIFF
(3.343 MB)
JPEG
(114.5 kB)
2006-12-22
Enceladus
Cassini-Huygens
Composite Infrared Spectrometer
823x363x3
PIA09037:
Enceladus Keeps the Home Fires Burning
Full Resolution:
TIFF
(897.5 kB)
JPEG
(59.42 kB)
2007-10-09
Iapetus
Cassini-Huygens
Composite Infrared Spectrometer
733x806x3
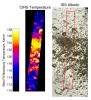
PIA10012:
Warm and Dry on Iapetus
Full Resolution:
TIFF
(1.775 MB)
JPEG
(110.7 kB)
2007-10-10
Enceladus
Cassini-Huygens
Composite Infrared Spectrometer
1024x1024x3
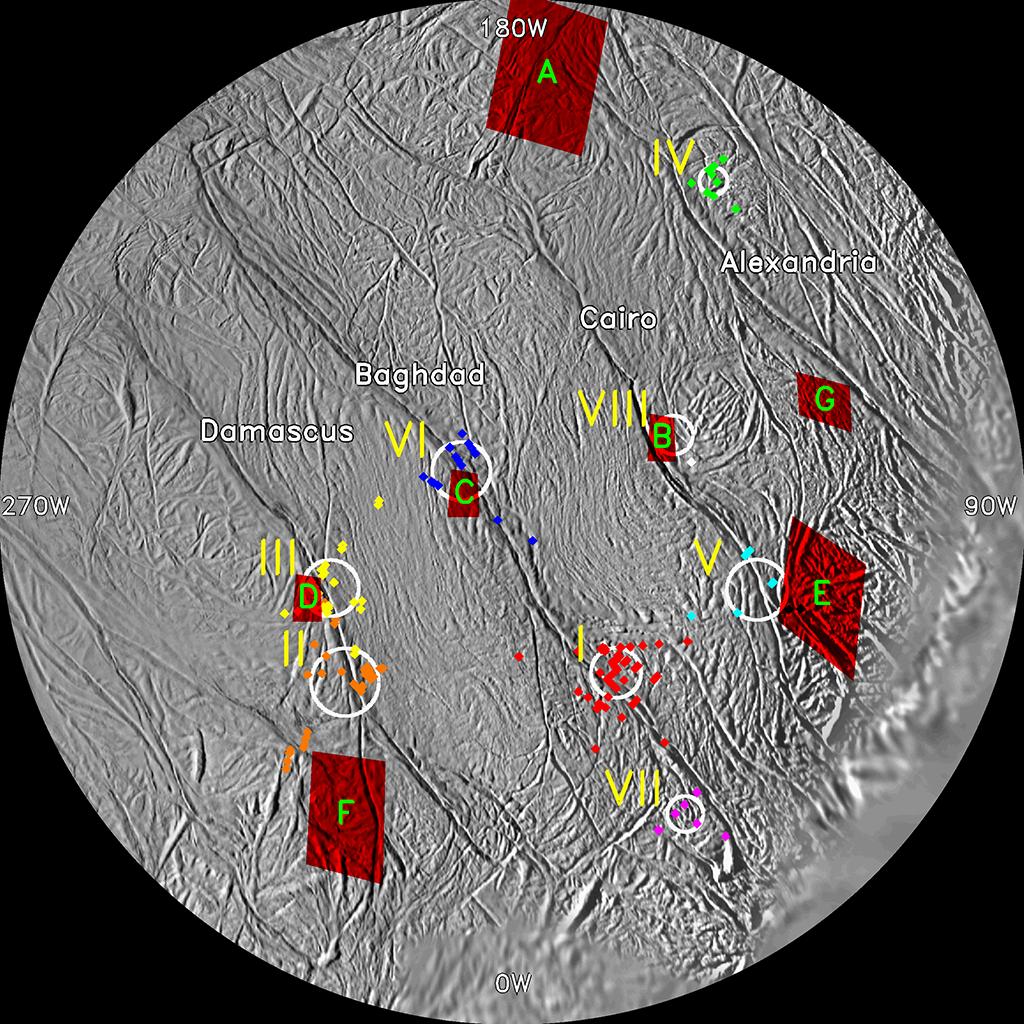
PIA08385:
Enceladus Jet Sources
Full Resolution:
TIFF
(3.15 MB)
JPEG
(250.4 kB)
2008-01-07
Saturn
Cassini-Huygens
Composite Infrared Spectrometer
306x293x3
PIA10217:
Saturn's North Pole Hot Spot and Hexagon
Full Resolution:
TIFF
(269.5 kB)
JPEG
(15.06 kB)
2008-03-26
Enceladus
Cassini-Huygens
Composite Infrared Spectrometer
2908x1440x3
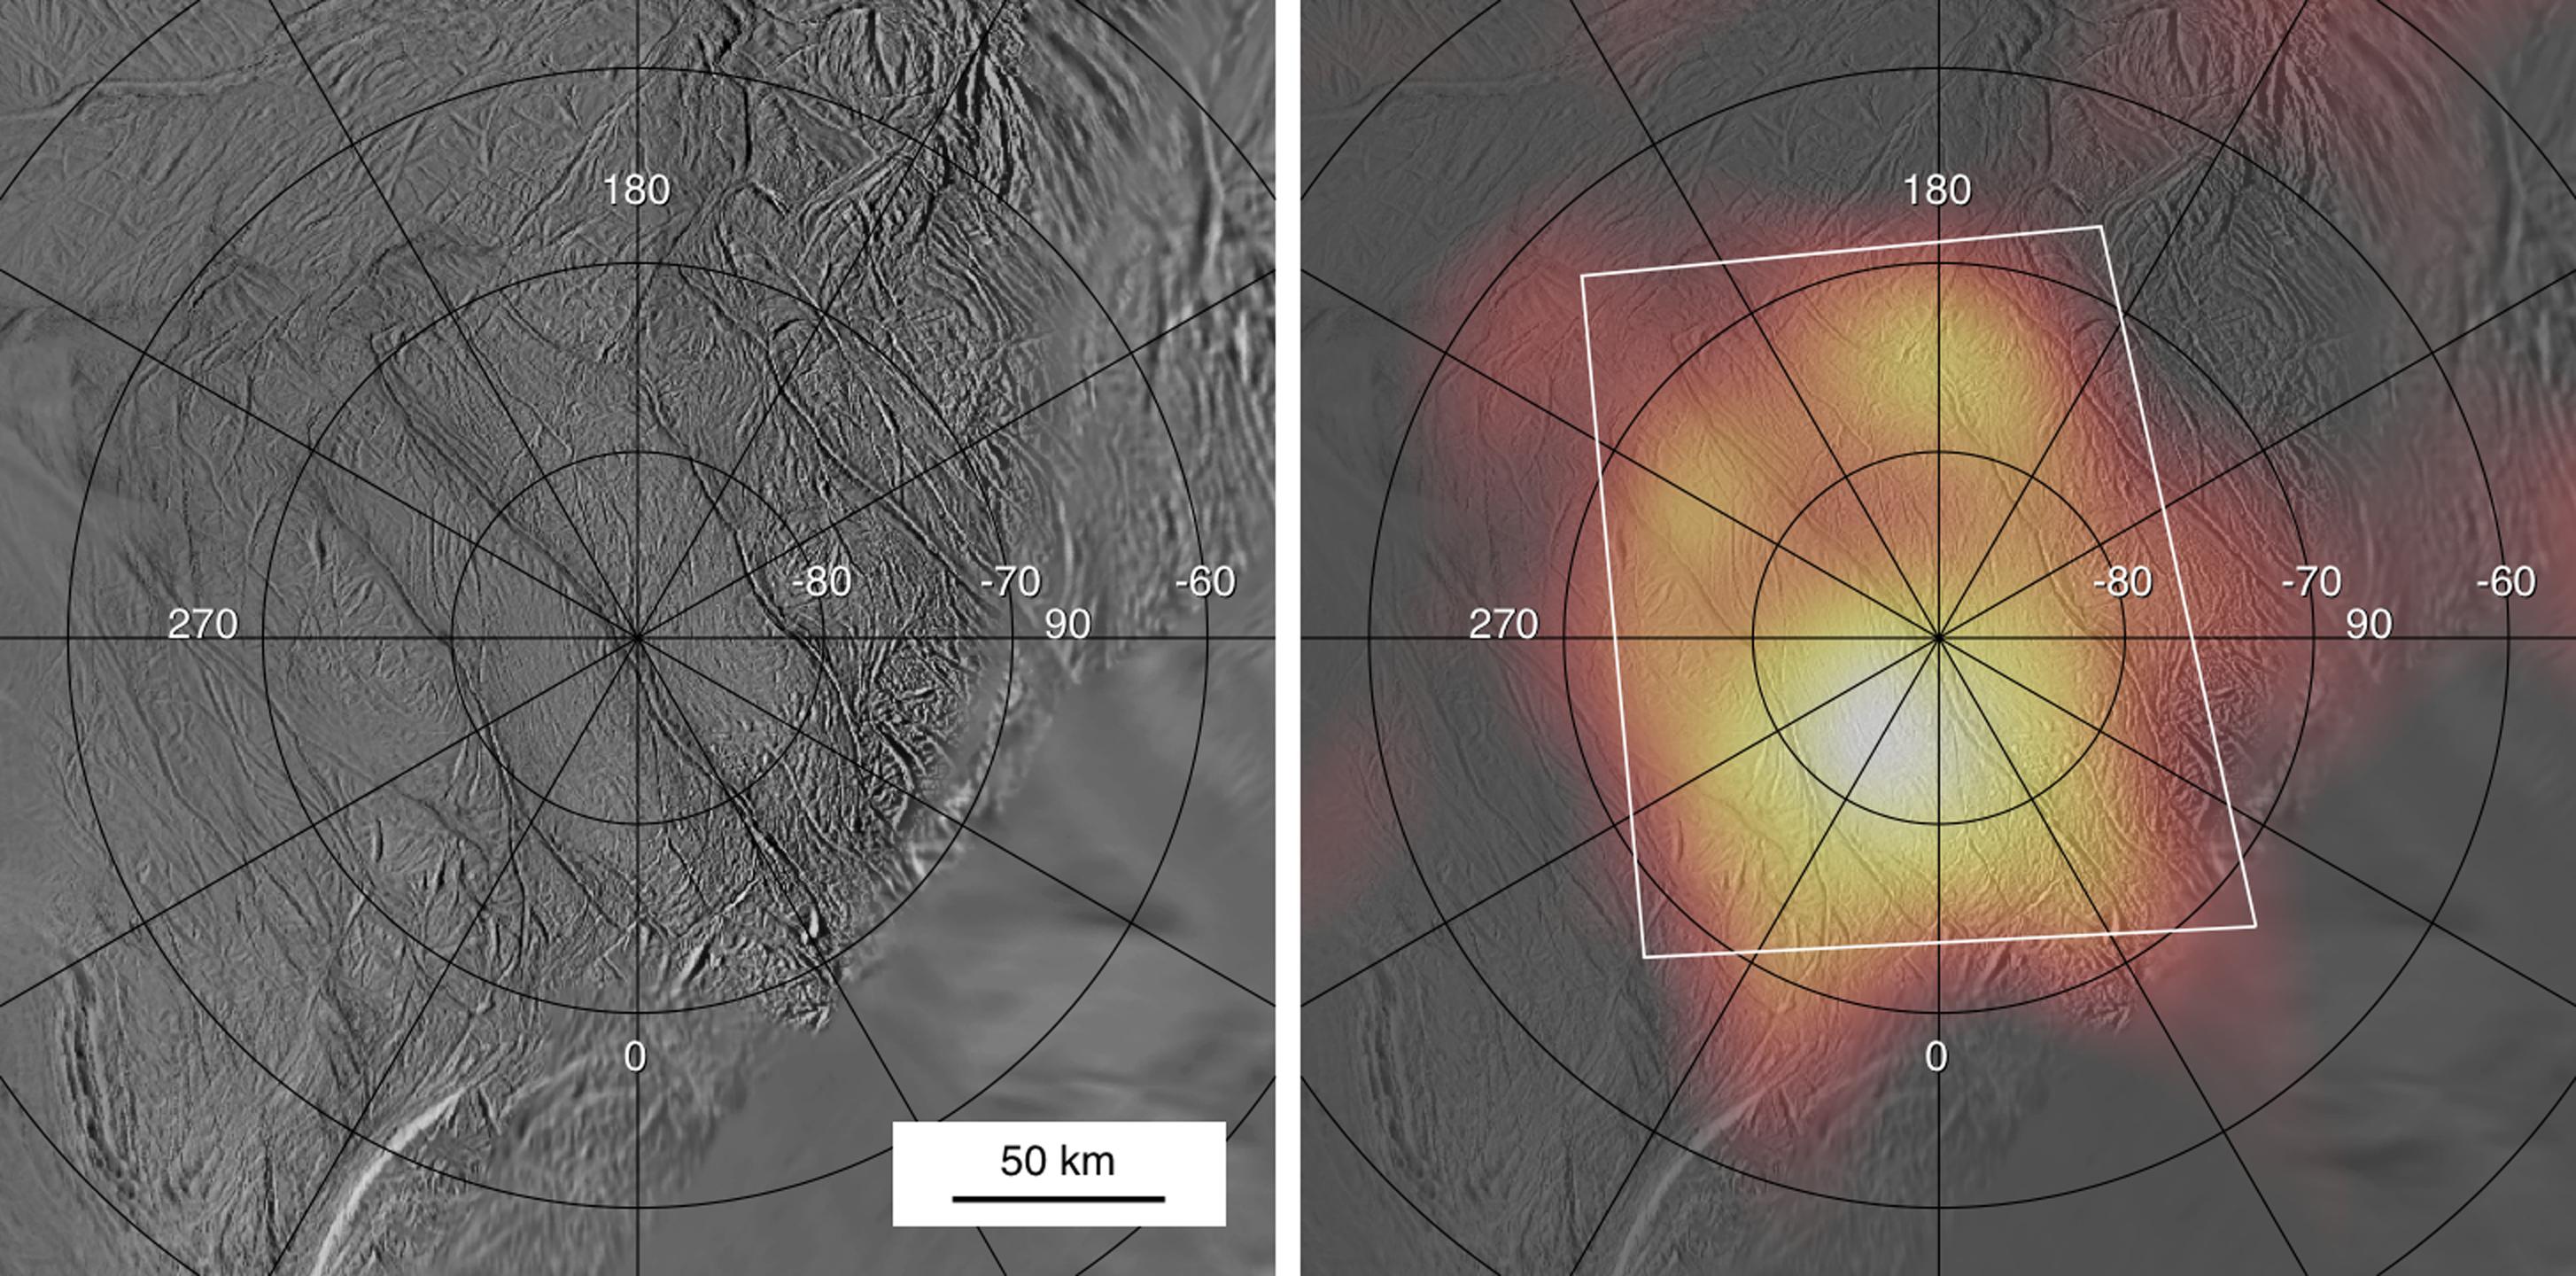
PIA10360:
Stripes and Heat Map Side-by-Side
Full Resolution:
TIFF
(12.56 MB)
JPEG
(521.9 kB)
2008-03-26
Enceladus
Cassini-Huygens
Composite Infrared Spectrometer
2240x2254x3
PIA10361:
Jet Spots in Tiger Stripes
Full Resolution:
TIFF
(15.17 MB)
JPEG
(527.2 kB)
2009-06-24
Enceladus
Cassini-Huygens
Composite Infrared Spectrometer
965x1348x3
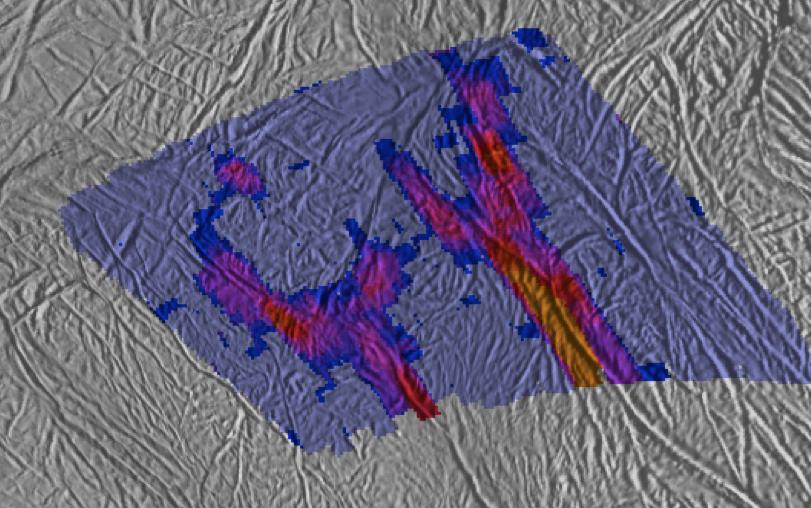
PIA12082:
Warm Tiger Stripes
Full Resolution:
TIFF
(3.908 MB)
JPEG
(274.2 kB)
2010-02-23
Enceladus
Cassini-Huygens
Composite Infrared Spectrometer
2040x1300x3
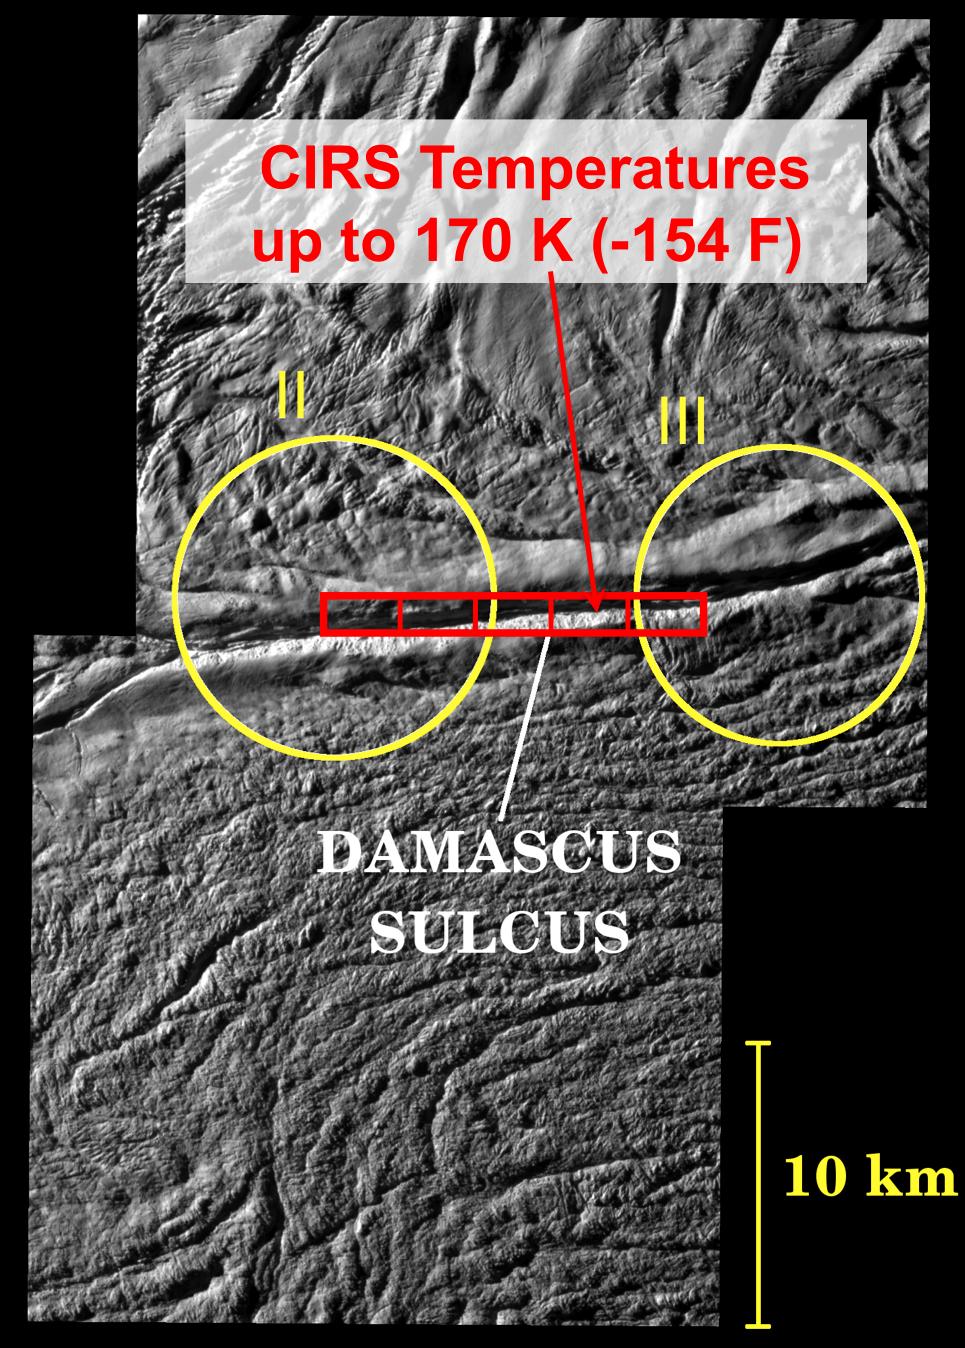
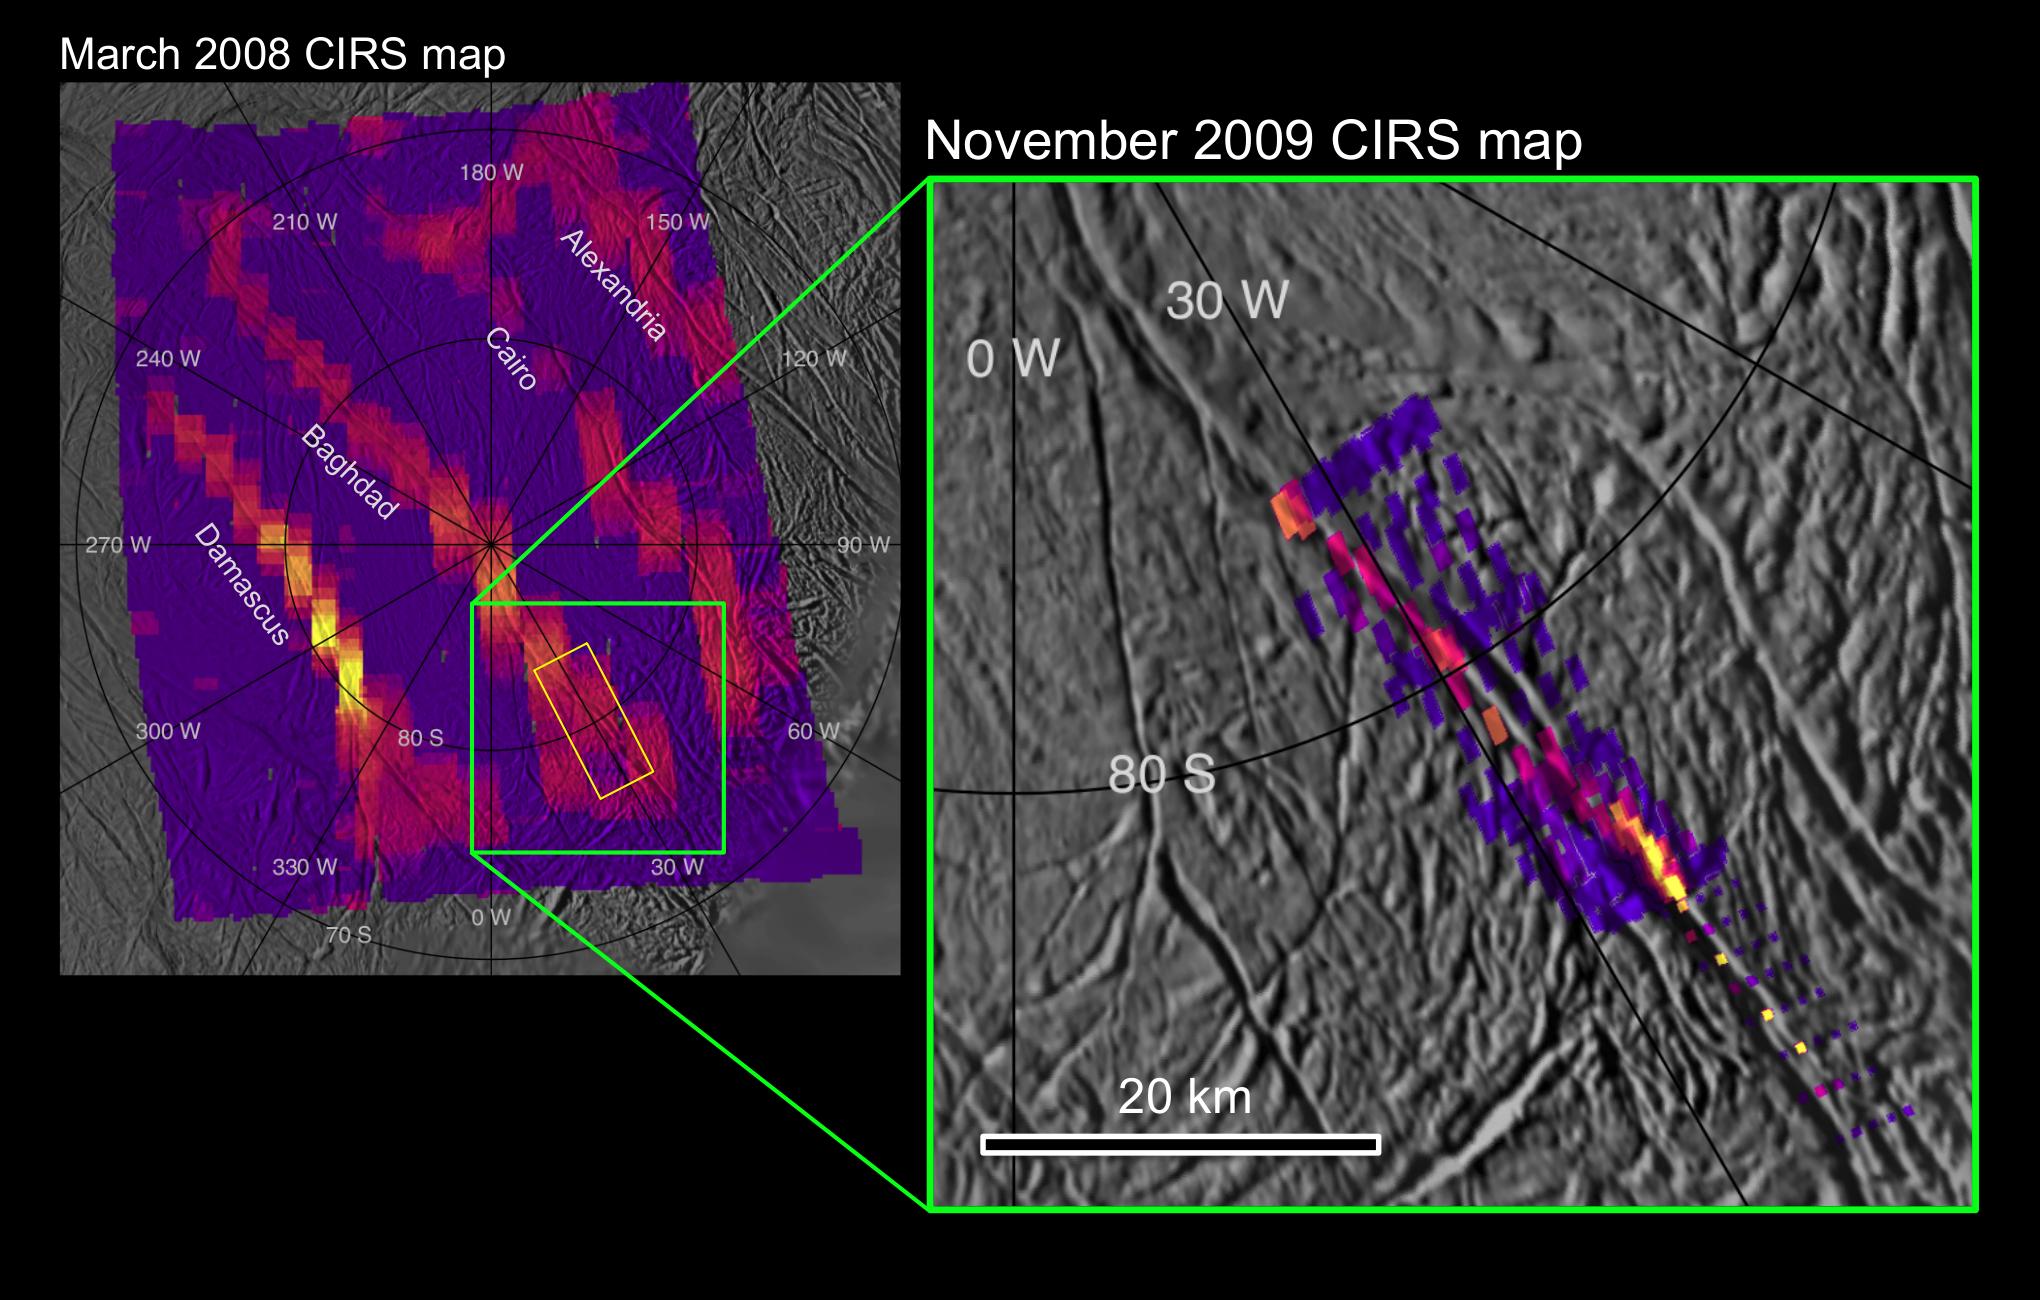
PIA12448:
Zooming in on heat at Baghdad Sulcus
Full Resolution:
TIFF
(7.967 MB)
JPEG
(305.7 kB)
2010-02-23
Enceladus
Cassini-Huygens
Composite Infrared Spectrometer
Imaging Science Subsystem
3205x5855x3
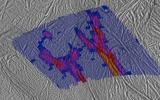
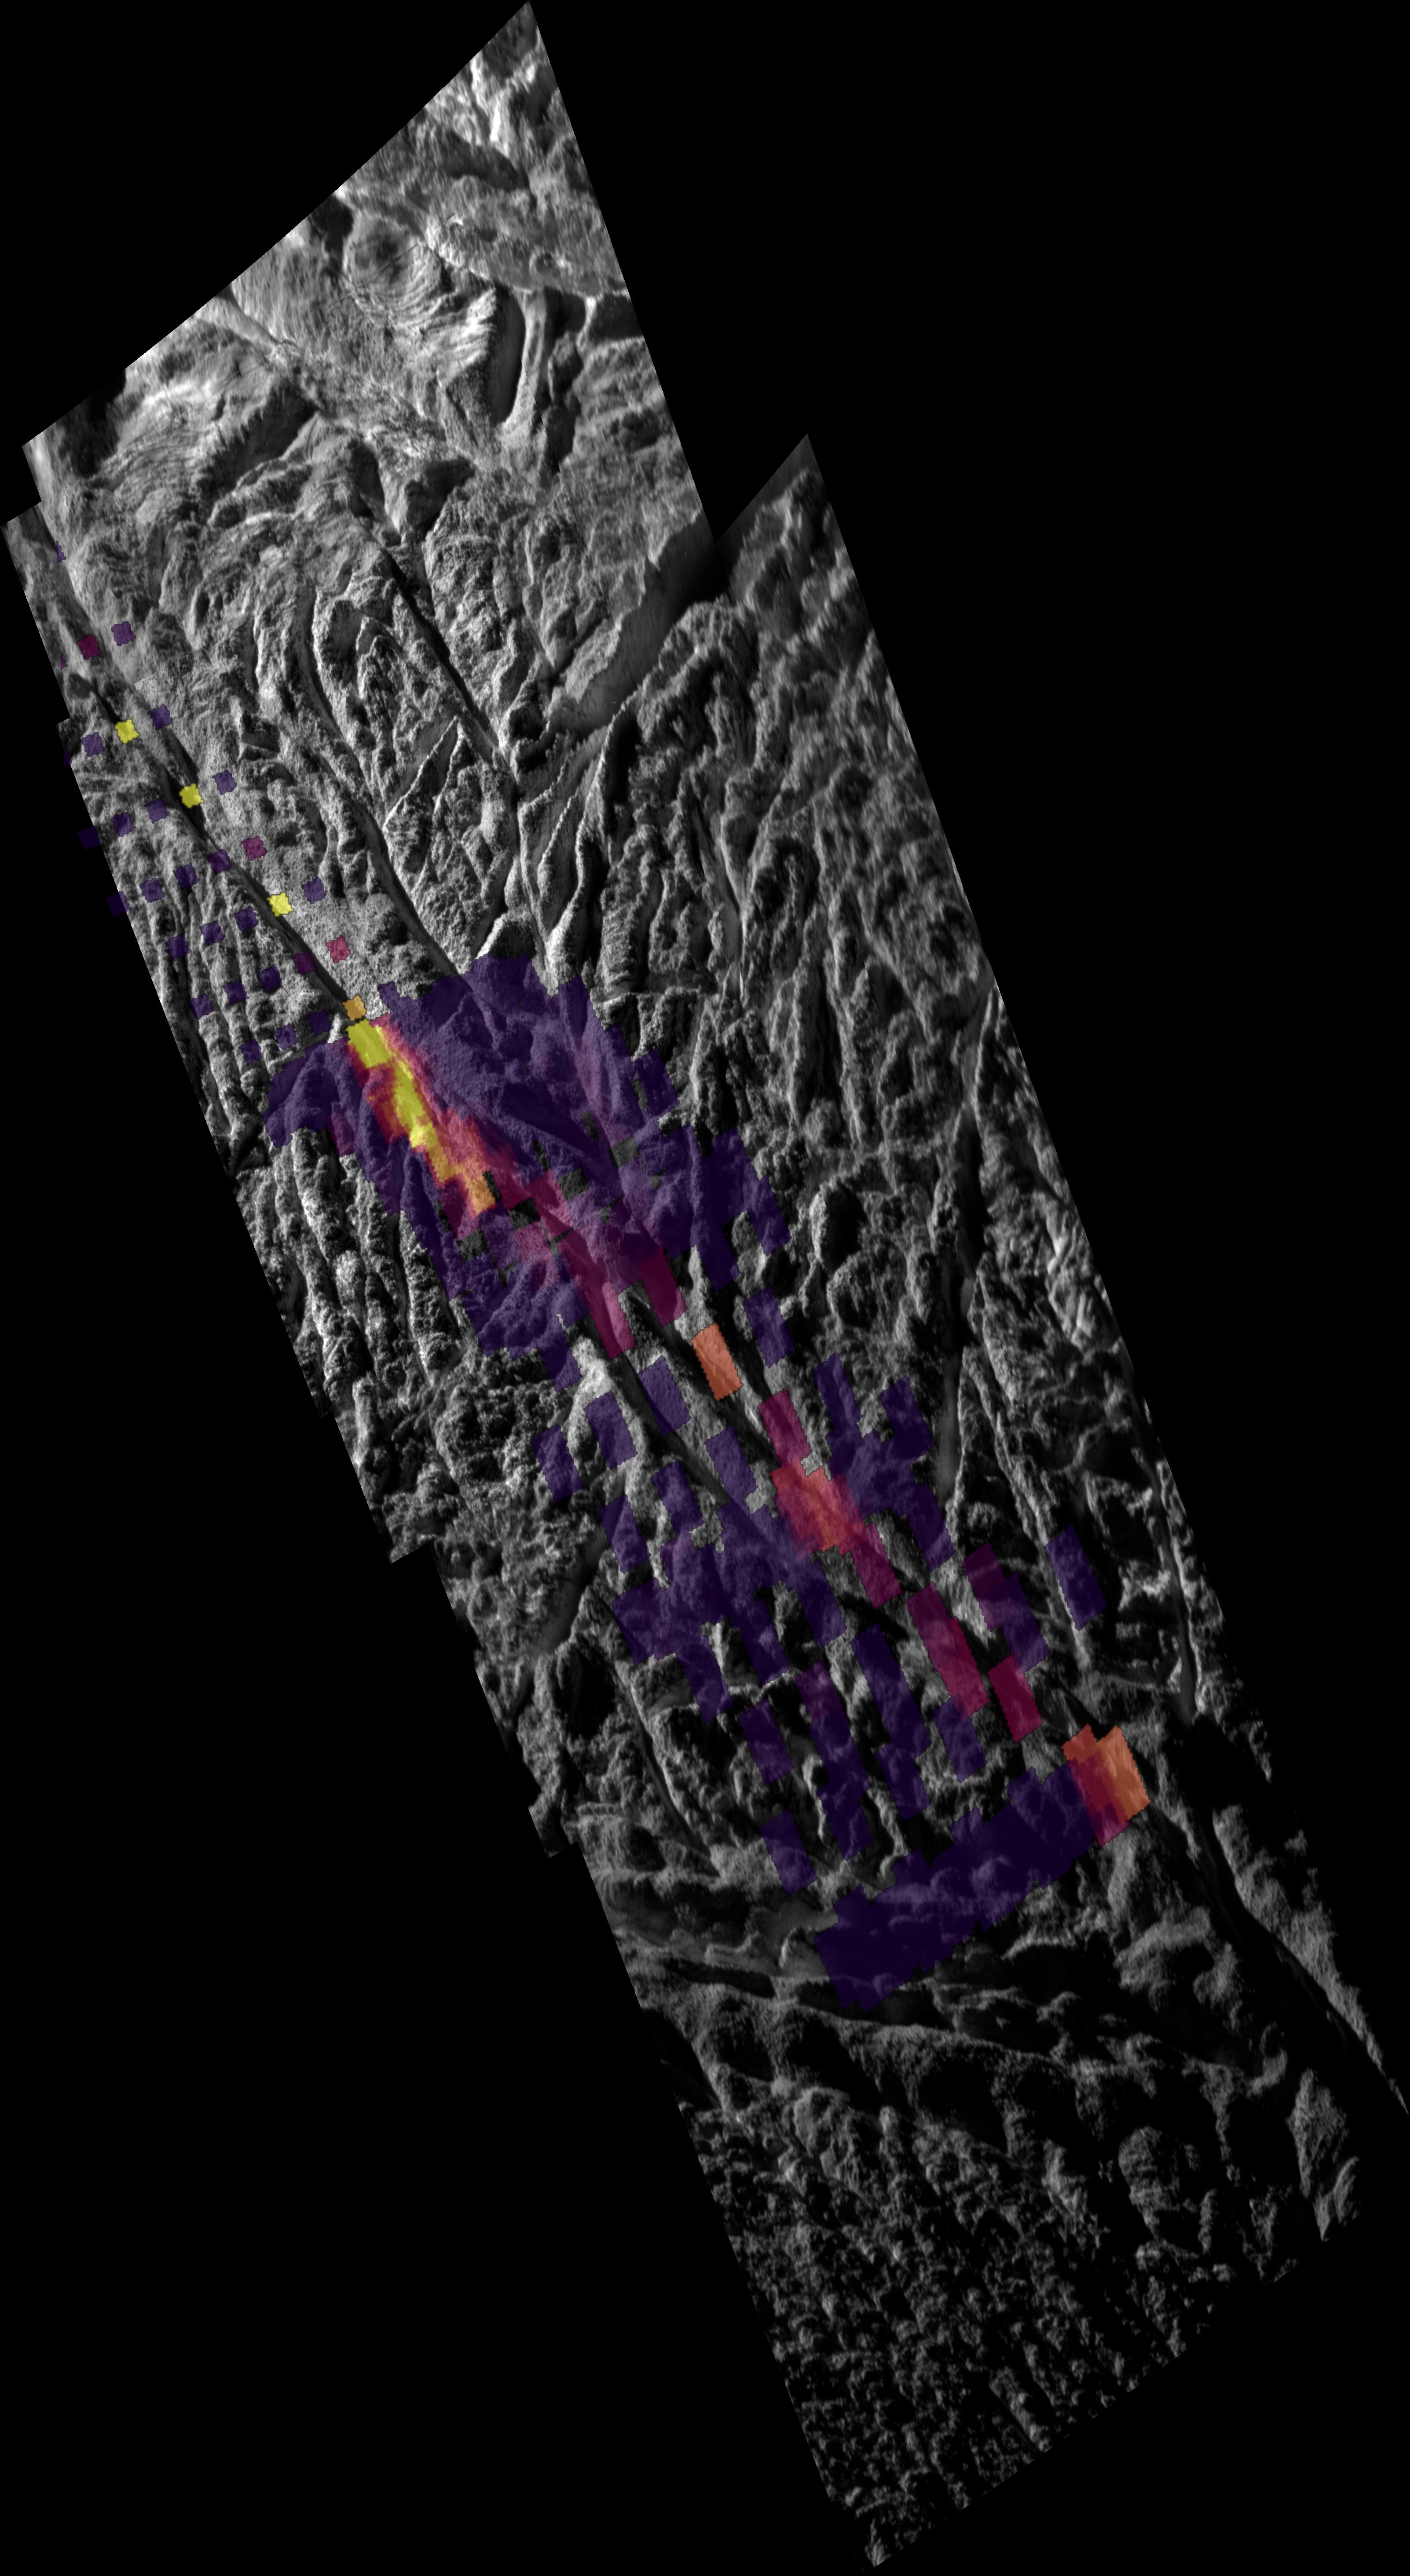
PIA11696:
Enceladus' Warm Baghdad Sulcus
Full Resolution:
TIFF
(56.3 MB)
JPEG
(1.119 MB)
2010-03-29
Mimas
Cassini-Huygens
Composite Infrared Spectrometer
Imaging Science Subsystem
1870x949x3
PIA12867:
Bizarre Temperatures on Mimas
Full Resolution:
TIFF
(5.332 MB)
JPEG
(111.6 kB)
2010-04-20
Saturn
Cassini-Huygens
Composite Infrared Spectrometer
1000x750x3
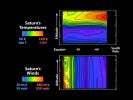
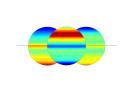
PIA13043:
Changing Temperatures in Saturn's Stratosphere
Full Resolution:
TIFF
(2.253 MB)
JPEG
(32.9 kB)
2010-11-30
Enceladus
Cassini-Huygens
Composite Infrared Spectrometer
900x900x3
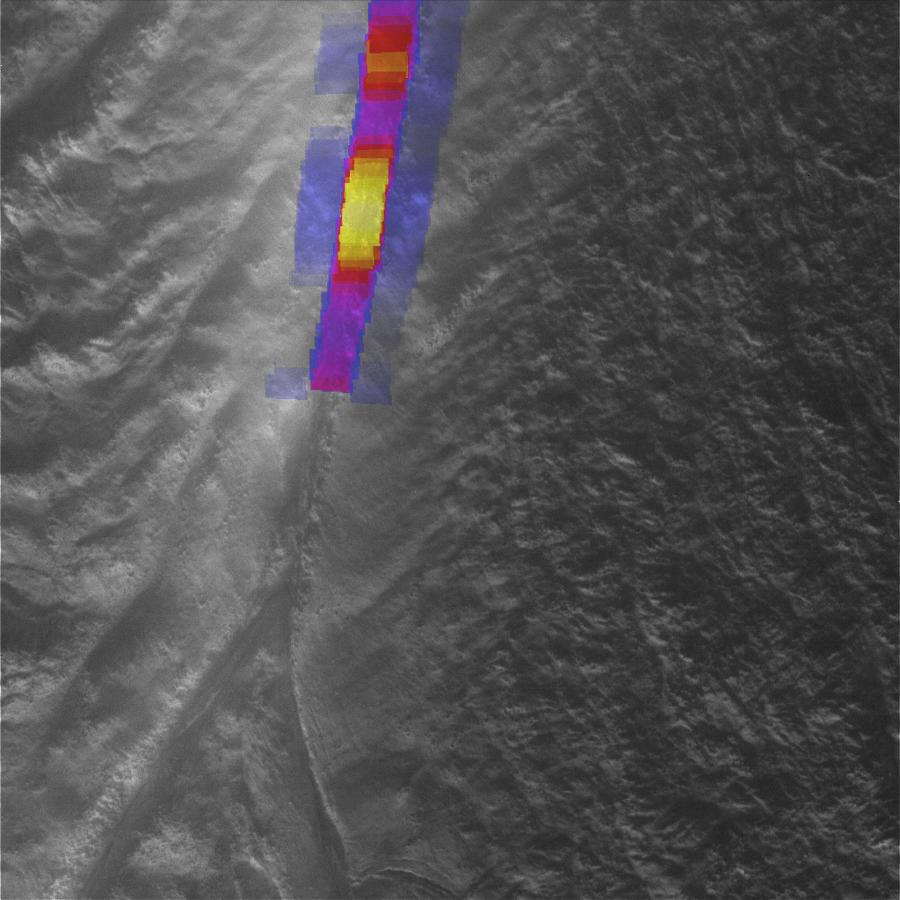
PIA13620:
Hot and Narrow Tiger Stripe
Full Resolution:
TIFF
(2.433 MB)
JPEG
(95.36 kB)
2010-11-30
Enceladus
Cassini-Huygens
Composite Infrared Spectrometer
811x508x3
PIA13621:
Tiger Stripe Split Ends
Full Resolution:
TIFF
(1.238 MB)
JPEG
(85.36 kB)
2011-03-07
Enceladus
Cassini-Huygens
Composite Infrared Spectrometer
722x308x3
PIA13891:
Enceladus the Powerhouse
Full Resolution:
TIFF
(668.2 kB)
JPEG
(41.47 kB)
2011-05-19
Saturn
Cassini-Huygens
Composite Infrared Spectrometer
1502x471x3
PIA14120:
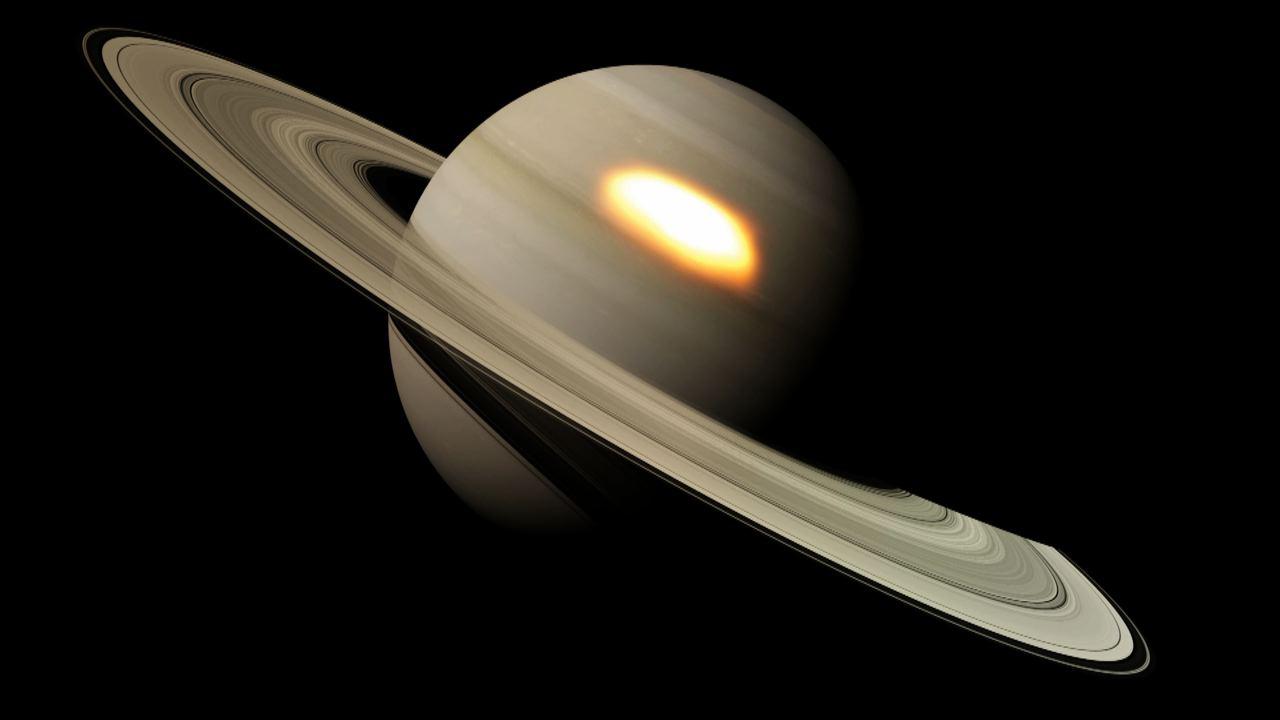
Taking the Temperature of a Saturn Storm
Full Resolution:
TIFF
(2.126 MB)
JPEG
(75.14 kB)
2012-10-25
Saturn
Cassini-Huygens
Composite Infrared Spectrometer
1280x720x3
PIA16190:
Infrared Hotspots in a Monster Saturn Storm
Full Resolution:
TIFF
(2.766 MB)
JPEG
(43.65 kB)
2012-11-26
Saturn
Cassini-Huygens
Composite Infrared Spectrometer
660x614x3
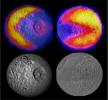
PIA16198:
A Pair of 'Pac-Men'
Full Resolution:
TIFF
(1.216 MB)
JPEG
(63.23 kB)
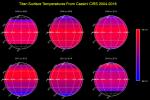
2016-02-18
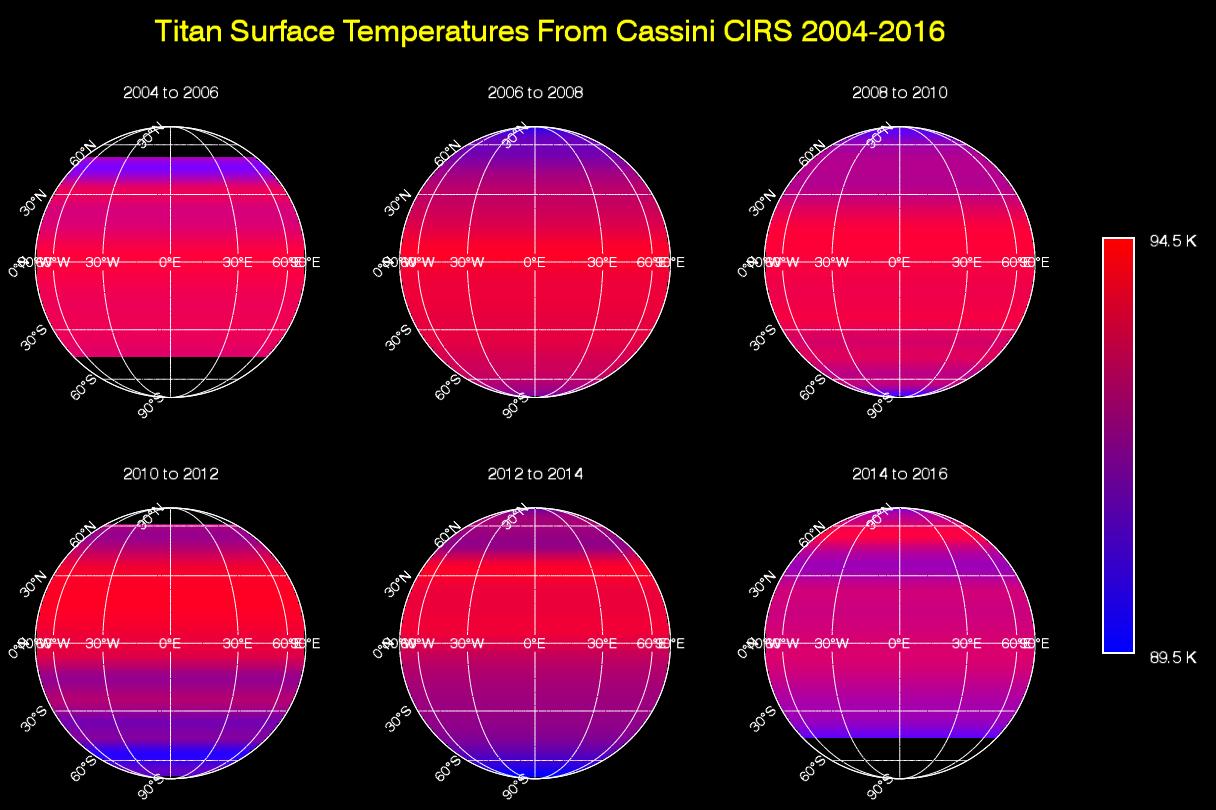
Titan
Cassini-Huygens
Composite Infrared Spectrometer
1216x810x3
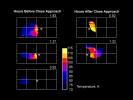
PIA20020:
Titan Temperature Lag Maps & Animation
Full Resolution:
TIFF
(346.1 kB)
JPEG
(124.2 kB)
Currently displaying images:
1 - 36
of 36


