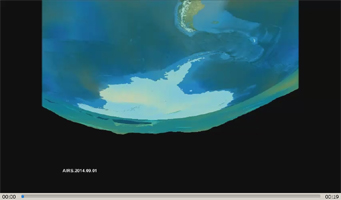
Click on the image for visualizationVisualization of the formation and evolution of the Antarctic Vortex (ozone hole) over the South Pole from Sept. 1 to Dec. 4, 2014, created using data from the Atmospheric Infrared Sounder (AIRS) instrument on NASA's Aqua spacecraft. The Antarctic Vortex forms early in polar winter and is relatively isolated from the air in the southern mid-latitudes. The extreme cold of the vortex allows microscopic-sized ice particles to form in the stratosphere. Chemical reactions occur on the surfaces of these cloud particles (known as Polar Stratospheric Clouds or PSCs) in a way that transforms stable "inactive" chlorine reservoirs into "active" chlorine molecules, after sunlight returns to the polar regions in late winter and early spring.
Ozone is then rapidly destroyed in a catalytic fashion - that is, by chemical cycles that regenerate active chlorine (with bromine compounds also involved) many times around. Ozone only returns to normal values after the vortex is broken up and mid-latitude air is able to enter the sky over Antarctica - replenishing ozone and converting the active chlorine back to an inactive form.
Visualization Approach
This visualization is a plot of an isosurface of ozone volume mixing ratio at 5 x 10^-7 parts per million. The isosurface becomes transparent above 18 kilometers. The altitude is scaled by 100 and offset by 10 kilometers. The altitude scale assumes a standard pressure-to-altitude conversion and is not a critical factor--but it allows the isosurface to be plotted on the globe. Frames in the visualization movie alternate between ascending and descending satellite orbits, with a 12-hour period between ascending and descending. Data gaps have been filled and the data are smoothed on a 3x3 grid and oversampled from 1x1 degree to 0.25 x 0.25 degree.
About AIRS
The Atmospheric Infrared Sounder, AIRS, in conjunction with the Advanced Microwave Sounding Unit, AMSU, senses emitted infrared and microwave radiation from Earth to provide a three-dimensional look at Earth's weather and climate. Working in tandem, the two instruments make simultaneous observations all the way down to Earth's surface, even in the presence of heavy clouds. With more than 2,000 channels sensing different regions of the atmosphere, the system creates a global, three-dimensional map of atmospheric temperature and humidity, cloud amounts and heights, greenhouse gas concentrations, and many other atmospheric phenomena. Launched into Earth orbit in 2002, the AIRS and AMSU instruments fly onboard NASA's Aqua spacecraft and are managed by NASA's Jet Propulsion Laboratory in Pasadena, California, under contract to NASA. JPL is a division of the California Institute of Technology in Pasadena.
More information about AIRS can be found at airs.jpl.nasa.gov.