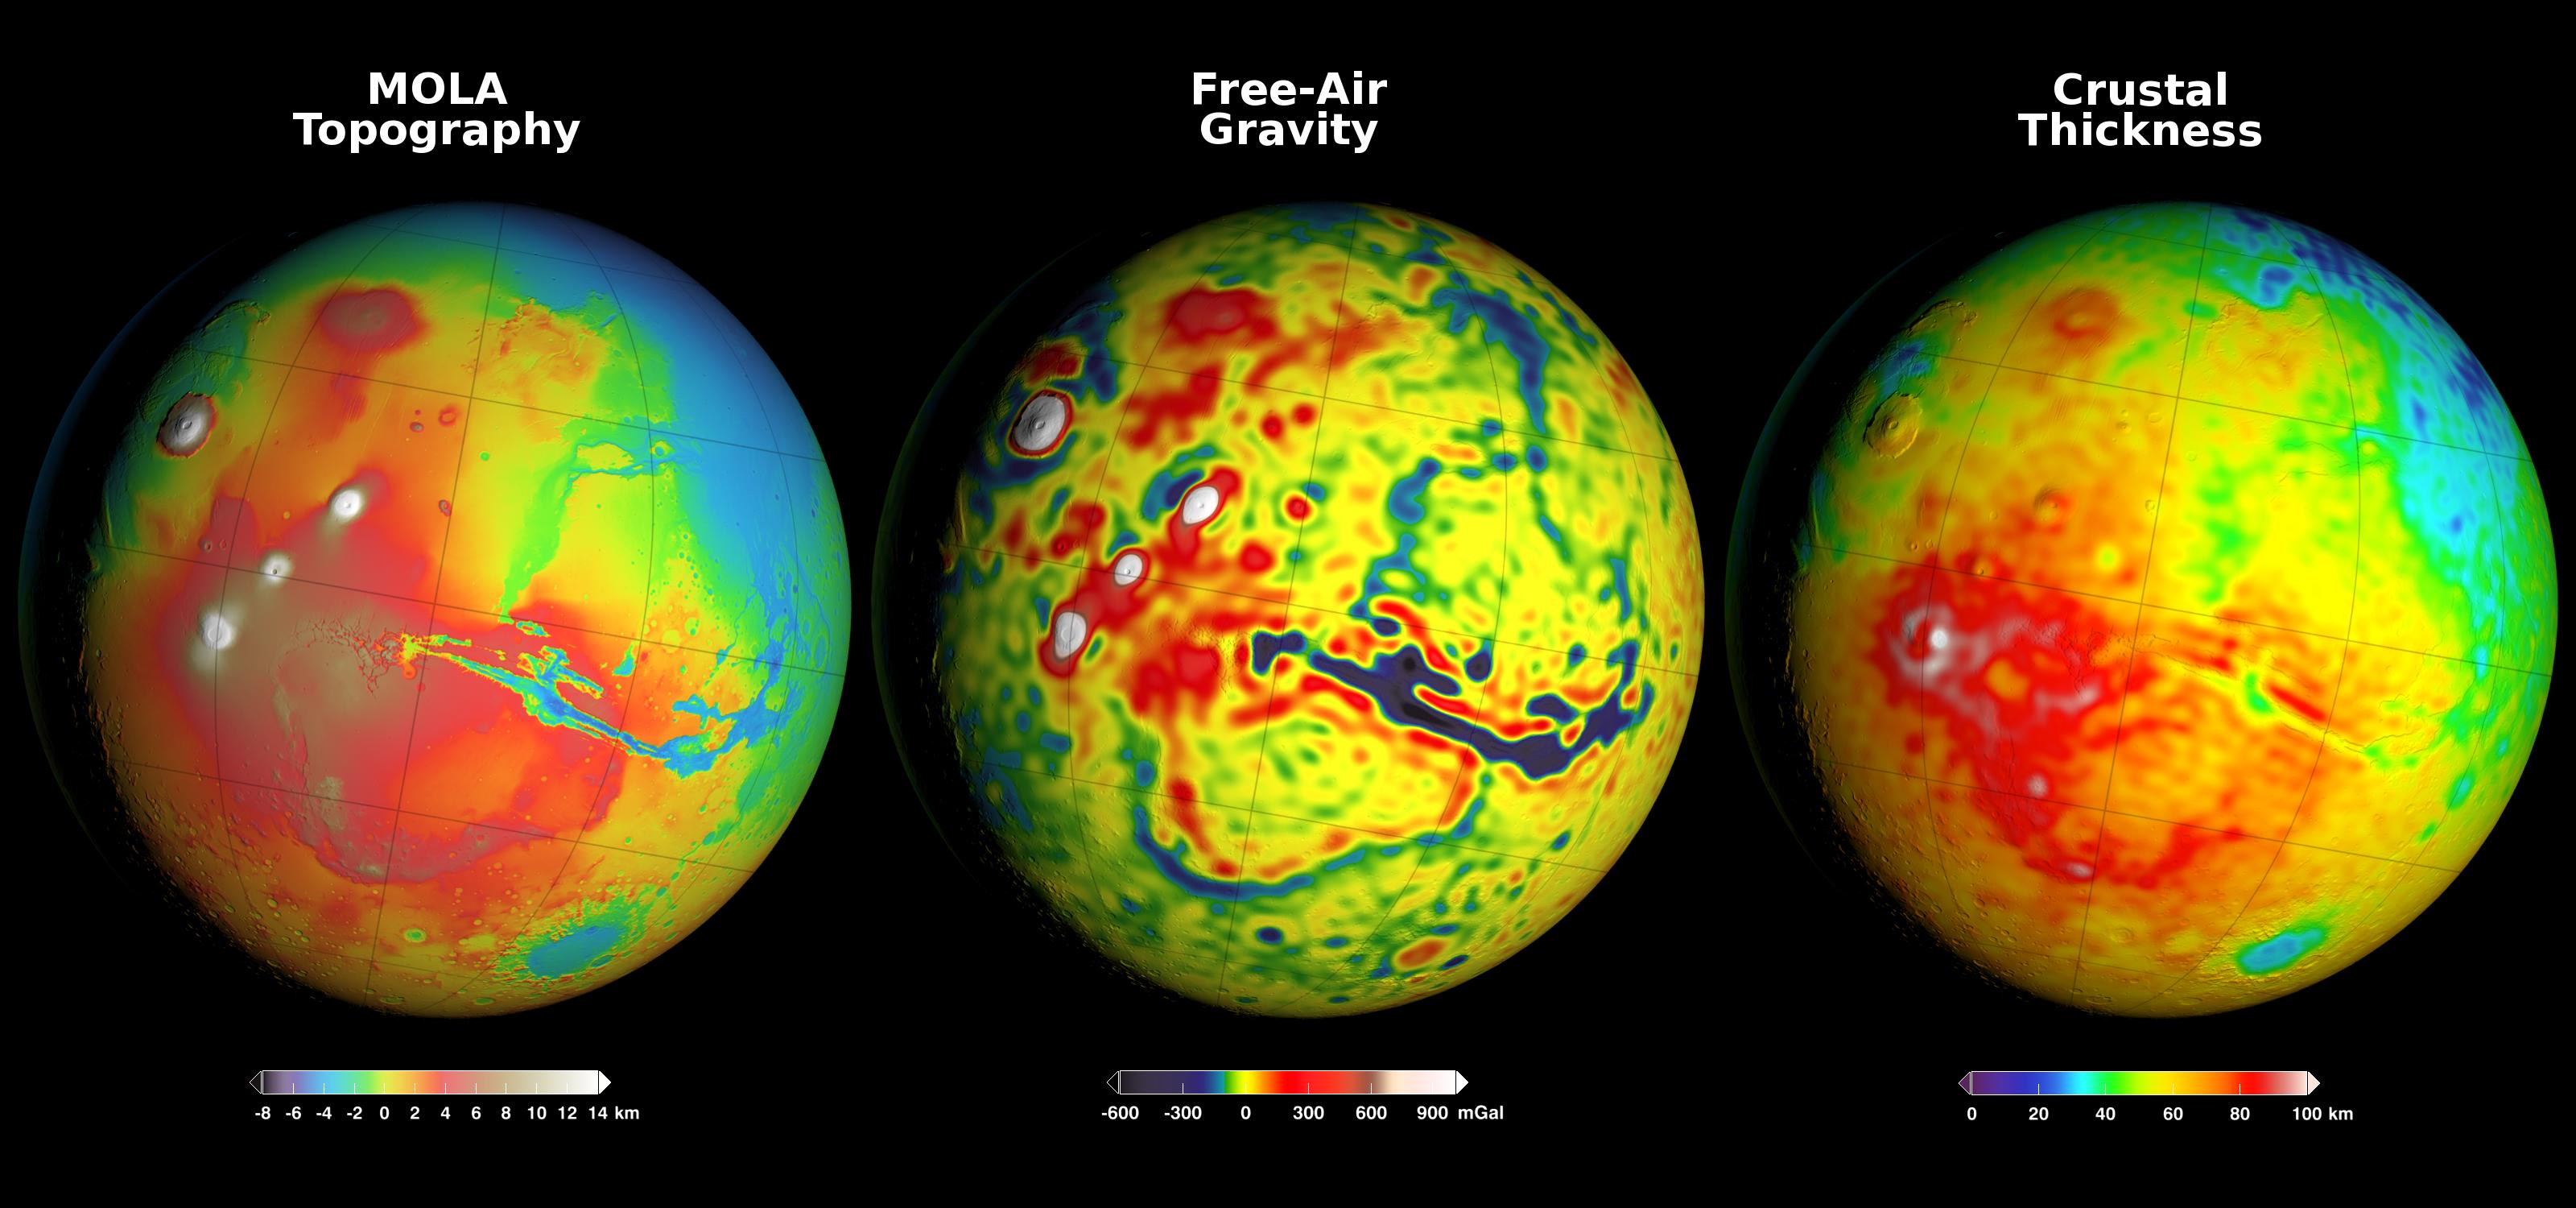
Newly detailed mapping of local variations in Mars' gravitational pull on orbiters (center), combined with topographical mapping of the planet's mountains and valleys (left) yields the best-yet mapping of Mars' crustal thickness (right).
These three views of global mapping are centered at 90 degrees west longitude, showing portions of the planet that include tall volcanoes on the left and the deep Valles Marineris canyon system just right of center. Additional views of these global maps are available at http://svs.gsfc.nasa.gov/goto?4436.
The new map of Mars' gravity (center) results from analysis of the planet's gravitational effects on orbiters passing over each location on the globe. The data come from many years of using NASA's Deep Space Network to track positions and velocities of NASA's Mars Global Surveyor, Mars Odyssey and Mars Reconnaissance Orbiter.
If Mars were a perfectly smooth sphere of uniform density, the gravity experienced by the spacecraft would be exactly the same everywhere. But like other rocky bodies in the solar system, including Earth, Mars has both a bumpy surface and a lumpy interior. As the spacecraft fly in their orbits, they experience slight variations in gravity caused by both of these irregularities, variations which show up as small changes in the velocity and altitude of the three spacecraft.
The "free-air" gravity map presents the results without any adjustment for the known bumpiness of Mars' surface. Local gravitational variations in acceleration are expressed in units called gals or galileos. The color-coding key beneath the center map indicates how colors on the map correspond to mGal (milligal) values.
The map on the left shows the known bumpiness, or topography, of the Martian surface, using data from the Mars Orbiter Laser Altimeter (MOLA) instrument on Mars Global Surveyor. Mars has no actual "sea level," but does have a defined zero elevation level. The color-coding key beneath this map indicates how the colors correspond to elevations above or below zero, in kilometers.
Analysis that subtracts effects of the surface topography from the free-air gravity mapping, combined with an assumption that crust material has a uniform density, leads to the derived mapping of crustal thickness -- or subsurface "lumpiness" -- on the right. Highs in gravity indicate places where the denser mantle material beneath the crust is closer to the surface, and hence where the crust is thinner. The color-coding key for this map indicates how the colors on the map correspond to the thickness of the crust, in kilometers.
 Planetary Data System


