 |  |
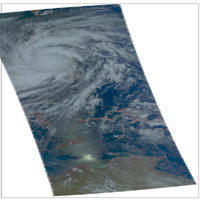
| Visible AIRS Image | OSCAT Radar Scatterometer
Image Credit: ISRO/NASA/JPL-Caltech |
Click on an individual image for full resolution figures imageSatellite images obtained from NASA's Atmospheric Infrared Sounder (AIRS) instrument aboard NASA's Aqua spacecraft and the Indian Space Research Organization's OceanSAT-2 ocean wind scatterometer provide a glimpse into one of the most powerful storms ever recorded on Earth.
According to the U.S. Navy Joint Typhoon Warning Center, Typhoon Haiyan had maximum sustained winds of 195 mph (314 kilometers per hour), with gusts up to 235 mph (379 kilometers per hour) shortly before making landfall in the central Philippines on Nov. 8, 2013. That would make it one of the strongest storms ever recorded. Weather officials in the Philippines reported the storm, known locally as Typhoon Yolanda, came ashore with maximum sustained winds of 147 mph (235 kilometers per hour) and gusts of up to 170 mph (275 miles per hour).
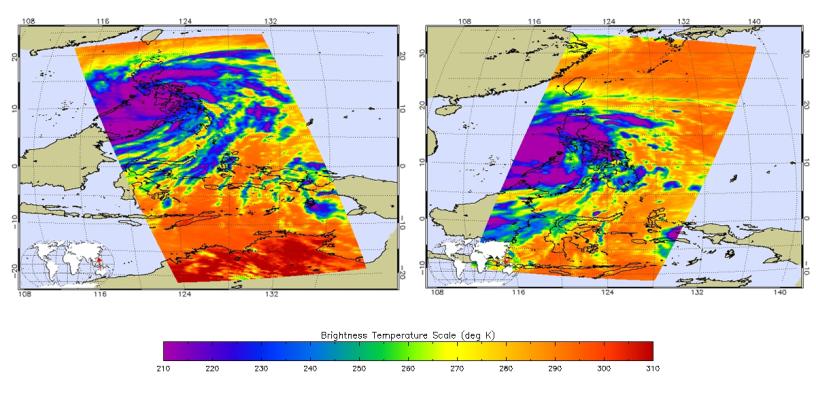
The two AIRS images, acquired at 8:59 p.m. PST on Nov. 7 (left) and 9:17 a.m. PST on Nov. 8 (right), show the powerful storm in infrared. When the image on the left was acquired, the storm was located 214 miles (344 kilometers) south-southeast of Manila. By the time the image on the right was acquired, the fast-moving storm was already centered west of the Philippines, on a forecast track that will take it to Vietnam. The storm's coldest cloud-top temperatures are indicated by the brightest shades of purple, and show where Haiyan's heaviest rainfall was occurring.
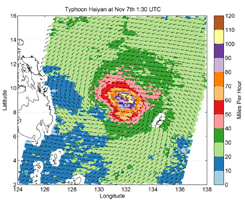
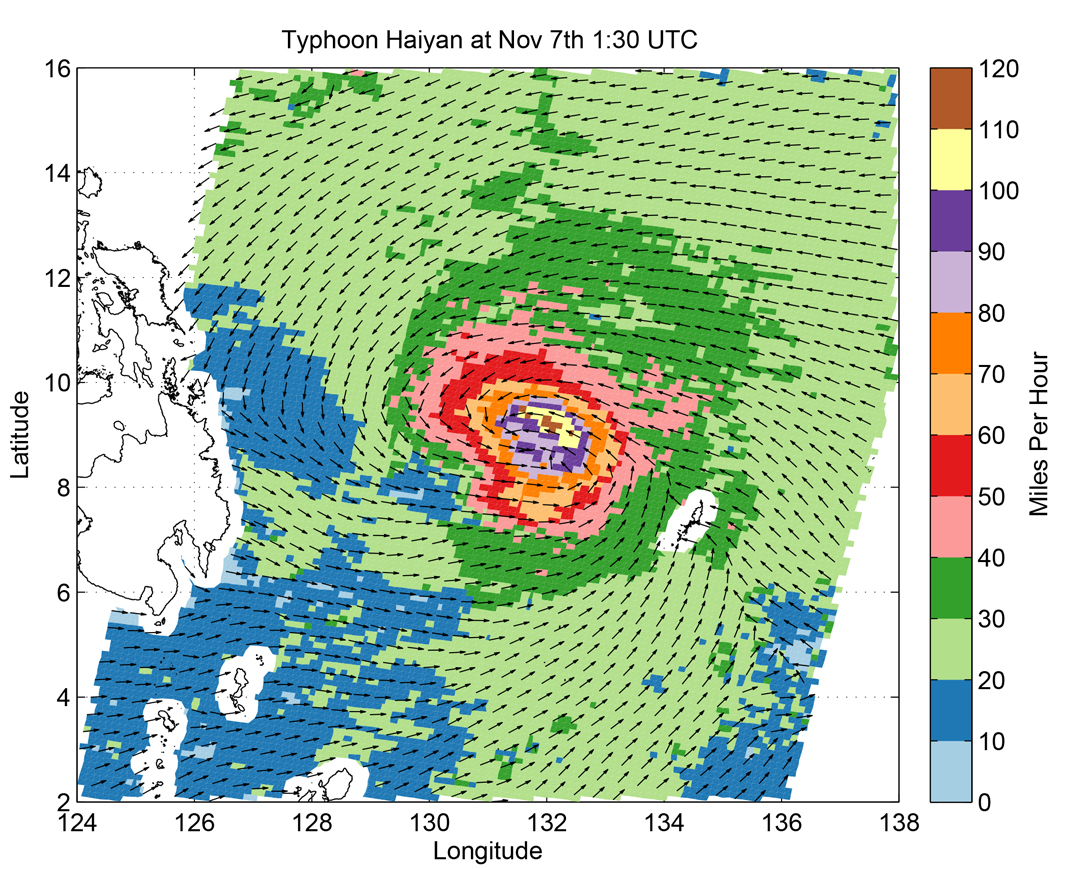
Another image, from the OSCAT radar scatterometer on the Indian Space Research Organization's OceanSAT-2 satellite, shows Haiyan's ocean surface winds at 5:30 p.m. PST on Nov. 6. The wind data were calculated by scientists at NASA's Jet Propulsion Laboratory, Pasadena, Calif., using an advanced wind retrieval algorithm designed for tropical cyclone conditions. The colors indicate wind speed and arrows indicate wind direction. The wind speeds were measured in 15-by-15-mile (24-by-24-kilometer) boxes that recorded a maximum value of 128 miles, or 206 kilometers, per hour). That's why these wind speeds are lower than the maximum small-scale winds calculated by the U.S. Navy Joint Typhoon Warning Center.
About AIRS
The Atmospheric Infrared Sounder, AIRS, in conjunction with the Advanced Microwave Sounding Unit, AMSU, senses emitted infrared and microwave radiation from Earth to provide a three-dimensional look at Earth's weather and climate. Working in tandem, the two instruments make simultaneous observations all the way down to Earth's surface, even in the presence of heavy clouds. With more than 2,000 channels sensing different regions of the atmosphere, the system creates a global, three-dimensional map of atmospheric temperature and humidity, cloud amounts and heights, greenhouse gas concentrations, and many other atmospheric phenomena. Launched into Earth orbit in 2002, the AIRS and AMSU instruments fly onboard NASA's Aqua spacecraft and are managed by NASA's Jet Propulsion Laboratory in Pasadena, Calif., under contract to NASA. JPL is a division of the California Institute of Technology in Pasadena.
More information about AIRS can be found at http://airs.jpl.nasa.gov.
