 |  |  |  |
| October 14 | November 1 | November 16 | December 1 |
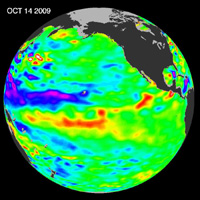
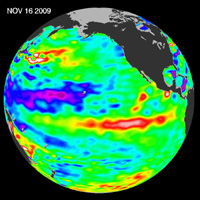
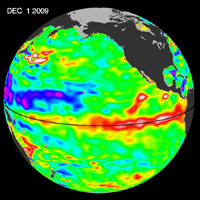
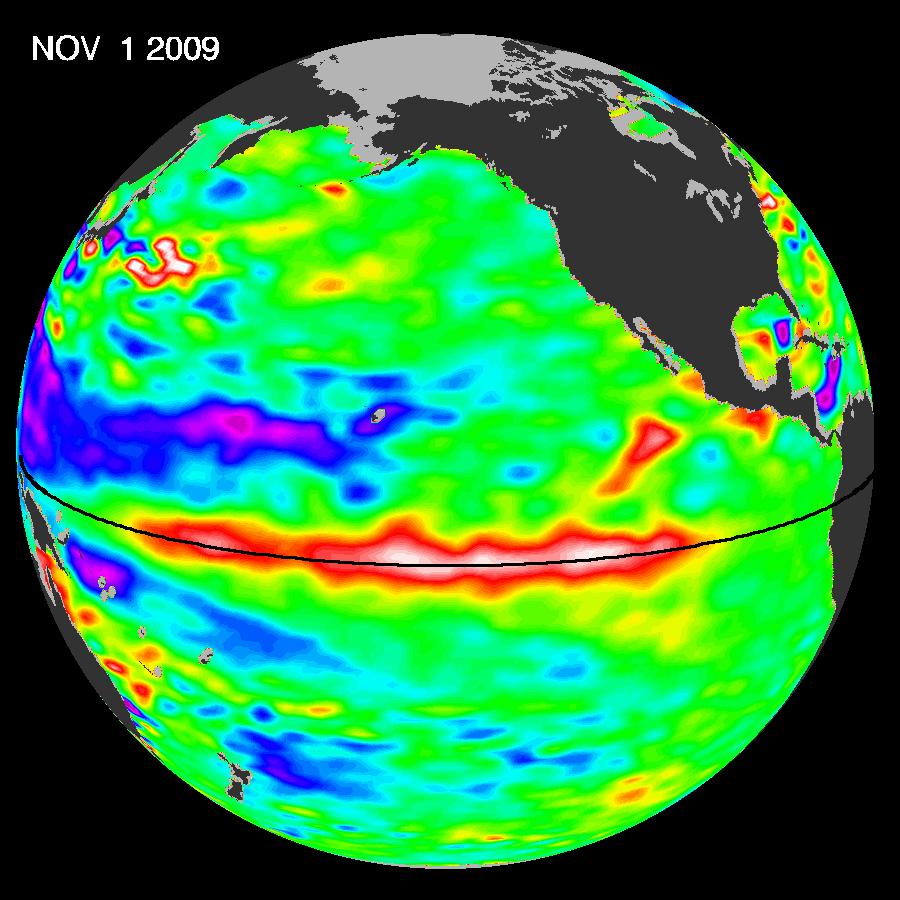
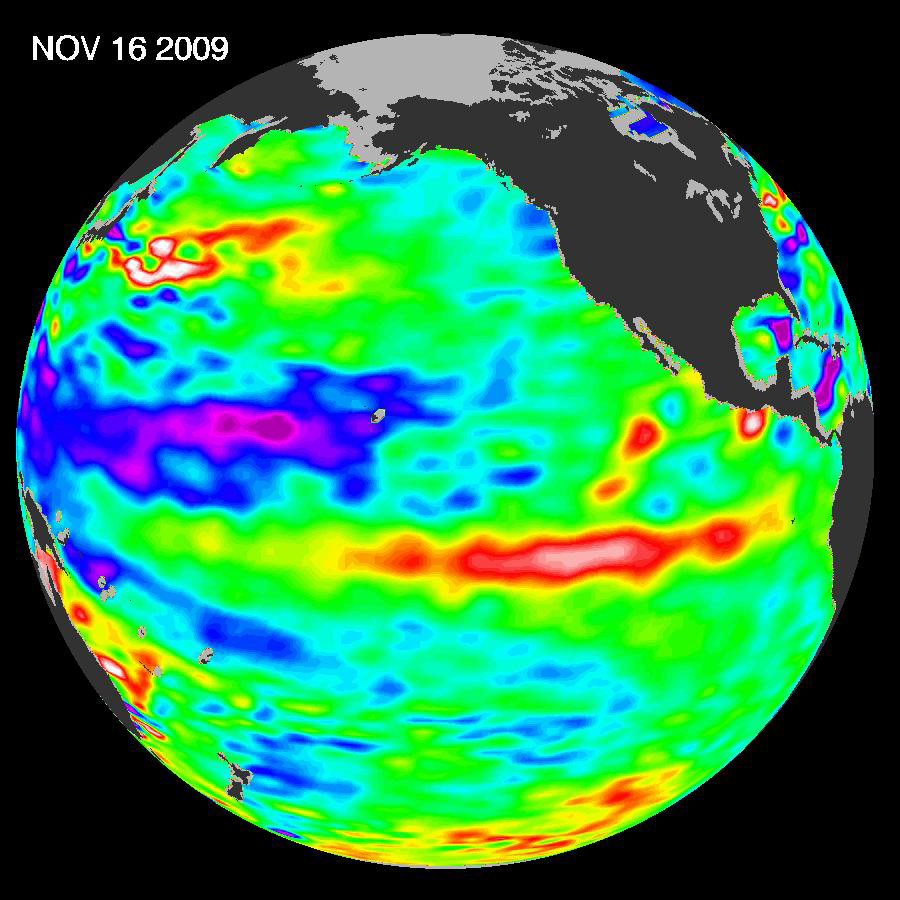
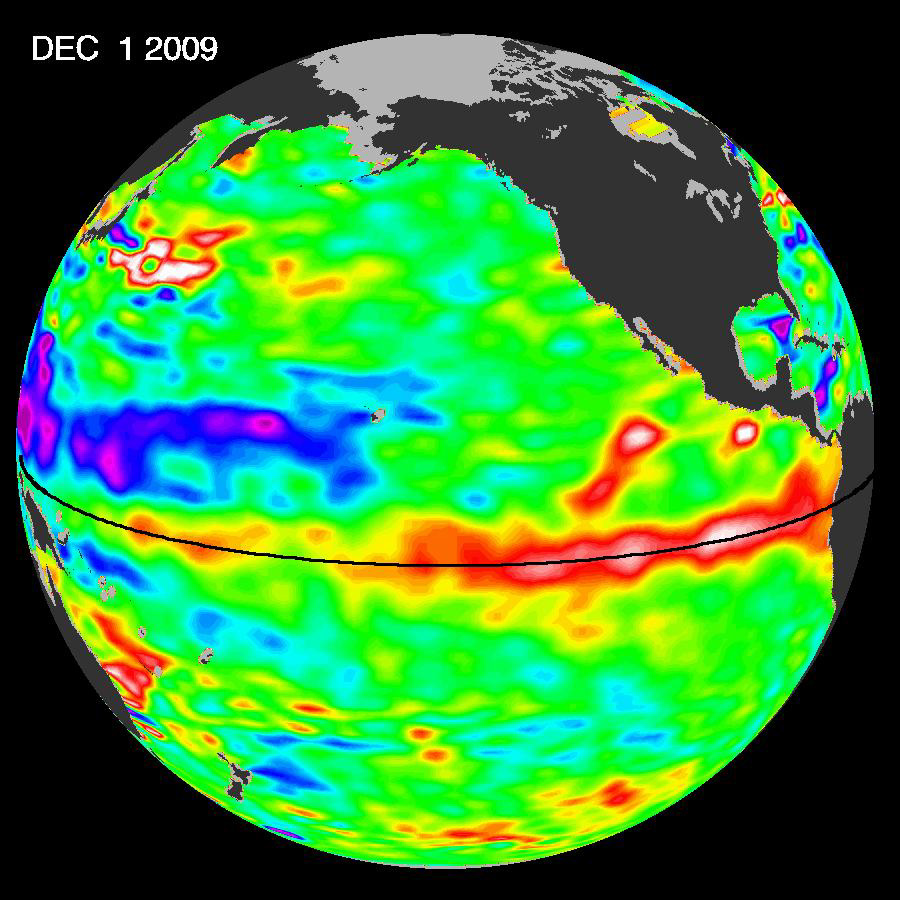
Click on individual image for larger viewThe most recent sea-level height data from the NASA/European Ocean Surface Topography Mission/Jason-2 oceanography satellite show the continued eastward progression of a strong wave of warm water, known as a Kelvin wave, that is now approaching South America. In the eastern equatorial Pacific, this "warm wave" appears as the large area of higher-than-normal sea surface heights (warmer-than-normal sea surface temperatures) between 130 degrees west and the coast of Peru. A series of these types of Kelvin wave events that began in June 2009 initially triggered and has sustained the present El Ni˝o condition.
The series of Jason-2 images from mid-October 2009 to the present, December 1, 2009, illustrate how sustained weakening of trade winds in the western and central equatorial Pacific beginning in October 2009 excited these eastward moving waves that are now raising sea levels off South America.
This image of sea-level height anomaly was created with data collected by the U.S./European satellite during a 10-day period centered on December 1, 2009. It shows a red and white area in the central and eastern equatorial Pacific that is about 10 to 18 centimeters (4 to 7 inches) above normal. These regions contrast with the western equatorial Pacific, where lower than-normal sea levels (blue and purple areas) are between 8 to 15 centimeters (3 and 6 inches) below normal. Along the equator, the red and white colors depict areas where sea surface temperatures are more than one to two degrees Celsius above normal (two to four degrees Fahrenheit).
For more information on NASA's ocean surface topography missions, see http://sealevel.jpl.nasa.gov/ or to view the latest Jason data see http://sealevel.jpl.nasa.gov/science/jason1-quick-look/.

