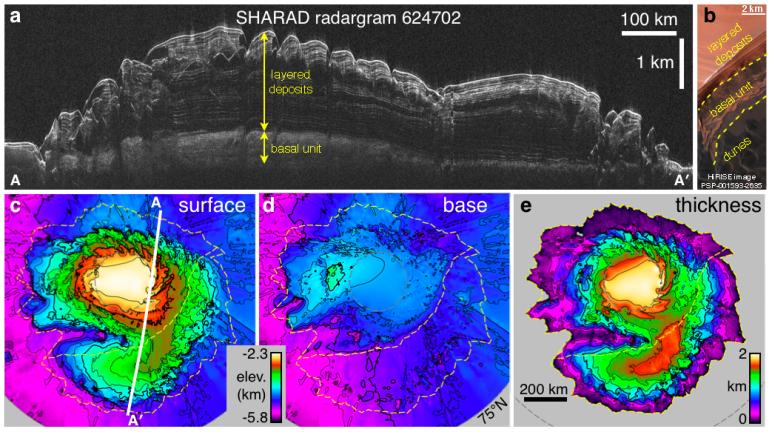
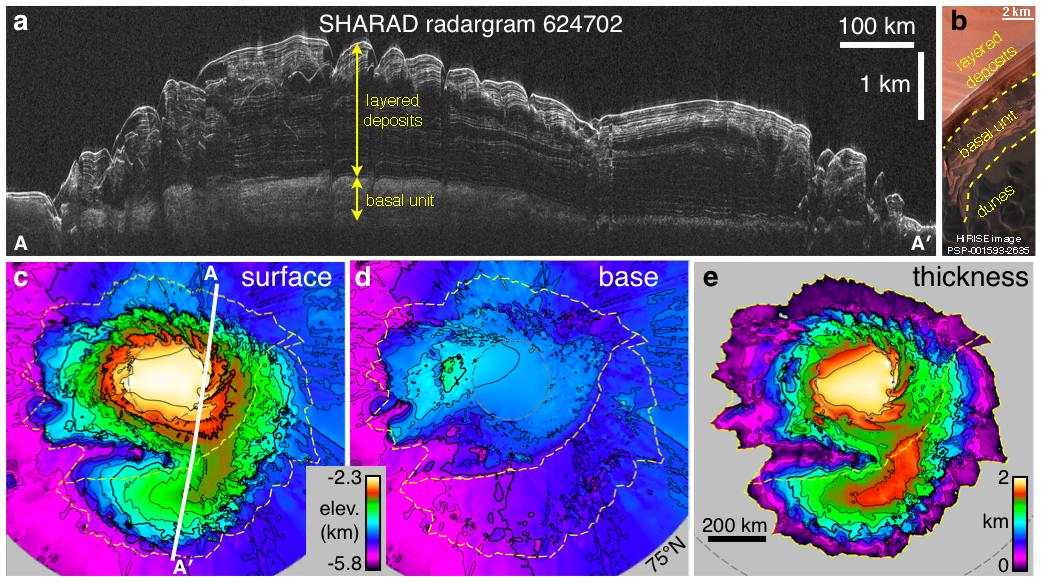
This composite graphic illustrates the use of the Shallow Radar instrument on NASA's Mars Reconnaissance Orbiter for mapping underground ice-rich layers of the north polar layered terrain on Mars.
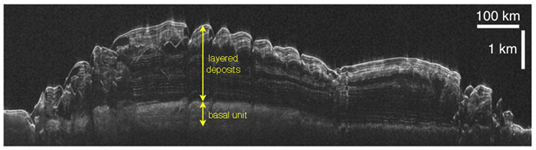
Panel "a" is a radargram from the instrument, showing a cross-section of Mars' north polar cap, based on time lags of radio-wave echoes returning from different layers. The penetrating radar reveals icy layered deposits overlying a basal unit in some areas. The vertical dimension in the cross section is exaggerated one-hundred-fold compared with the horizontal dimension. The vertical scale bar is one kilometer (3,281 feet). The horizontal scale bar is 100 kilometers (62 miles).
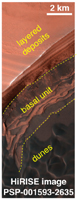
Panel "b" is an image from the High Resolution Imaging Science Experiment camera, also on NASA's Mars Reconnaissance Orbiter. It shows the layered deposits and the basal unit in outcrop exposed near the edge of the polar cap. The scale bar is 2 kilometers (1.24 miles). This is a cutout from an observation taken on taken Nov. 28, 2006, at 83.4 degrees north latitude and 118.8 degrees east longitude. Full-frame versions of the observation are available at http://hirise.lpl.arizona.edu/PSP_001593_2635.
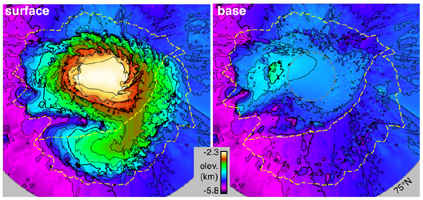
Panel "c" is a radar-generated map of the surface elevation of the polar region. The white line from A to A' is the ground track for the radargram in Panel "a." Yellow dashed lines show the extent of the basal unit (upper-left region) and of the layered deposits. The color-coded reference bar for elevations in panes "c" and "d" shows elevations ranging from yellow at 2.3 kilometers (1.4 miles) below the standard reference level for Mars to violet at 5.8 kilometers (3.6 miles) below that reference.
Panel "d" is a radar-generated map of the elevation at the base of the layered deposits, showing no basal deflection in the lower-right region (despite the mass of overlying layers) and about 1 kilometer (0.6. mile) of basal unit deposits in the upper-left region.
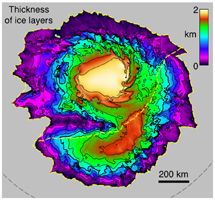
Panel "e" is a radar-generated map of the thickness of the layered deposits, the difference between the surface elevations mapped in "c" and the base elevations mapped in "d." The total volume of the layered deposits is 821,000 cubic kilometers (197,000 cubic miles), about 30 percent that of Earth's Greenland ice sheet. The scale bar of 200 kilometers (124 miles) applies also to panes "c" and "d." The color-coded reference bar indicates thicknesses ranging from yellow at 2 kilometers (1.24 miles) to black at zero thickness.
The illustration is adapted from a 2009 paper by Putzig et al. in the journal Icarus.
The Shallow Radar instrument was provided by the Italian Space Agency. Its operations are led by the University of Rome and its data are analyzed by a joint U.S.-Italian science team. NASA's Jet Propulsion Laboratory, a division of the California Institute of Technology in Pasadena, manages the Mars Reconnaissance Orbiter for the NASA Science Mission Directorate, Washington. Lockheed Martin Space Systems, Denver, is the prime contractor for the project and built the spacecraft. The High Resolution Imaging Science Experiment is operated by the University of Arizona, Tucson, and the instrument was built by Ball Aerospace & Technologies Corp., Boulder, Colo.